Publisher’s version / Version de l'éditeur:
Vous avez des questions? Nous pouvons vous aider. Pour communiquer directement avec un auteur, consultez la première page de la revue dans laquelle son article a été publié afin de trouver ses coordonnées. Si vous n’arrivez pas à les repérer, communiquez avec nous à PublicationsArchive-ArchivesPublications@nrc-cnrc.gc.ca.
Questions? Contact the NRC Publications Archive team at
PublicationsArchive-ArchivesPublications@nrc-cnrc.gc.ca. If you wish to email the authors directly, please see the first page of the publication for their contact information.
https://publications-cnrc.canada.ca/fra/droits
L’accès à ce site Web et l’utilisation de son contenu sont assujettis aux conditions présentées dans le site LISEZ CES CONDITIONS ATTENTIVEMENT AVANT D’UTILISER CE SITE WEB.
Cement and Concrete Research, 7, September 5, pp. 585-596, 1977-09-01
READ THESE TERMS AND CONDITIONS CAREFULLY BEFORE USING THIS WEBSITE. https://nrc-publications.canada.ca/eng/copyright
NRC Publications Archive Record / Notice des Archives des publications du CNRC :
https://nrc-publications.canada.ca/eng/view/object/?id=29965045-fc37-41ad-9bbd-5ddbc0f3b36d
https://publications-cnrc.canada.ca/fra/voir/objet/?id=29965045-fc37-41ad-9bbd-5ddbc0f3b36d
NRC Publications Archive
Archives des publications du CNRC
This publication could be one of several versions: author’s original, accepted manuscript or the publisher’s version. / La version de cette publication peut être l’une des suivantes : la version prépublication de l’auteur, la version acceptée du manuscrit ou la version de l’éditeur.
For the publisher’s version, please access the DOI link below./ Pour consulter la version de l’éditeur, utilisez le lien DOI ci-dessous.
https://doi.org/10.1016/0008-8846(77)90120-X
Access and use of this website and the material on it are subject to the Terms and Conditions set forth at
The flow of helium into the microspaces of magnesium oxysulfate
cement paste
NATIONAL
RESEARCH COUNCIL OF
CANADA
OONSEIL NATIONAL
DE
RECHERCHES DU CANADA
FLOW OF HELIUM INTO THE MICROSPACES
OF MAGNESIUM OXYSULFATE
CEMENT PASTE
by
J. J. Beaudoin and R. F. Feldman
9
Reprinted from
CEMENTANDCONCRETERESEARCH
Vol. 7, September 1977DBR Paper No. 729 Division of Building Research
Price 25 cents Ol-rAWA
65366
CEMENT and CONCRETE RESEARCH. Vol. 7, pp. 585-596, 1977. Pergamon Press, Inc. P r i n t e d i n t h e U n i t e d States.
THE FLOW OF HELIUM INTO THE MICROSPACES OF MAGNESIUM OXYSULFATE CEMENT PASTE
J.J. Beaudoin and R.F. Feldman
Materials Section, Division of Building Research National Research Council of Canada, Ottawa, Canada.
(Communicated by F. H. Wittmann) (Received J u l y 14, 1977) ABSTRACT
Helium flow measurements were made on samples of magnesium oxysulfate cement paste initially conditioned at 11% R.H. and dried in stages by combinations of pumping and heating. Physical changes in the
microstructure of the cement paste due to chemical decomposition and water removal were monitored. It was concluded that helium can penetrate the microspaces of magnesium oxysulfate cement paste which form during removal of structural water. It appears that helium also enters discrete pores (unfilled with water) that become accessible when the cement paste is heated to 200°C. Mercury (at 407 MPa) can intrude into those microspaces not initially accessible to helium. Collapse of structure occurs when water is removed from this system. An estimate of the density of the water removed up to 15% weight change was 1.21
+
0.07 g/ec.Des mesures du flux d'h6lium ont 6t6 pratiqu6es sur des 6chantillons de. pBte de ciment d'oxysulfate de magn6sium conditionngs initialement
2 11% HR et s6ch6s par 6tapes en op6rations d'ensemble de pompage et
de chauffage. Des changements physiques dans la microstructure de la pste de ciment caus6s par la d6composition chimique et l'enlsvement de l'eau ont 6t6 observ6s. I1 a 6t6 conclu que l'h6lium peut p6n6trer dans les vides microscopiques de la pzte de ciment d'oxysulfate de magn6sium q11i se produisent en enlevant l'eau structurale. I1 apparait que l'h6lium entre aussi dans les petits pores (vides d'eau) qui deviennent accessibles lorsque la pzte de ciment est chauff6e ii 200"~. Le mercure (2 407 MPa) peut s'introduire dans ces vides microscopiques qui ne sont pas au d6part accessibles 5 l'h6lium. L'effondrement des structures se produit lorsque l'eau est retir6e de ce systsme. Une 6valuation de la densit6 de l'eau enlev6e jusqu'ii 15% du changement de poids 6tait 1.21
+
0.07 ~ / c c .Vol.
7,
No.
5
J.
3.
Beaudoin,
K . F .Feldman
IntroductionSore1 was the first to recognize the potential use of magnesium oxysulfate
cement as a binder (1). This cement. has good fire resistance and insulation
properties and is less sensitive to high temperatures than oxychloride. It is used particularly in prefabricated structural units that require processing at elevated temperatures. Recent proposals have discussed the use of this cement for nuclear applications as it is a more efficient neutron captor than portland cement. Magnesium oxysulfate is obtained by the reaction of an aqueous
solution of magnesium sulfate (MgS04.7H20) with magnesium oxide.
Depending on the conditions of formation, four types of oxysulfate
complexes are known to form (2,3). These are: 5Mg(OH)2.MgS04.3H20 (or
.
2H20), 3Mg (OH) 2. MgS04. 8H20, Mg (OH) 2. MgS04. 5H2O and Mg (OH) 2. 2MgS04. 3H20;however, only 3Mg(OH) 2.MgS04. 8H20 appears to be stable below about 3S°C (3). It has been shown that porosity is an important property in strength determinations of oxysulfate cement (4); however, there appears to be no published information elucidating the nature of the pore spaces in this system and how they are affected by the instability of the solid phase during drying. Recently, a new technique, employing the diffusion of helium gas, has been shown to be a useful tool in studying changes during drying in the solid phase
of hydrated portland cement (5). This technique provides the means of obser-
ving changes in solid volume due to drying as well as the capability of measur ing quantitatively the creation of space due to the decomposition of complex hydrates, i.e., space resulting from the removal of hydrate water.
Helium diffusion methods have detected collapse of structure on removal of structural water in hydrated portland cement past.e as well as aging phenomena; this structural water had an important role in the mechanical behaviour of the solid material. These methods provided new information that was valuable in the evolution of a model for hydrated portland cement paste. It was thought that the helium diffusion technique could also be used to elucidate the pore structure of magnesium oxysulfate paste; this study is a report of the results obtained from the application of this technique to the oxysulfate system.
Experimental Materials
(a) Magnesium Oxide. The MgO powder was supplied by Basic Chemicals, Cleveland, Ohio. It had the following characteristics: N2 surface area,
20m2/~; active CaO 1.5%; ignition loss 4%; fraction passing through 200 mesh,
98%. The material satisfied the requirements of ASTM C-275-61.
(b) Magnesium Sulfate Solution. Aqueous solutions were prepared by mixing MgS04.7H20, as supplied by Anachemia, in a dry form with distilled water. A partially saturated solution having specific gravity 1.18 and a saturated
solution with specific gravity 1.303 were prepared. Preparation of Specimens
Series I - Cement paste samples were prepared at MgS04.7H20/Mg0 solution-solid
ratios of 0.72 and 1.07 using the partially saturated MgS04.7H20 solution. Specimens having a solution-solid ratio of 0.72 were cast in cube molds and
cured at 50% R.H. for 2 weeks. Discs 3.2 cm in diameter, 1.3 mm thick, were
cut from 3.2 cm cores obtained from the cube samples. The discs were stored at 11% R.H. for periods up to 3 months. Specimens having a soln/solid ratio of 1.07 were cast in 3.2 cm diameter rubes thzt were rotated during the
hydration process to prevent segregation. After demolding, the samples were
sliced into discs 1.3 mm thick and then conditioned at 11% R.H. Series I
samples had surface areas as determined by N2 adsorption of 15.7 m2/g (soh/
V o l . 7, No. 5 587 HELIUM FLOW, MAGNESIUM OXYSULFATE CEMENT
Series I1 - Cement paste samples were prepared at a soln/solid. ratio of
0.72 using, in contrast to Series I, the saturated Mg.SO4.7H20 solution.
Series I1 samples had a surface area as determined by N2 adsorption of 5.2 m2/g. Disc samples were prepared as described previously for Series I samples. The discs were conditioned at 11% R.H. as with Series I, except that they were placed at 32% R.H. for approximately 3 days prier to the helium diffusion experiments. As Series I and Series I1 samples represent two distinctly different preparations, results are not dirkctly comparable; however, it was felt that placing Series I1 samples at 32% R.H. prior to drying would generate some preliminary information regarding volume change characteristics resulting from re-wetting this system.
Procedures Helium Comparison Pycnometry and Helium Flow
The apparatus and procedure for helium flow measurements are described in detail in previous papers (5,6,7). At the end of 60 h of helium flow, the density of the material is measured. The technique uses the gas laws and the assumption of ideal gas behaviour to calculate the solid volume of a sample. Small spaces or "poresw, which cause a delayed flow of helium into the sample, are, in the first instance, regarded as part of the solid.
General Procedure
The helium flow and density were measured at different moisture contents,
starting from the 11% R.H. condition for Series
I
samples and 32% R.H.conditionfor Series 11 samp2es. Moisture was then removed incrementally by evacuation alone and later by evacuation and heating at increasing temperatures for different periods of time. This was done in a separate vacuum vessel and the sample was then transferred to the pycnometer. Helium was allowed to flow into the sample for 60 h at 2 atm. After the flow was terminated, the pressure was reduced to 1 atm and recompressed to 2 atm for solid volume determinations. Mercury Porosimetry
Pore size distributions for Series
I
samples were determined using anAminco porosimeter (407 MPa). The samples were conditioned at 11% R.H. prior
to testing.
Differential Thermal Analysis
Differential thermograms were obtained using the 990 Dupont thermal
analysis system. Twenty mg of the material were used for each run. The rate of heating was 20°C/min (T = 150 s/in.) and the sensitivity was AT =
5 mcal/s/in.
Results Helium Flow as a Function of Time
Helium inflow versus time curves for Series I samples (soln/solid
ratio = 0.72) are presented in Fig. 1 (weight loss up to 9.93%). The results
for the soln/solid ratio = 1.07 are qualitatively similar and are not
presented. The curves in Fig. 1 are of three types and are numbered for
reference in the text. The curve for the sample-at 11% R.H. and the subsequent 3 curves up to a weight loss of 2.6% show a very rapid helium flow for approxi- mately the first hour. After approximately 10 h, the flow rate is negligible and one can assume that helium is no longer flowing into the sample. This is
the first type of curve designated Type
I.
At 3% weight loss, there is evenmore rapid flow during the first hour, the flow continues throughout subsequent hours and equilibrium is not attained even after 60 h. This type of curve is
designated Type 11. Curves numbered 5 , 6, 8, 9, 10, 12, 13, 14, 16, 17 and 18
5 88
J.
J.
Beaudoin,
R.F. Feldman
Vol. 7, No.
5
c u r v e s a f t e r 4 h w i t h a p p r e c i a b l e flow c o n t i n u i n g even a f t e r 60 h . T h i s c u r v e i s d e s i g n a t e d Type I11 a s a r e c u r v e s 11, 1 5 , 19, 20, 21, 22, 23, 24, 25 and 26.
Some s p e c i f i c f e a t u r e s of t h e helium flow v e r s u s time c u r v e s a r e of i n t e r e s t . A t 4.39% weight l o s s , Type I 1 flow o c c u r s ; however, t h e t o t a l flow d u r i n g t h e f i r s t hour i s much l a r g e r t h a n any o f t h e p r e c e d i n g Type I 1 c u r v e s . A t 4.53% weight l o s s , t h e t o t a l flow i s a g a i n g r e a t l y reduced b u t t h e flow curve remains Type 1 1 . A t 4.87% weight l o s s , Type I11 flow o c c u r s and e q u i l i b - rium i s n o t achieved even a f t e r 60 h . The n e x t t h r e e c u r v e s up t o weight l o s s 5.57% a r e Type I 1 and t h e flow (curve 14) i s f u r t h e r reduced. The n e x t c u r v e a t 5.96% weight l o s s (Type 111) h a s g r e a t l y reduced flow ( j u s t s l i g h t l y g r e a t e r t h a n t h e flow f o r t h e f i r s t two c u r v e s ) b u t t h e curve c u t s a c r o s s t h e f i r s t two c u r v e s a f t e r 27 h and u n l i k e Type I , t h e r e remains low b u t d i s c e r n i b l e flow a f t e r 60 h . There i s a l s o a d e c r e a s e i n flow r a t e w i t h r e s p e c t t o Type 1 c u r v e s i n t h e f i r s t hour. The f o u r c u r v e s s t a r t i n g a t weight l o s s 8.05% a r e Type I11 and e q u i l i b r i u m i s n o t reached a f t e r 60 h . A t weight l o s s = 9.52%, t h e flow i s a g a i n g r e a t l y reduced and i s Type 111. The f i n a l two c u r v e s , a t 9 . 8 3 and 9.93% weight l o s s , r e s p e c t i v e l y , show t h e l a r g e s t flow r a t e a t any time and a r e a l s o Type 111. The flow c u r v e s f o r S e r i e s I , s o l n / s o l i d = 1 . 0 7 , a r e q u a l i t a t i v e l y s i m i l a r t o t h o s e f o r s o l n / s o l i d = 0.72 and a r e n o t p r e s e n t e d . The flow c u r v e s f o r S e r i e s I 1 samples a r e p r e s e n t e d i n Fig. 2, and a l t h o u g h t h e r e a r e q u a l i t a t i v e S E R I E S I s i m i l a r i t i e s t o t h o s e c u r v e s f o r S e r i e s I samples, Type I c u r v e s
1 . 0 were n o t observed. Crossover o f
c u r v e s throughout t h e t e s t sequence was minimal f o r S e r i e s I 1 samples.
TIME, h FIG. 1 Helium i n f l o w v e r s u s time f o r o x y s u l f a t e cement p a s t e S e r i e s I , s o l n / s o l i d = 0.72 ( s e e Table I f o r weight change d a t a ) . The c h a r a c t e r o f t h e helium flow v e r s u s time c u r v e was observed t o be i n f l u e n c e d by d i s s o c i a t i o n of h y d r a t e s and w a t e r removal a s a r e s u l t of t e m p e r a t u r e i n c r e a s e s and pumping. The sequence of t h e s e o p e r a t i o n s i s given i n Table I w i t h t h e weight changes f o r each of t h e c u r v e s o f Fig. 1.
E f f e c t o f Weieht Loss and Temperature on t h e Volume of Helium Flow To i l l u s t r a t e how t h e helium flow v a r i e s w i t h m o i s t u r e c o n t e n t , t h e volume t h a t flowed i n t o t h e sample a t 48 h was p l o t t e d a s a f u n c t i o n of m o i s t u r e removed from t h e 11% R . H . c o n d i t i o n f o r S e r i e s I samples and from t h e 32% R . H .
c o n d i t i o n f o r S e r i e s I 1 samples. The p l o t s f o r s o l n / s o l i d = 0.72 a r e shown i n F i g . 3 . The numerical s u b s c r i p t s f o r t h e p l o t p o i n t s correspond t o t h e c u r v e s numbered i n F i g s . 1 and 2 and Table I . For S e r i e s I samples, t h e r e i s an i n c r e a s e i n flow from 1.60 cc/100 g a t 11% R.H. up t o 4 . 9 cc/100 g a t approximately 4% weight l o s s , where
V o l .
7, No.
5
589
HELIUM FLOW, MAGNESIUM OXYSULFATE CEMENT
t h e r e i s a small d e c r e a s e i n flow followed by a l a r g e i n c r e a s e t o 6 . 1 c c / 100 g a t 4.39% weight l o s s . The n e x t s i x p o i n t s up t o weight l o s s o f 5.96% i n d i c a t e a r e d u c t i o n i n flow t o approximately 2.5 cc/100 g ; t h e addi- t i o n a l weight l o s s i s achieved by pum- p i n g and h e a t i n g from 50°C t o 100°C. F u r t h e r h e a t i n g t o 150°C r e s u l t s i n a l a r g e i n c r e a s e i n flow t o 5.80 c c / 100 g a t 8.05% weight l o s s . I t i s noteworthy t h a t DTA r e s u l t s (Fig. 4) show two low- temperature endo- t h e r m i c peaks a t approximately 100°C and 150°C correspon- d i n g t o t h e l o s s o f f o u r and t h r e e mole- c u l e s o f w a t e r , r e s p e c t i v e l y , from 3 Mg (OH) 2 . MgS04. 8H20 ( 3 ) . TIME, h FIG. 2 Helium i n f l o w v e r s u s time f o r o x y s u l f a t e cement p a s t e S e r i e s 11, s o l n / s o l i d = 0.72 A d d i t i o n a l pumping and h e a t i n g t o 200°C r e s u l t e d i n a l a r g e d e c r e a s e i n flow t o 2.6 cc/100 g a t a weight l o s s o f 9.51%. F u r t h e r h e a t i n g a t 200°C r e s u l t e d i n extremely l a r g e i n c r e a s e s i n flow, t h e l a t t e r being g r e a t e r t h a n 8.5 cc/100 g a t a weight l o s s o f 9.93%. R e s u l t s f o r S e r i e s I , s o l n / s o l i d = 1.07, a r e q u a l i t a t i v e l y s i m i l a r and a r e n o t p r e s e n t e d .
For S e r i e s I 1 samples, t h e helium flow v e r s u s weight l o s s curve i s p l o t t e d w i t h v a l u e s o b t a i n e d by removal of w a t e r from t h e sample i n e q u i l i b r i u m w i t h 32% R . H . , which i n c l u d e s t h e removal of adsorbed w a t e r i n e x c e s s o f a mono-
\ l a y e r a s w e l l a s s t r u c t u r a l w a t e r . I t i s n o t e d t h a t t h e changes i n helium flow
w i t h weight l o s s observed f o r t h e curve f o r S e r i e s I 1 samples f o l l o w a s i m i l a r p a t t e r n t o t h o s e observed f o r S e r i e s I samples, b u t t h e magnitude of flow i s
much l e s s f o r S e r i e s I 1 samples up t o 9% weight lbss. T h i s may n o t be r e a d i l y a p p a r e n t a s t h e peaks f o r S e r i e s I 1 samples a r e s l i g h t l y d i s p l a c e d along t h e weight change a x i s ; d r y i n g from 32% R.H. may p a r t i a l l y e x p l a i n t h i s . I t i s n o t expected t h a t t h e removal o f t h e e x t r a sorbed w a t e r due t o 32% R.H. condition- i n g would r e s u l t i n s i m i l a r behaviour f o r b o t h S e r i e s I and S e r i e s I 1 samples because t h e y a r e two d i s t i n c t l y d i f f e r e n t p r e p a r a t i o n s ; S e r i e s I1 was p r e p a r e d w i t h a s a t u r a t e d s a l t s o l u t i o n and S e r i e s I was made w i t h p a r t i a l l y s a t u r a t e d s a l t s o l u t i o n .
Vol. 7, No.
5
J. J. Beaudoin,
R.
F. Feldman
FIG. 3 Helium i n f l o w a t 48 h v e r s u s weight l o s s f o r o x y s u l f a t e cement p a s t e There a r e s e v e r a l f l u c t u a t i o n s of i n c r e a s i n g and d e c r e a s i n g flow f o r S e r i e s I 1 samples a s f o r S e r i e s I samples b u t d i f f e r e n c e s between maxima and minima a r e l e s s . Heatingt o 200°C, however, y i e l d s an 11.59%
weight l o s s and r e s u l t s i n an extremely l a r g e i n c r e a s e i n flow
( s i m i l a r t o t h a t observed w i t h S e r i e s I samples).
T o t a l Space Vacated by Water Versus Degree o f Drying
I n t h e helium pycnometric t e c h n i q u e , one measures a " s o l i d volume" o f t h e sample by u s i n g t h e i n s t a n t a n e o u s v a l u e o b t a i n e d by
compressing t h e gas t o 2 atm i n t h e
sample c y l i n d e r . No helium flow i s
t a k e n i n t o account. One may t h e n
p l o t a c u r v e of change i n " s o l i d volume" (AV) w i t h weight l o s s a s
shown i n F i g . 5 . (This weight l o s s
i s due t o t h e w a t e r removed i n i n c r e m e n t a l d r y i n g from t h e s t a r - t i n g c o n d i t i o n
-
11% R . H . f o r S e r i e s I and 32% R . H . f o r S e r i e s 11.) In F i g . 3 , " t o t a l inflow" a t 48 h h a s been p l o t t e d a g a i n s t weight l o s s . The term " t o t a l inflow" r e f e r s t o t h e time-dependent helium flow i n t o t h e micro-s p a c e s . Removal o f m o i s t u r e
I
r e s u l t s i n a n e g a t i v e change
-
i n " s o l i d volume" and a_ - _ - - -
A-
/ change i n helium flow (AD).
1 The a l g e b r a i c sum o f t h e s e
f two, AV-AD, can be r e g a r d e d
1 a s t h e space v a c a t e d by water, I I i f it i s assumed t h a t l i t t l e helium e n t e r e d t h e small \ 1 \ J s p a c e s v a c a t e d by water d u r i n g
compression and measurement of d e n s i t y , and i f t h e flow c u r v e s i n d i c a t e e q u i l i b r i u m I h a s been o b t a i n e d . I t i s a l s o assumed t h a t t h e helium I I I I b I I I I does n o t i n t e r a c t w i t h t h e I 50 1 0 0 1 5 0 Z O O 2 5 0 300 350 4 0 0 4511 XI s i a s u r f a c e o r o t h e r body f o r c e s T E M P E R A T U R E m~ and i s a t 2 atm w i t h i n a l l t h e s m a l l s p a c e s t h a t w a t e r h a s v a c a t e d ; t h i s f o l l o w s
FIG. 4 from t h e o t h e r assumptions.
D i f f e r e n t i a l thermogram f o r I n F i g . 6 , AV-AD i s
V o l . 7, N o . 5
H E L I U M FLOW, MAGNESIUM OXYSULFATE CEMENT
TABLE I (AW) f o r S e r i e s I samples ( s o l n /
weight c h a n g e due to Removal of Water s o l i d = 0.72, 1.07) and S e r i e s 11 from Magnesium Oxysulfate Cement Paste samples ( s o l n / s o l i d
= 0 . 7 2 ) . For
Curve N O . series I, S o l n I S o l i d = 0.72 S e r i e s I p a s t e s , t h e p a r a m e t e r ,
(Fig. 1) Welght Change, % T r r r r m e n r AV-AD, a p p e a r s l i n e a r up t o about
I 15% weight l o s s . The p l o t p o i n t s
2 1.54 1 h pumpplng f o r s o l n / s o l i d = 0.72, w i t h
3 2.17 I h pumping
4 2.61 1 h pumping numerical s u b s c r i p t s 7 , 9 and
5 3.02 1 h B SODC 19-26, have v a l u e s of AV-AD which
6 3.80 1 h @ 50-c f a l l below t h e l i n e d e s c r i b e d by
4.00 I h pumping most of t h e d a t a and a c t u a l l y
8 4.22 1 h purnplng
9 4 . 3 9 I h pumplng form a s e p a r a t e l i n e having a
10 4 5 3 I h punplng v e r y s t e e p s l o p e . The p l o t
1 1 4 - 8 7 I h B 50°C p o i n t s f o r s o l n / s o l i d = 1.07
1 2 5 13 2 h n 50-c having numerical s u b s c r i p t s 15-21
13 5.32 I h d 75°C
14 5.57 I h B 75°C a t weight l o s s e s l a r g e r t h a n 15%
IS 5.96 I h pumping @ 1 0 0 ~ ~ a l s o f a l l below t h e l i n e and l i e 1 6 6 . 5 1 I h pumping B I O O - C along y e t a n o t h e r l i n e having a 17 6.73 1 h pumping b IOO-C v e r y s t e e p s l o p e . The r e a s o n f o r
18 7 7 4 I h pumping Id 150°C
19 8 0 5
,
@ L S O D C t h i s w i l l be d i s c u s s e d l a t e r .2 0 9 3 1 2 h pumping "75'C
2 1 9.35 I h pumping @ 175°C For S e r i e s I 1 p a s t e s t h e r e 2 2 9.49 I h punping @ 17SDC i s a l i n e a r r e l a t i o n s h i p between
2 3 9 5 2 I h Pump,ng @ 2 0 0 ' ~ AV-AD and weight change (AW) . u p
24 9 . 5 1 I h p u m p i n g B 2 0 0 ' ~ t o a weight l o s s of approximately
I 25 9.83 1 h pumping @ 200CC
2 6 9 . 9 3 I h pumping b 200-c 8 . 5 % where t h e r e i s a change i n
s l o p e . The r e l a t i o n s h i p between
AV-AD and weight change a t h i g h e r v a l u e s of weight l o s s i s a l s o l i n e a r b u t h a s a s t e e p e r s l o p e s i m i l a r t o t h a t observed f o r S e r i e s I samples. The
AV-AD l i n e s f o r S e r i e s I 1 samples a r e d i s p l a c e d t o t h e r i g h t of t h e l i n e f o r S e r i e s I samples. A l i n e a r r e g r e s s i o n a n a l y s i s was a p p l i e d t o t h e AV-AD v e r s u s AW d a t a f o r -I
-
S e r i e s I and I 1 samples w i t h t h e e x c l u - a. D 0 s i o n o f t h e p l o t p o i n t s w i t h s u b s c r i p t s z .n - - mentioned p r e v i o u s l y . The s t r a i g h t l i n e f o r S e r i e s I samples i s > a - I -I
AV-AD = -1.401 (20.261)-0.827 (+0.049)AW, CO<AW<l51 S O L N , S O L I O D R Y I N G \a (1) S E R I E S I 1 1 % 0 % R H 1 1 - The 90% confidence l i m i t s f o r i n t e r c e p t S E R I E S II.
0 7 2 3 2 % 0 % RH and s l o p e a r e given i n b r a c k e t s . I f a l lt h e assumptions a r e c o r r e c t and helium f i l l e d a l l t h e s p a c e t h a t t h e w a t e r 17 L v a c a t e d , t h e i n v e r s e of t h e s l o p e g i v e s t h e d e n s i t y of t h e w a t e r removed. T h i s 0 2 4 6 8 1 0 1 2 14 1fi 18 v a l u e comes t o 1.209 +0.07 f o r S e r i e s I W E I G H T L O S S % samples a s d e s c r i b e d by E q . ( I ) , and FIG. 5 a p p e a r s t o s u p p o r t t h e assumptions; r e s u l t s of d e n s i t y f o r some a d s o r b a t e s
Change i n s o l i d volume v e r s u s weight up t o 30% above t h e i r bulk v a l u e s a r e l o s s f o r o x y s u l f a t e cement p a s t e r e c o r d e d i n t h e l i t e r a t u r e ( 8 ) .
Vol.
7, No. 5J. J. Beaudoin, R. F. Feldman
However, the line for Series I, soln/solid = 0.72, drawn through plot
points 18-26 and the line for soln/solid = 1.07 through plot points 16-21
appear not to result from the formation of space created by removal of water because the steep slope of these lines results in a density for water which is far too low.
The two lines for Series I1 samples are as follows:
AV-AD = -0.156 (20.487)-0.432 (+0.084) A w , (O<~W<8.51 (2)
and
AV-AD = 11.436 (21.72)-1.75 (20.159) AW, (8.5<~W<12.51 (3)
The inverse slope of the line given by Eq. (2) is 2.310, which is too high to be accounted for by the removal of water from the microspaces alone. The
inverse slope of the line given by Eq.
( 5 )
is 0.571, which is too low to beaccounted for by the removal of water from the microspaces alone.
The curves for AV versus AW as presented in Fig. 5 indicate a change in AV with respect to AW, which is much larger for Series I than for Series I1 samples.
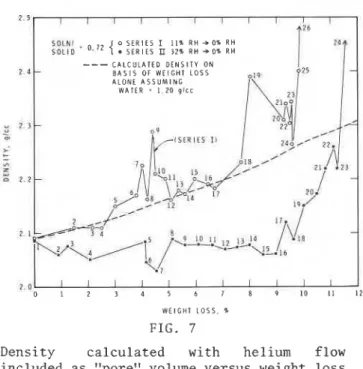
Density by Helium Comparison Pycnometer
Density calculations were made with the helium flow volume included as
pore volume, and the results were plotted versus weight loss (Fig. 7). The
density versus weight loss curve is
I I I I I I I I
17\;41
I ' I I ' - weight loss curve (Fig. similar in shape to the helium flow versus 3). In general, the6
'.\
!.,
density (Series I samples) increases from
-2",, '\
O:
,
-5 \ about 2.09 g/cc to 2.23 g/cc at 4% weightL 2,?,04 8 . : .
, lPR.12
-
loss and after a decrease to 2.16 g/cc at
- 4
-
,:\
'.
I 3-
4.25% weight loss increases to 2.29 at 4.4%'* 3
.I6
-
b!pI$.,~,
\-
weight loss. There follows a generalitlB,fK 11+* decrease to approximately 2.16 g/cc at 5.1%
- 6 -
d;':5.'$, \in,,
-
weight loss and subsequently a general
..
c \ \ - increase to 2.39 g/cc at 8.05% weight loss.4
A;&m
0 - E L Inn ::b - The density decreases to 2.26 g/cc at 9.6%
0
4 1 \
-
-
I \ weight loss and increases to greater thanU
,
<I:\~)U , 0 2 4 I \ \
' \
-
2.60 g/cc at approximately 10% weight loss.
- 1 0 - lZ22 +Q
d 6 2 , - Density was also calculated on the basis of
a - . 1 9 : 8 , - weight loss alone (assuming a water density
qA\f::
I a n of 1.20 g/cc) and plotted in Fig. 7.
- 1 2 - I
I l:IL,, -
I '1;2:h - In general, the solid densities of
-
; .24 +I:' Series
I
samples determined from the helium-14 - \
I
\,;
flow results are similar to those calculatedI
- 0 2 6
- from weight loss alone. However, densities
- 1 6 - O R Y I N G
\-
determined by helium periodically deviateI 0 , , 2 RH
\
from the calculated curve at several weight-
o 1 . 0 7 losses, i.e., densities by helium give higher
-18 - S E R I E S ZI
-
0 . 7 2 32%-0% R H,,;
values. This can be attributed to trapped-
: : : : I : : \ : ,I )>~44~7 (empty) space (due to irregular collapse ofI I I I I r I I I I I I I I I I 1 , structure) becoming accessible to helium, or
0 2 4 6 8 10 12 1 4 16 18 discrete empty spaces opening up and suddenly
becoming accessible to helium. The densities W E I G H T L O S S , %
by helium for Series I1 samples all lie below
FIG.
6 the calculated line (based on weight lossonly). This can be attributed to the Parameter AV-AD versus weight inability of helium to penetrate spaces on loss for oxysulfate cement paste removal of water from this system.
V o l . 7 , N o . 5 593 H E L I U M FLOW, MAGNESIUM OXYSULFATE CEMENT
2 I 1 1 1 1 1 1 1 1 1 1 1 In general the densities
I O L N l , 0, l 2 { o S E R I E S I 11% R H - 0 % R H for Series I 1 samples are
S O L I D S E R I E S U 32% R H - 0 % R H
---
C A L C U L A T E D D E N S I T Y O N lower than Series I samples at2 4 B A S I S O F W E I G H T L O S S the same weight loss. After
A L O N E A S S U M I N G
W A T E R . I 20 g ~ ~ c small fluctuations to a low
-
evalue of approximately 2.03
u 2 3 g/cc at 4.5% weight loss,
1 S t R l f l I I there is a general increase up
z-
-
-
", Z to 2.55 g/cc at 11.6% weight loss. z 2 P Mercury Porosimetry Mercury porosimetry results (intrusion pressure 407 MPa) for Series I samples conditioned at 11% R.H. gaveI I I I I values for total porosity
2 0
i
I
1
7 s P L O I I 12 which exceeded those deter-W E I G H T L O S S 5 mined by helium pycnometry at
FIG. 7 11% R.H. This was surprising
because for most other sys- Density calculated with helium flow tems, such as porous glass, included as "pore" volume versus weight loss the porosity measured by
helium is equal to or greater
1 than that measured by mercury.
It was thought that this discrepancy might be due to the penetration of mercury into those spaces which became accessible to helium only after heating to 200°C
(see plot points 24-26 (Series I) Fig. 3). The contribution to total porosity that these spaces provide is calculated from flow curves (A(AD) /VT) obtained at weight changes subsequent to heating to 200°C. Results are presented in
Table 11.
TABLE I1
Comparison of Hg Porosity and the Porosity of Oxysulfate Cement
~
A (AD) [Fig. 61
,
He + A (AD)Soln/Solid He Porosity,
v~
v~
Hg Porosity,Porosity, %
% % %
The data in Table I1 indicate that most of the space which mercury enters can be accounted for by the sum of the instantaneous helium porosity and the space which becomes accessible to helium after heating to 200°C. For
Series I samples, it is apparent that continued heating at 200°C opens up spaces that become accessible to helium.
Discussion
It has been observed that helium enters the pores of porous Vycor glass instantaneously and that no time-dependent flow takes place. The pores con- tained in Vycor glass have an average pore radius of approximately 301 and hence it is likely that helium, observed in the present experimenss, flowed
i
into space with openings having least dimension much less than 30A.594
J. J. Beaudoin, R. F. Feldman Vol. 7, No.
5
As referred to earlier, the helium molecule can give indications of what changes are occurring in a solid matrix during change in its chemical nature
(e.g., decomposition) or during change in its physical nature (e.g., collapse of structure). The reason is that the helium molecule is very small and inert. If holes are created into which helium can enter, this will be indicated; if regions are formed from which helium is excluded, this should also be indicated. Values of density can be computed with some knowledge of what these values mean.
The following mechanisms are suggested to be operative during exposure of the magnesium oxysulphate to helium, and it is felt that they explain the changing character of the time-dependent helium flow and thus the changes to the solid as water is withdrawn:
(1) Space containing bulk or adsorbed water empties completely and fills with he 1 ium.
(2) Space formed by decomposition of magnesium oxysulfate complexes fills with helium.
( 3 ) New unfilled (with water) spaces open and fill with helium.
(4) Previously water-filled space is incompletely filled with helium, possibly
because of structural collapse (which may involve a change in dimension of pore entrances).
Mechanisms (1) and (2) seem to be applicable to the data described by the
regression line for Series
I
samples having an inverse slope = 1.209. Thisvalue represents the density of the water removed and is in line with measure- ments made on expanding and non-expanding clays for water contents of less than one monolayer (9).
Mechanism (3) can account for large increases in flow and solid density
with small changes in weight, e.g., large increases in flow (Fig. 1, curves 9,
19-26, soln/solid = 0.72) and density when the system is heated to 200°C. This
can also account for unrealistically low values for density of water obtained from a plot of AV-AD versus AW.
Mechanism (4) can account for unrealistically high values for water density obtained from a plot of AV-AD versus AW. It is also possible that some previously accessible (to helium) microspace may simultaneously become inaccessible as diffusion paths may disappear with structural collapse. It is apparent that a microporous material, which contains microspace with entrances having least dimension sufficiently small so as to regulate the inflow of helium, will present difficulty in the measurement of its solid density. The
inability of a fluid to enter the microspaces in this system would necessarily result in a value for solid density that is too low. The ability of helium to enter microspaces vacated by water enables determination of solid density that includes structural water remaining in the microspaces.
Increasing temperature probably affects the kinetics of structural col- lapse associated with decreased flow and removal of bulk, adsorbed and struc- tural water. The two low-temperature DTA peaks reach a maximum at approxi- mately 100°C and 150°C. However, the peaks are broad and there is gradual dehydration of the oxysulfate complexes and MgS04. 7H20 up to 300°C. The micro- spaces which are formed by the decomposition of these hydrates appear to be accessible to helium because the density value for water 1.209 g/cc obtained from the plot of AV-AD versus AW is within limits that would be expected for this type of water. For Series I samples, increased flow to 4.5% weight loss followed by decreased flow to 6% weight loss results from pumping and heating in stages up to approximately 100°C.
V o l . 7, No. 5 595 HELIUM FLOW, MAGNESIUM OXYSULFATE CEMENT
The second cycle of increased and decreased flow up to a weight loss of 9.5% involves pumping and heating in stages from l00'C to 175'~. It seems likely that this cyclic behaviour is related to the gradual decomposition of the oxysulfate complexes.
Mercury intrusion experiments in this study give somewhat anomalous results; calculations, where one assumes a structurally stable matrix (to pressure) and the validity of the Kelvin equation, predict the filling of relatively large pores at 407 MPa ( ~ 3 0 A depending on the contact angle). It seems likely that the above assumptions do not hold for this system and that structural damage or alteration occurs to the matrix such that mercury penet- rates into space that was not immediately accessible to helium. Internal isolated space may be opened up by differential pressure. In this case,
calculations from the data based on conventional assumptions may not be valid but the results (total porosity) (Table 11) support the above conclusion.
Conclusions
The helium-flow technique can follow physical changes in the microstruc- ture of magnesium oxysulfate cement paste, which are due to chemical decom- position and water removal, and establish the physical nature of the structure formed
.
I 1. There are discrete, unfilled (with water) microspaces that are not
initially accessible to helium. Removal of moisture and application of increased temperature opens up diffusion paths to these microspaces
1 allowing the inflow of helium.
2. The density of the water removed during drying from 11% R.H. was determined to be 1.209 k0.07 g/cc, which is in accord with results for adsorbed water reported in the literature.
3. When water is removed from this system (Series I), structural collapse occurs, i.e., as a result of solid volume changes due to drying, the microspace is reduced as solid surfaces come closer together.
4. Hg (at 407 MPa) can intrude into those microspaces not initially accessible to helium; this is probably the result of some structural damage or
alteration to the system resulting from large differential pressures that open up internal, isolated microspace.
Acknowledeement
The authors wish to thank J. Wood for his fine work in performing the experiments. This paper is a contribution from the Division of Building Research, National Research Council of Canada, and is published with the approval of the Director of the Division.
References 1. S. Sorel, Compt. Rend. 65, 102 (1867).
2. T. Demediuk and W. Cole, Aust. J. Chem. 10, 287, (1957).
-
3. E.S. Newman, J. Res., Nat. Bur. Stand. A, 68A, 645, (1964).I 4. J.J. Beaudoin and V.S. Ramachandran, Cem. Concr. Res., in press.
5. R.F. Feldman, Cem. Concr. Res.,
4,
1 (1973). 6. R.F. Feldman, Cem. Concr. Res.1,
285 (1971). 7. R.F. Feldman, Cem. Concr. Res., 2, 123 (1972).-
596 Vol. 7, No. 5
J. J. Beaudoin, R. F. Feldman
e
8. S. Brunauer, The Adsorption of Gases and Vapors, p.420. Princeton University Press, Princeton (1943).
9. R.T. Martin, Proc. Ninth Nat. Conf. Clays and Clay Minerals (Lafayette) 1960, 28 (1962).
b