Publisher’s version / Version de l'éditeur:
Applied Mathematical Modelling, 35, 11, pp. 5302-5313, 2011-04-15
READ THESE TERMS AND CONDITIONS CAREFULLY BEFORE USING THIS WEBSITE.
https://nrc-publications.canada.ca/eng/copyright
Vous avez des questions? Nous pouvons vous aider. Pour communiquer directement avec un auteur, consultez la première page de la revue dans laquelle son article a été publié afin de trouver ses coordonnées. Si vous n’arrivez pas à les repérer, communiquez avec nous à [email protected].
Questions? Contact the NRC Publications Archive team at
[email protected]. If you wish to email the authors directly, please see the first page of the publication for their contact information.
Archives des publications du CNRC
This publication could be one of several versions: author’s original, accepted manuscript or the publisher’s version. / La version de cette publication peut être l’une des suivantes : la version prépublication de l’auteur, la version acceptée du manuscrit ou la version de l’éditeur.
For the publisher’s version, please access the DOI link below./ Pour consulter la version de l’éditeur, utilisez le lien DOI ci-dessous.
https://doi.org/10.1016/j.apm.2011.04.025
Access and use of this website and the material on it are subject to the Terms and Conditions set forth at
Optimization on the Cold Drawing Process of 6063 Aluminium Tubes
Béland, J.-F.; Fafard, M.; Rahem, A.; D'Amours, G.; Côté, T.
https://publications-cnrc.canada.ca/fra/droits
L’accès à ce site Web et l’utilisation de son contenu sont assujettis aux conditions présentées dans le site LISEZ CES CONDITIONS ATTENTIVEMENT AVANT D’UTILISER CE SITE WEB.
NRC Publications Record / Notice d'Archives des publications de CNRC:
https://nrc-publications.canada.ca/eng/view/object/?id=85cad41a-460f-4a7b-babe-5803751e92fe https://publications-cnrc.canada.ca/fra/voir/objet/?id=85cad41a-460f-4a7b-babe-5803751e92fe
Optimization on the Cold Drawing Process of 6063 Aluminium Tubes
J.-F. Béland
*1, M. Fafard
2, A. Rahem
1, G. D’Amours
1, T. Côté
31
National Research Council Canada, Aluminium Technology Centre, Saguenay, Quebec, Canada 2 Aluminium Research Centre – REGAL, Laval University, Quebec, Canada
3
Alfiniti/Spectube Inc., Saguenay, Quebec, Canada
Abstract
To obtain the T832 material behaviour, 6063-T4 tubes need to be cold drawn before artificial aging to enhance their mechanical properties. Since a high area reduction is required, multiple drawing passes are generally necessary to avoid fracture of tubes during the drawing process. These several steps need a time consuming process which could be reduced by optimization. The optimization of the tools geometry has been done through a finite element model with the objective of reducing the maximum stress level to draw tubes in one pass. Based on the optimum design, a new tool was built and acceptable accordance was observed between experiments and numerical results.
Keywords : AA6063, Finite Element Method, Tube Drawing, Optimization
*
Corresponding author Tel. +1 418-545-5238; fax +1 418-545-5345; E-Mail address: [email protected]
Introduction
Tube extrusion process is one of the mostly used methods for producing aluminium tubes with circular section. The 6063 is the most common alloy used because it is easily extruded. However, the extrusion of the 6063 alloy produces low mechanical properties and limited tube thickness. Also, the extrusion process doesn’t produce good dimensional accuracy and surface finished. The drawing process, after extrusion, allows reducing the outside diameter and the wall thickness of extruded tubes in order to enhance their mechanical properties. This process gives tube closer dimensional accuracy and brighter surface finish than extrusion. To obtain the T832 material behaviour (identified in ASTM Standard B483M) from 6063-T4 tubes after artificial aging, it is necessary to reduce the cross section area of tubes about 50% (Bourget et al. 2009). Therefore the tubes are sufficiently work hardened. Up to date, several drawing passes were necessary to achieve this high reduction without multiple fractures of tubes. This study aims to optimize tool geometries using a finite element (FE) method which will enable performance of the tube drawing process only in one step.
Analysis of the tube drawing process by finite element method has been investigated previously by Sawamiphakdi et al. (1991). They developed a FE model to determine the proper initial tube size to obtain the appropriate mechanical properties after drawing of a given tube size without risks of fracture. In the same way, Karnezis & Farrugia (1998) used a workability criterion to determine the susceptibility of a tube to fail while drawing. They were able to verify if a two steps operation can be replaced by a single-pass without tube damage using the same tool geometry. Yoshida and Furuya (2004) studied cold drawing of shape-memory-alloy with hollow sinking, fixed plug drawing, floating plug drawing and mandrel drawing. They found an accurate process to draw successfully tubes with less fracture and better dimensional accuracy. Moon et al. (2005) used a FE model to verify analytical methods that optimized the intermediate tube dimensions for a two steps process to have evenly distributed strains for each pass. Palengat et al. (2007) compared results of a FE model with two hardening laws for hollow sinking and plug drawing with experiments and they found good agreement using a constant Coulomb friction coefficient. Kuboki et al. (2007) simulated the tube
drawing process to study effect of plug on having uniform residual stresses along the tube thickness.
Few studies have been performed to optimize the die entry angle for reducing drawing stresses. Neves et al. (2005) found an optimized half-angle range for tube drawing of A304 stainless steel for reducing drawing stresses with three different area reductions. Their result confirmed that effect of friction on the plug is more significant than on the die. Okui et al. (2005) simulated tube drawing process to optimize a double taper die geometry to reduce the bending phenomenon of steel tubes.
Recent publications on the tube drawing were concentrated on the production of variable thickness tubes. Bihamta et al. (2010) presented a paper for evaluating state of residual stress in the variable thickness tubes and effect of tube geometry selection on their successful production. Also, Guillot et al. (2010) presented an experimental approach for production of variable thickness tubes both in radial and axial directions.
The present study aims to reduce the drawing load by optimizing the die angle and the transient curvature between bearing zone and inclined zone of the die which has not been investigated well in the literature. The commercial Ls-Dyna software was used as a solver and developed codes in MATLAB and ANSYS (APDL language) as a pre-processing tool. In the first step, some experiments was performed and in the second step, the finite element model was compared with experimental results for the initial process which was done in two steps to verify the accuracy of the model and to find the good contact conditions. The third and fourth steps are the optimisation of the tools geometry and experimental verification of the new tool geometry.
Experiments
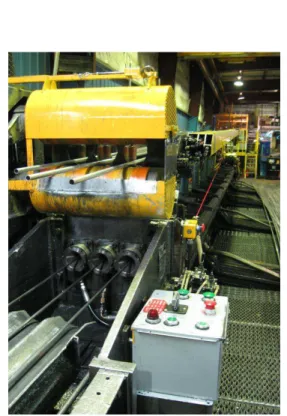
Tube drawings were performed using an hydraulic industrial bench with 6063-T4 extruded tubes. The drawing bench was a Lombard (Fig. 1) with 190kN capacity and can draw three tubes at the same time up to maximum length of 12 m. For the experiments, extruded tubes of 29.54 mm as mean outside diameter and 1.24 mm as mean wall thickness were used. These tubes, used to produce snowshoes, are drawn in two steps. Mechanical properties of the extruded original tubes are presented in table 1.
Table 1: Mechanical properties of extruded original tubes
Yield strength MPa Ultimate strength MPa Elongation* % Mean 76.5 171.4 22.3 Std. dev. 2.3 5.1 0.6
*50 mm initial gage length
Figure 1: Lombard tube drawing bench
The two steps drawing process was used as a first experiment to calibrate the FE model. Because tools drawings were not available for those dies, their geometry for the two drawing passes was measured with a CMM. The geometry of the tools for the first step is illustrated schematically in the
figure 2. As shown, there is two dies; the first one is the sinker die where most of the deformations in the hoop direction happen and the second one is the drawing die where most of the radial deformations take place. This setup is actually used in the industry and by experience allows larger reduction, straighter tubes and better surface finish. The behaviour of the tools while drawing was supposed elastic. The Young modulus and the Poisson ratio are assumed to be common steel properties, E=207 MPa and ν=0.3 respectively. The dimensions of the tools and tubes for each step are listed in table 2.
Figure 2: Tooling for the two steps drawing process
Table 2: Dimensions of tools and tube for each of the two steps
Step Ds (mm) Dm (mm) dm (mm) tf (mm) % % cumulated 1 23.57 22.58 20.47 1.07 36 2 20.27 19.05 17.12 0.97 23 50 Ds Sinker die diameter, Dm Drawing die diameter, dm Mandrel diameter
tf Wall thickness of drawn tube, % Area reduction
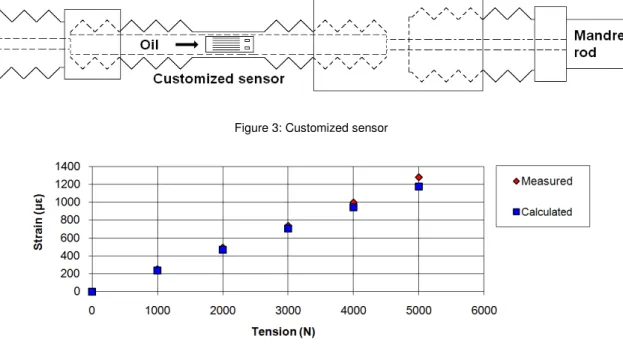
The drawing bench were equipped to measure the drawing load and the tension in the mandrel rod. Since the tube is pulled by hydraulic cylinder, the drawing force was measured with a pressure transmitter. The tension in the mandrel rod was measured with a customized sensor. As shown in
figure 3, a sample of the mandrel rod was machined to a precise dimension and a strain gauge was attached to it. The accuracy of the fabricated sensor was verified with a tensile test machine (Fig 4). Figures 16 to 19 in the appendix show the measured drawing forces.
Figure 3: Customized sensor
Figure 4: Comparison between measured and calculated response of the customized sensor
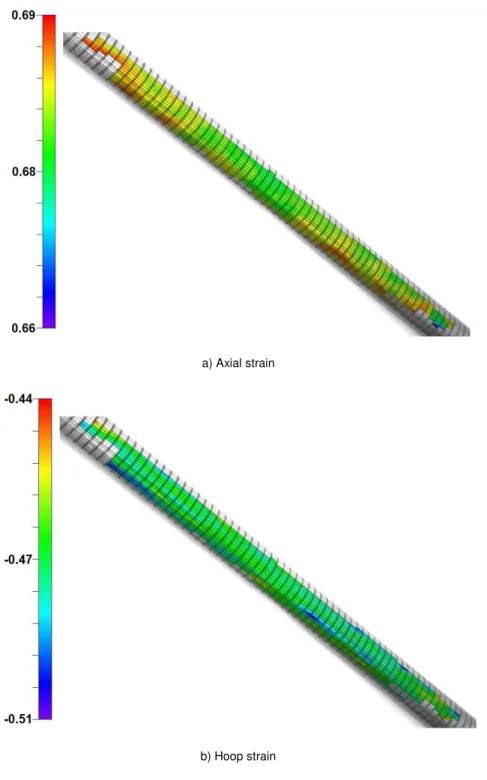
Deformations at the surface of the tubes after each step were measured via Autogrid, an automated strain measurement system equipped with four cameras. A pattern of 2 mm square grid was applied to the tubes before the first step. The axial and hoop strains for the two steps were then measured with the system. Figure 5 shows the surface strains for two steps drawn tubes and figure 6 shows the strains for each step.
a) Axial strain
b) Hoop strain
Figure 6: Axial and hoop strains for each of the two steps
Tensile tests have been done on the final drawn tubes according to ASTM Standard B557M (2002). The material properties are presented in the table 3.
Table 3: Mechanical properties of drawn tubes
Yield strength MPa Ultimate strength MPa Elongation % Mean 264.7 274.8 4.7 Std. dev. 1.8 1.3 0.3
Currently, the tube drawing process can’t be performed in one step because of tube breakage in the drawn section while processing (Figure 7 shows the typical shape of a fractured tube while drawing based on a FE analysis). This means that the forming criterion to be considered is the maximum axial stress, not the deformation level that the drawn tube can withstand because the tube can be drawn in two steps. Then to perform tube drawing in one step, the axial stress should be below 265 MPa or in other words, the drawing load must be lower than 14.5kN to avoid fracture or wrong tube dimensions. It has been verified, with a lower area reduction and the current geometry of the tooling, that the material properties for one step or two steps are very similar. Tubes with the same material and heat treatment conditions were used to have a good agreement. The dimensions of the tools and tubes for the one pass and two passes processes are given in table 4.
Fi
Table 4: Comparison of mechanical
Step Ds (mm) Dm (mm) One-pass 20.27 18.31 1 step out of 2 21.41 20.27 2 step out of 2 19.46 18.31 Ds Sinker die d
Figure 7: Fracture of the tube while processing
al properties between tubes from one step and two steps process fo reduction dm (mm) tf (mm) % % cumulated Yield strength MPa 15.62 1.35 46 46 222.1 16.81 1.73 24 24 - 15.62 1.35 29 46 226.7
e diameter, Dm Drawing die diameter, dm Mandrel diameter
tf Wall of drawn tube, % Area reduction
for a lower area
h Ultimate strength MPa 223.1 - 228.0
FE model
Geometry of the dies and the loading conditions are considered axisymmetric. Therefore the variation of the stresses along the circumference of the tube is considered to be zero while drawing the tube. This hypothesis allows the use of an axisymmetric model as shown in figure 8. A slice of the tube is meshed with 4-node shell elements and the integration is performed using a 2 by 2 Gaussian quadrature. An elastic-plastic material is used in the FE software with an isotropic hardening law. The von Mises criterion was used for the flow stress and the material was considered strain rate independent.
Figure 8: Axisymmetric model
The stress-strain curve of the 6063-T4 tubes was determined from a tensile test. Since in a tensile test, the tube is loaded only in one direction and stress free in all other directions, the deformation range is not large enough to represent the real tube behaviour while drawing. Therefore, the stress-strain curve is extrapolated with the power law σ=Kεn (Lange K. et al., 1985) to be able to simulate the high deformations during the process. The appropriate fitted parameters were K=295 and n=0.215. The extrapolated stress-strain curve is illustrated in figure 9.
Figure 9: True stress-strain curve for 6063-T4 tubes
The Coulomb friction coefficient with a surface to surface contact was used to represent the contact properties. The friction coefficient is determined by comparing the loads obtained from the FE simulation and to the experimental ones. It is supposed the same between plug with tube and die with tube. The coefficient was found to be around 0.035. Figures 16 to 19 in the appendix compare the measured forces and the FE results where the time has been normalized to 1 second. The high mandrel force at the beginning of the process is due to its initial positioning. The Coulomb’s coefficient value of 0.035 was used for all the following numerical studies. Table 5 shows the surface strains for each step compared to the measured values.
Table 5: Numerical model and experiments surfaces strains for each step
First Step Second Step
Stains Experiments FE model Experiments FE model
Axial 0.454±0.009 0.452 0.680±0.006 0.683
Optimization of the tools geometry
In this study, three tools were used for fixed-plug drawing process: a sinker die, a drawing die and a cylindrical plug. The geometry of the sinker die and the drawing die were optimized by the following method: The geometry of the entry zone is considered to be conical which connects to the bearing zone with a fillet (Fig. 10). For both dies, the length of the bearing zone was fixed to 4 mm. The optimum conical angle and radius of the transient curvature will be determined by the FE method. The objective is to reduce the drawing load in a way that axial stress will be below the yield stress of drawn tube.
Figure 10: Geometry of a die for the optimization
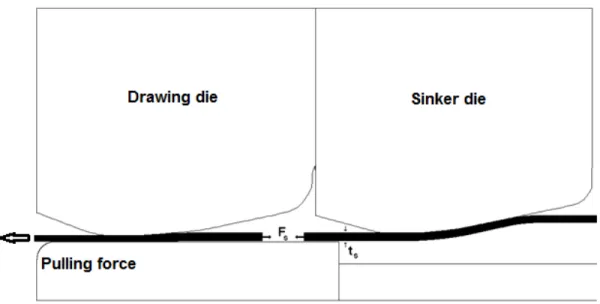
Since two dies (sinker and drawing dies) were used for the process, output of the first die is influencing the behaviour of the tube while drawing. Three parameters which could influence the drawing process, considered dependant of the sinker geometry are as follows: The tensile or sinking load in the tube between the two dies (Fs), the thickness of the tube after sinking (ts) and the
Pulling force
Figure 11: Tensile load and thickness of tube between the two dies
Some preliminary FE simulations have been performed and shown that the two most important parameters to pay attention were sinking load (tensile load in the tube between the two dies) and the thickness of the tube after sinking (Fig. 11). The variation of the plastic strains in function of the sinker geometry does not influence the force while the tube is drawn in the second die. The diameter of the sinker bearing zone was fixed to 20.5 mm. This value takes into account the variation of the thickness of the initial tube and the increase of thickness while sinking to ensure that the tube will not strike the mandrel prematurely.
In the first step, the sinking process is simulated with different tool geometries to find acceptable ranges of values for the thickness and the tensile load (table 6). A mean thickness and a mean tensile load of 1.380 mm and 8393 N respectively were obtained from the results in table 6. The geometry of the drawing die is then optimized using a tube with the results of a sinking analysis with approximately these mean values, whether the results of the sinker’s geometry with a half angle of 10° and a fillet radii of 50mm (see bold values in table 6). It was found that as the radius of curvature between conical zone and bearing zone increases, the drawing axial stresses increase too. It seems that a greater contact surface between tube and mandrel results in higher friction forces. The same phenomenon is observed with a small angle in the conical zone. It is in accordance with prior results published by Neves et al. (2005). A minimum radius of 4 times the
thickness of the initial tube (4X1.25 mm) was applied to reduce the contact pressure of this zone of the drawing die and consequently increasing its lifespan.
Table 6: Tensile load and thickness of tube for different sinker geometries
Die half angle 10° 11° 12° 13° 14° 15° 16° 18° Fillet radii Fs (N) ts (mm) Fs (N) ts (mm) Fs (N) ts (mm) Fs (N) ts (mm) Fs (N) ts (mm) Fs (N) ts (mm) Fs (N) ts (mm) Fs (N) ts (mm) R5 8647 1.373 8610 1.372 8591 1.371 8610 1.370 8639 1.369 8627 1.367 8660 1.366 8677 1.363 R25 8338 1.375 8278 1.375 8240 1.377 8215 1.378 8191 1.375 8153 1.376 8138 1.377 8163 1.378 R50 8350 1.382 8289 1.382 8277 1.384 8253 1.385 8244 1.385 8223 1.383 8200 1.384 8224 1.385 R75 8341 1.386 8371 1.386 8386 1.386 8380 1.386 8367 1.387 8373 1.386 8284 1.387 8407 1.385 R100 8563 1.387 8452 1.387 8517 1.386 8515 1.387 8497 1.387 8537 1.387 8376 1.386 8515 1.385
Figure 12 shows the drawing force in function of the half angle of the conical zone. The axial load is minimum for a half angle around 10°. The drawing force seems to be stabilized for higher half angles. It is because there is an increase of the arc length of the radius with the increase of the half angle. At a half angle higher than 11°, the tube will deform mostly in the arc of the radius and therefore the half angle will not have enough influence. This is validated with the equivalent plastic strain in the thickness of the drawn tube in function of the half angle as shown in figure 13. The plastic strain is stabilized at half angles higher than 12°.
Figure 13: Equivalent plastic strain through thickness in function of the die half angle
To optimize the geometry of the sinker, it is necessary to know the influence of the tensile load (Fs)
and the thickness (ts) of the tube after sinking on the pulling force. This is performed by using the
results of a simulation of the sinking process (sinker die half angle of 10° and fillet radii of 50 mm) and simulate the drawing process with the optimized drawing die geometry (draw die half angle of 10° and fillet radii of 5 mm) and applying different thickness and tensile load to the tube. The pulling force in function of the two parameters is plotted at figure 14. The results for different geometries of the sinker are also illustrated on the same figure. Each line corresponds to the results (tensile load and thickness after sinking) of the simulated sinking processes of table 6. The best geometry for the sinker die is a half angle of 16° with a blend radius of 25 mm, which corresponds to a pulling force of about 13.9 kN.
Figure 14: Pulling Force in function of the tensile load and thickness of tube after sinking for the optimized drawing die
The whole process (sinking and drawing) was simulated with the optimized geometry (sinker die half angle of 16° and fillet radii of 25 mm and drawing die half angle of 10° and fillet radii of 5 mm) to validate the reduction of the axial stress. The calculated pulling force was 13.96kN which is near the value approximated with figure 14. This pulling force gives an axial stress of 254.6 MPa which is smaller than the yield stress of the drawn tubes.
Test using new dies design
Two dies with their respective optimal geometry were fabricated. Because of a large period of time between the tests, extruded tubes of the same dimensions as the tubes used for this study were not available. Tubes with a different diameter and wall thickness but an average area reduction of 50% were then used. The drawing parameters are given in table 7. As we can see, the area reduction achieved in one step is higher than 50%. The surface finish was better than a tube drawn with two steps and the tube recovered enough ductility after heat treatment to be able to bend it.
Table 7: Dimensions of tools and tube for the one step tube drawing process
Step OD initial tubes (mm) ti (mm) Ds (mm) Dm (mm) dm (mm) tf (mm) Area reduction % One step 23.35 1.50 20.50 19.05 17.32 0.87 52
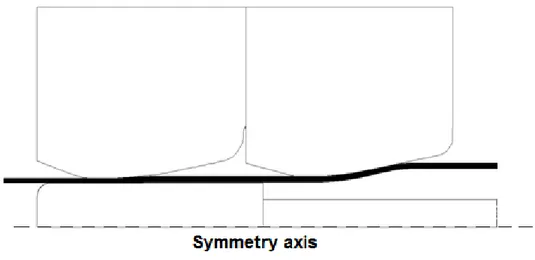
The optimized geometry was also tested on a different tube diameter and wall thickness. The drawing parameters used are given in table 8. The area reduction achieved for one pull is about 53%. The surface finish was not as good as two steps methodology but was bright enough to succeed the quality control standards. The shape of the tube while drawing is illustrated at figure 15.
Table 8: Dimensions of tools and tube for the one step tube drawing process for a different final product
Step OD initial tubes (mm) ti (mm) Ds (mm) Dm (mm) dm (mm) tf (mm) Area reduction % One step 31.95 1.85 27.66 25.25 23.06 1.09 53
Conclusion
In this study, a FE model for optimizing tube sinking following by tube drawing was developed. In the first step, the model was calibrated based on the measured reaction forces on the die and mandrel and deformation on tube surface. Then based on the calibrated and validated model, an optimization study was performed for having minimum axial stress in the drawn tube while drawing to reduce chance of fracture in the tubes. This study also ascertained that unlike the assumptions of considering amount of deformation as a limiting criterion, the axial stress in the drawn tube is a major limitation for drawing tubes. The minimization on the axial stress made it possible to reduce production cycle for a given tube from two steps to one step. The maximum area reduction achieved with the optimized tooling for one pull is 53%. By reducing the number of drawing steps, the production costs of the tube drawing process are cut more than a half because we reduce also the tube handling and tooling maintenance times and the electricity consumption.
Acknowledgement
The authors would like to thank the Fonds québécois de la recherche sur la nature et les technologies, Natural Sciences and Engineering Research Council of Canada, and the Alfiniti company for the scolarship attributed to the first author during his master studies at Laval University. Authors also thank the National Research Council of Canada – Aluminium Technology Centre for their experimental and technical support and the Aluminium Research Centre – REGAL for the partial funding of this project.
Appendix
Figure 16: Pulling force for the first step
Figure 18: Pulling force for the second step