READ THESE TERMS AND CONDITIONS CAREFULLY BEFORE USING THIS WEBSITE. https://nrc-publications.canada.ca/eng/copyright
Vous avez des questions? Nous pouvons vous aider. Pour communiquer directement avec un auteur, consultez la première page de la revue dans laquelle son article a été publié afin de trouver ses coordonnées. Si vous n’arrivez pas à les repérer, communiquez avec nous à PublicationsArchive-ArchivesPublications@nrc-cnrc.gc.ca.
Questions? Contact the NRC Publications Archive team at
PublicationsArchive-ArchivesPublications@nrc-cnrc.gc.ca. If you wish to email the authors directly, please see the first page of the publication for their contact information.
NRC Publications Archive
Archives des publications du CNRC
This publication could be one of several versions: author’s original, accepted manuscript or the publisher’s version. / La version de cette publication peut être l’une des suivantes : la version prépublication de l’auteur, la version acceptée du manuscrit ou la version de l’éditeur.
Access and use of this website and the material on it are subject to the Terms and Conditions set forth at
Remote monitoring of concrete repairs on a highway bridge
Cusson, D.; Hoogeveen, T. J.; Repette, W. L.; Qian, S. Y.; Berszakiewicz, B.;
Pianca, F.; Willoughby, R.; Mailvaganam, N. P.
https://publications-cnrc.canada.ca/fra/droits
L’accès à ce site Web et l’utilisation de son contenu sont assujettis aux conditions présentées dans le site LISEZ CES CONDITIONS ATTENTIVEMENT AVANT D’UTILISER CE SITE WEB.
NRC Publications Record / Notice d'Archives des publications de CNRC:
https://nrc-publications.canada.ca/eng/view/object/?id=199d2fa8-fa7e-475b-891d-34dcfef97df8 https://publications-cnrc.canada.ca/fra/voir/objet/?id=199d2fa8-fa7e-475b-891d-34dcfef97df8Remote Monitoring of Concrete Repairs
on a Highway Bridge
D. Cusson
1, T. Hoogeveen
1, W. Repette
1, S. Qian
1,
B. Berszakiewicz
2, F. Pianca
2, R. Willoughby
3, N. Mailvaganam
11
National Research Council Canada, Institute for Research in Construction, Ottawa, Canada
2
Ministry of Transportation of Ontario, Materials Engineering and Research Office, Downsview, Canada
3
National Research Council Canada, Industrial Research Assistance Program, Richmond Hill, Canada
Originally published in the proceedings of the 3
rdStructural Specialty Conference of the CSCE,
London, Canada, June 2000, pp. 336-343.
ABSTRACT: Years of de-icing salt use resulted in severe reinforcement corrosion of the barrier walls of a highway bridge near Renfrew, Ontario. A partnership was formed to study the deterioration mechanisms and to evaluate the long-term performance of different concrete patching systems under field conditions. This is being done by monitoring the repaired barrier walls of the bridge over a 4-year period with non-destructive corrosion surveys and automated remote monitoring. Various types of sensors were installed in the concrete patches and in the old concrete. They include relative humidity and temperature sensors, reference electrodes, electrical resistance probes, and strain gauges. An automated data acquisition system complete with solar collectors as power source and cellular modems for data transmission was installed on site. The paper presents an overview of the project, then focuses on the design of instrumentation and the selection of sensors for long-term, reliable field application. Interim data are presented.
RÉSUMÉ: Plusieurs années d’utilisation de sels de déglaçage ont résulté en la corrosion sévère de l’armature des parapets d’un pont d’autoroute près de Renfrew en Ontario. Un partenariat a été mis sur pied afin d’étudier les mécanismes de détérioration et d’évaluer le rendement à long terme in-situ de divers systèmes de réparation. Le rendement des parapets réparés est évalué sur une période de quatre ans en utilisant diverses techniques non destructives de détection de la corrosion. Aussi, des sondes ont été enfouies dans le béton des parapets afin de mesurer l’humidité relative, la température, le potentiel électrochimique, la résistance électrique et la déformation. Un système d’acquisition de données composé, entre autres, de panneaux solaires comme source d’énergie et d’un modem cellulaire pour la transmission des données a été installé sur le site. Cet article présente d’abord un aperçu du projet et discute, ensuite, de la conception et de la sélection des sondes pour une installation fiable et durable à long terme. Des données intérimaires sont présentées.
1. BACKGROUND
N
umerous lab studies have been conducted to determine the performance of concrete patching materials (Bradbury 1987, Emberson and May 1990). However, significant discrepancies between laboratory results and field performance of repairs to concrete highway structures are frequently observed (Gulis et al. 1998).Field performance is one of the important criteria for the selection of patching materials for repair
applications, but the lack of comprehensive data and suitable guidelines makes the selection process hazardous. Field trials, from which design methods, selection of repair materials, construction procedures and durability of repairs can be evaluated, are therefore of major importance.
The Institute for Research in Construction (IRC) and the Industrial Research Assistance Program (IRAP) of the National Research Council of Canada (NRC), and the Ministry of Transportation of Ontario (MTO) formed a partnership with 6 suppliers of concrete repair systems and the Regional Municipality of Peel
Institute for Research in Construction’s Paper NRCC 41037 Page 2 of 8
to evaluate the long-term performance of various concrete patching systems under field conditions. The field work, which started in Sept. 1999, consisted of repairing the barrier walls of a highway bridge using different concrete repair systems, and installing instrumentation in the repaired barrier walls for their monitoring over 3 years, with possible extension to 5 years, if needed.
The paper focuses on the design and selection of the instrumentation for the long-term monitoring of the performance of concrete repair systems. Preliminary data is also presented.
2. DESCRIPTION OF THE BRIDGE
The concrete structure selected for the study was a 2-lane, 3-span, 60 m long concrete deck bridge. The bridge, owned by the MTO, is located on Hwy 17, east of Renfrew, Ontario, and was built in 1975 (Figure 1).
Figure 1: View of the west half of the Renfrew bridge
Because of easy access during the repair and monitoring phases, and due to direct exposure to de-icing salts, the barrier walls were selected for the application of concrete patching systems and in-situ evaluation. The extent of concrete deterioration due to chloride contamination and resulting corrosion were representative of many highway structures exposed to typical environmental conditions in Ontario.
The barrier wall on each side of the deck consists of ten 6 m long sections separated by control joints. The barrier wall is 803 mm high, and has a thickness varying along the height from 250 to 450 mm. Its reinforcement consists of 20 mm, uncoated, black steel bars. The concrete cover of the reinforcement was measured to be approximately 40 mm.
3. REPAIR STRATEGY
Corrosion of the reinforcement was identified as the cause of concrete delamination. A first objective for this field trial was to obtain data on the performance of concrete patching systems for concrete bridges under field conditions, and to understand the factors affecting them. A second objective was to improve current concrete patching techniques in order to extend the life of rehabilitated bridges. Such a field evaluation enables the industry partners to learn more about the concrete deterioration processes, and about the ways in which concrete patching systems withstand deterioration.
The repair work consisted of the removal of the deteriorated concrete, the appropriate surface preparation, and the application and curing of the concrete patching system. Each supplier installed its own repair products.
Each repair system was installed in 2 sections, one on each side of the bridge. The barrier wall on the north side is representative of harsher environmental conditions (higher thermal stresses resulting from longer exposures to solar radiation), as evidenced by a higher degree of concrete deterioration than that of the barrier wall on the south side. This provided an excellent opportunity for the suppliers to have their concrete patching systems evaluated under 2 different realistic field conditions.
4. MONITORING STRATEGY
Since the primary purpose of this investigation is to evaluate the long-term performance and the deterioration mechanisms of the concrete patching systems, the monitoring strategy adopted for this field study required recording all variations of many parameters for at least a 3-year period. This is achieved by (i) remotely monitoring the condition and performance of the rehabilitated barrier wall with embedded instrumentation, (ii) taking extensive semi-annual corrosion surveys on site, and (iii) conducting supporting experiments in the laboratory.
4.1 Remote Monitoring
A delamination survey indicated that the sections of the north barrier wall did not have enough sound concrete between patches to detect the presence of macro-corrosion cells around the patch. The decision was made, therefore, to instrument eight consecutive sections on the south side of the bridge only, in which
adequate amounts of old concrete and delamination were present. The sections on the north side will be evaluated using non-destructive field surveys only. Approximately 90 sensors of different types were installed in patches and in the old concrete in the vicinity of the instrumented patches. An automated data acquisition system, equipped with a cellular modem for data transmission and powered by solar collectors, completed the site installation.
4.2 Field Surveys
Condition surveys of the traffic-exposed surface of the twenty rehabilitated sections of concrete barrier wall (north and south) are performed twice a year by MTO for a period of at least 3 years. The surveys consist mainly of visual inspections and the external monitoring of the rebar corrosion activity (half-cell potential and linear polarisation resistance) and non-destructive testing of concrete (permeability, resistivity, ultrasonic pulse velocity, etc.). Together with the data recorded from the embedded sensors, the field survey will enable a complete evaluation of the field performance of the patching systems and their effects on the surrounding old concrete.
4.3 Laboratory Experiments
For the characterisation of the various patching materials used in this study, several samples were cast on site from each test section during
construction. Tests conducted at 28 days in IRC and MTO laboratories included compressive strength, splitting tensile strength, freeze-thaw resistance, permeability, and salt scaling. Cores were also taken in the old concrete for the determination of compressive strength, chloride profile, and permeability.
5. FIELD INSTRUMENTATION
In each of the 8 test sections on the south side of the bridge, one patch area was selected for instrumentation. The patch had to be at least 800 mm long, 400 mm high, and 100 mm deep in order to accommodate the set of embedded sensors. Another requirement for the patch was to be at least 800 mm away from the next patch or the next section, in order to accommodate the sensors in the old concrete and to avoid any influence of the adjacent sections. Since field studies require the consideration of several parameters that vary simultaneously in the course of the study, many types of sensors were therefore used to monitor the rapidly changing field conditions. They include: relative humidity and temperature sensors (RHT), reference electrodes (RE), electrical resistance probes (RP), and strain gauges/devices (SG or SD). Their location, in each instrumented section, is presented in Figure 2 and the rationale for their location and use is given below.
Figure 2: Location of sensors in a typical test section
RE3 RE4 RP2 RHT2 SD SG2 803 mm RHT1 200 mm Instrumented rebar RE1 RE2 RP1
Institute for Research in Construction’s Paper NRCC 41037 Page 4 of 8
5.1 Relative Humidity and Temperature Sensors
5.1.1 Selection
Temperature has a direct effect on the corrosion rate: an increase in temperature increases the reaction rate and decreases the concrete electrical resistivity. Relative humidity also has an effect on the corrosion rate since it influences the amount of moisture in the concrete pores which sustains the corrosion reaction. It is therefore important to measure temperature and RH in concrete as well as in the ambient air.
The RH/T sensor, model HMP44, from Vaisala Inc. was selected for its compact size (12 mm diameter, 70 mm length), robust construction and accuracy. It consists of a thin polymer film transducer whose electric capacitance changes with RH of the ambient air around the sensor head. The capacitance transducer combined with a resistance temperature detector (RTD) is protected by a filter from dust and condensation, which is an important feature for field application. It offers a RH reading accuracy of ±3% (at 20°C) for measurements between 0 and 100%, and a temperature reading accuracy of ±0.4°C for measurements between -20 and 60°C.
5.1.2 Field installation
A similar bridge repair study (Cusson and Mailvaganam 1999), in which RH and temperature sensors were embedded near the top and bottom of reconstructed barrier walls (900 mm high), indicated that their readings were almost independent of height. It was therefore decided for the current project to use these sensors only at one height in the barrier wall. RH and temperature sensors were placed in pairs at the centre of the repaired area. One sensor (RHT2) was embedded in the patch with the tip located at 50 mm from the front surface of the barrier wall. The other sensor (RHT1) was installed in a hole drilled in the old concrete behind the patch with the tip located 50 mm behind the 100 mm thick patch. This setup provides information on the level of RH and temperature on each side of the old concrete-patch interface. Also, one sensor was installed under the bridge deck to measure the RH and temperature of the ambient air.
5.2 Reference Electrodes
5.2.1 Selection
Half-cell potential of steel reinforcement is an indication of the extent of corrosion activity in the area monitored. A general guideline (ASTM C876-91) for
evaluating the half-cell potential of reinforcing steel in concrete is often used. However, factors not considered in the guideline such as cell location, chloride level, concrete temperature and moisture content, can also affect half-cell potential values. This often results in difficult, and sometimes misleading, interpretation of the data. Therefore, the evaluation of a large number of closely spaced half-cell potentials is desirable. It is also very important to analyse corrosion potentials combined with field survey results such as linear polarisation resistance, etc.
The ERE 20 embeddable MnO2 reference electrodes
from Forces Institutes Inc. were chosen to monitor the electrochemical potential at selected locations along the reinforcement. The compact size of this reference electrode (16 mm diameter and 85 mm length) make it suitable for field applications. The electrode was designed using proven battery technology and has a long-term stability (Arup et al. 1997). It has been used in the field since 1986.
The porous tip of the electrode is made of a cement-based material, which is suitable for the study of corrosion in concrete. When the electrode is embedded in concrete, no significant junction potential develops at the electrode interfaces. This is because the inner electrolyte is a buffered alkaline gel with a pH of approximately 13.5, which is similar to the pH of the electrode tip and normal concrete. The alkaline gel in the cell can stand much lower temperatures (down to -25oC) without freezing than Cu/CuSO4 electrodes.
Its potential is approximately 110 mV more positive with respect to the Cu/CuSO4 reference electrode.
5.2.2 Field installation
In practice, embedding a large number of reference electrode is not economical and efficient. The location of electrodes must be chosen carefully. These MnO2
electrodes were placed in groups of four in order to measure the half-cell potential along the length of a longitudinal bar. Two electrodes (RE3 and RE4) were embedded in the patch and two others (RE1 and RE2) were installed in holes drilled in the old concrete beside the patch. Their tips were located 10 mm behind the bar. This setup provides a profile of half-cell potentials indicating if a macro-corrosion half-cell will occur in the patch or in the surrounding concrete.
5.3 Electrical Resistance Probes
5.3.1 Selection
Electrical resistance of concrete is one of the major factors that control the kinetics of steel corrosion in
reinforced concrete. In general, the larger the electrical resistance of the concrete, the smaller is the rate of the corrosion of the reinforcement. Since concrete is assumed to behave as an ohmic material, its electrical resistance corresponds to the linear relation between the potential difference and the corresponding current applied to the material.
Although techniques for determining the electrical resistivity of concrete in the laboratory are well established (Morris et al. 1996), there is little information available on the monitoring of electrical resistance of concrete in long-term field evaluation of large structures. Concerns were raised about the type of probes, monitoring equipment, installation procedures and durability in order to withstand the harsh climatic conditions. To address these concerns, an experimental study was conducted in the lab on concrete prisms to select and adapt existing lab techniques for field use. The findings of this investigation are reported by Repette et al. (2000). Following are the two major parameters selected for monitoring the electrical resistance of concrete in the bridge barrier walls.
Excitation with Direct Current (DC) – Resistivity measurements on concrete samples using DC excitation were compared to similar measurements using alternated current (AC) excitation and very good agreement was found. The influence of electrode polarisation, usually taken as the major factor responsible for differences between AC and DC readings, was minimised by the short duration of the potentiostatic excitation pulse (80 ms). Fast excitation pulses help to prevent excessive electrode polarisation, resulting in more accurate electrical resistance measurements. The pulse amplitude, which was set to 5 Volts, should be high enough to induce readable outputs, but not too high to reduce polarisation and corrosion of the electrodes, which is particularly important for long-term monitoring. It should also be mentioned that data loggers capable of performing AC measurements are considerably more expensive than those working on DC.
Two-pin electrode configuration – The results of the lab tests indicated that both 2-pin and 4-pin (Wenner) electrode arrays produce results of electrical resistance that correlate well with the resistivity measured with the standard parallel plates (ASTM F43-93). This supported the choice for the use of the 2-pin electrode configuration, since it requires less concrete drilling on site, less cable wiring and fewer channels of the data-loggers.
Each set of probes was made of two 5 mm diameter 316 stainless steel rods, covered with heat shrink tubing except for 2 mm at their tips, which was left exposed. By exposing only the tips of the pins, significant variation of the electrical field produced is avoided, and more accurate readings are obtained. The spacing between the 2 parallel pins was set to 50 mm (2.5 times the max. aggregate size).
5.3.2 Field installation
These probes were placed in pairs: one probe (RP2) embedded in the patch, the other probe (RP1) drilled in the old concrete beside the patch. Their tips were located approximately 50 mm from the front surface of the barrier wall, which corresponds to the reinforcement depth. The data from these probes will support and complement the data taken with the reference electrodes (Figure 2).
Endurance of the contact between the electrodes and concrete is crucial, especially for the probes installed in the old concrete. This was ensured by the use of a carbon-based conductive paste, with good thermal stability and high conductivity, placed between the concrete and the tip of the pin. The gap around the unexposed portion of the probe in the hole was filled with epoxy or silicone, in order to prevent moisture ingress that could affect the resistance readings.
5.4 Strain Gauges
Longitudinal strain in the patch – Such strain readings enable the analysis of the mechanical strain, drying shrinkage and thermal movement in the patch. Rebars were pre-instrumented in the lab with a strain gauge located at mid-length. The strain gauge was a foil-type 2-element 90° rosette connected as a ½-bridge configuration. One instrumented bar was then placed horizontally in each patch area, attached to the main reinforcement as shown in Figure 2 (SG2). The bar diameter was 20 mm, equal to the diameter of the main reinforcement, and the length was 800 mm, long enough to develop an adequate bond with the surrounding patch concrete.
Longitudinal strain in the old concrete – The comparison between these strain readings and those in the patch enables the analysis of compatibility and shear formation at the interface between the old concrete and the patch. Concrete was removed to expose a 100 mm long section of embedded rebar in the back of the barrier wall (2nd bar from the top in Figure 2). After removal of the old concrete, a strain gauge was applied on the bar. The strain gauge was a foil-type two-element 90° rosette connected as a
½-Institute for Research in Construction’s Paper NRCC 41037 Page 6 of 8
bridge configuration. After waterproofing the gauge, the opening was filled with repair material. The opening was made as small as possible in order to minimise the disruption of the bond between the bar and the old concrete and the effect of the repair mortar on the instrumented bar. This strain gauge in the old concrete (SG1) is not shown in Figure 2. Transverse strain in the patch – This type of strain reading was selected mainly to study the behaviour of the bond between the patch and the old concrete. Custom-made strain-gauge devices (SD) were placed at the old concrete–patch interface as shown in Figure 2. The stainless-steel body of each unit consisted of a cylinder measuring 30 mm in diameter and 50 mm in length inside which 2 foil-type two-element 90° strain gauge rosettes were installed in a full-bridge configuration.
The strain-gauge devices had the following characteristics: (i) a transformed cross-sectional area equal to the area of concrete removed (equal overall elastic moduli) to prevent concentration of stresses near the device, (ii) automatic compensation for temperature effects for more accurate readings, (iii) moisture and corrosion resistance by using stainless steel components and silicone seals at the connections. They were made short in order to measure the transverse strain close to the interface and to respect the 40 mm thick concrete cover in the 100 mm deep patch.
5.5 Data Acquisition System
5.5.1 Selection
The data acquisition system consists of four Datataker DT505 data loggers from Data Electronics Ltd., each equipped with 2 channel expansion modules (input impedance of 10 MΩ). The DT505 loggers are linked together via a RS485 port to form a local area network (LAN). This system was selected because of its good performance in previous similar projects and for its capability to support various types of sensors, on-line data manipulation and statistical functions. This system uses defined instructions to read data from different types of sensors, and to store the data onto a memory card until it is transferred to a computer. The data logging system is equipped with a cellular modem and antenna to allow for remote wireless communication with computers in NRC laboratories for the transfer of data (Figure 3). Readings of the sensors are scheduled at 12-hour intervals with the data being downloaded remotely from the memory cards on a monthly basis.
The system is powered by a bank of three 12-volt batteries, which are recharged by a set of three solar panels (Siemens Solar Industries, model M75) mounted on a 6 m high pole (Figure 1). This type of power source was selected due to the lack of available AC power at the site. To minimise power consumption, the loggers were programmed to activate from low power (sleep) mode only when a scan of the sensor channels is scheduled and to activate the cellular modem for only 2 hours each day to allow for remote communication.
Solar Controller Charger 12-Volt Batteries Data Loggers Cellular Modem Solar
Panels InstrumentationBridge Antenna
Insulated Enclosure
Modem Manager Data
Loggers
Figure 3: Diagram of the data logging system
5.5.2 Field installation
The loggers and cellular modem were housed in two watertight insulated metal enclosures. The enclosures and the bank of batteries were mounted in a second larger protective metal chassis which was firmly bolted on the concrete abutment under the bridge deck. For environmental protection, cabling from the sensors was run to the logger enclosure through PVC conduit mounted on the back of the bridge barrier wall.
6. PARTIAL PRELIMINARY DATA
Figures 4 to 9 present the daily-averaged values of different parameters recorded in some test sections from mid-November 1999, the start of remote monitoring, to mid-February 2000. The data is presented here mainly to demonstrate the proper functioning of the instrumentation system.
6.1 Temperature
Figure 4 presents the ambient temperature, the temperature in the patch and in the old concrete of Section 2. There is an excellent match of the 3 temperature curves, indicating the absence of a
significant temperature gradient in the barrier wall. A comparison between Figure 4 and the following ones reveals that temperature has a strong influence on other measured parameters, reinforcing the importance of temperature in such a study.
Figure 4: Temperature measured in Section 2
6.2 Relative Humidity
Figure 5 shows that the RH in the concrete barrier wall of Section 3 is relatively stable (compared to ambient RH) due to slow drying or wetting of concrete. As expected, the RH in the freshly placed patching material is close to 100% and higher than that of the old concrete.
Figure 5: Relative humidity measured in Section 3
6.3 Electrochemical Potential
Figure 6 shows the half-cell potentials recorded with the MnO2 electrodes in Section 4. It can be seen that
the half-cell potential obtained in the new patch has
less negative potential values. This is because the high pH of the new cement reduces the corrosion activity of the reinforcement. The data also show that the potentials recorded from the 4 locations along the monitored rebar vary in almost the same pattern. This is probably the effect of temperature and RH.
Figure 6: Potential measured in Section 4
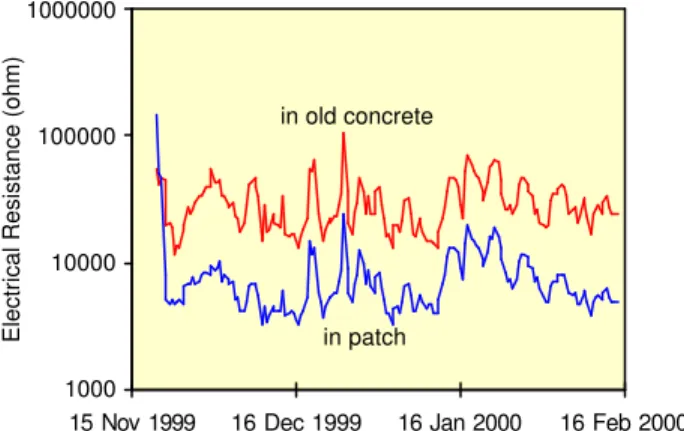
6.4 Relative Electrical Resistance
Typical results for electrical resistance measured in the patch and in the old concrete of Section 5 are presented in Figure 7. The readings show a consistent variation of electrical resistance with temperature (inversely proportional), a parameter that must be accounted for during the analysis. The results also indicate that the patch is less resistive than the old concrete. This was expected since the patching material, being recently placed, has a lower degree of cement hydration and higher moisture content than the old concrete.
Figure 7: Relative resistance measured in section 5
-25 -20 -15 -10 -5 0 5 10 15
15 Nov 1999 16 Dec 1999 16 Jan 2000 16 Feb 2000
Temperature (C) 20 40 60 80 100 120
15 Nov 1999 16 Dec 1999 16 Jan 2000 16 Feb 2000
Relative Humidity (%) in old concrete in patch ambient -0.50 -0.45 -0.40 -0.35
15 Nov 1999 16 Dec 1999 16 Jan 2000 16 Feb 2000
Potential vs. MnO2 reference (V)
-0.39 -0.34 -0.29 -0.24
Potential vs. Cu/CuSO4 ref. (V)
in old concrete
in patch in patch near interface
in old concrete near interface
1000 10000 100000 1000000
15 Nov 1999 16 Dec 1999 16 Jan 2000 16 Feb 2000 Electrical Resistance (ohm) in patch
Institute for Research in Construction’s Paper NRCC 41037 Page 8 of 8
6.5 Strain
Figure 8 presents the mechanical part of the longitudinal strain measured in the patch and the old concrete of Section 1, and the transverse strain in the patch. It is important to note that the strain curves represent the increase in strain since the first day of data acquisition (3 weeks after patching), and do not include the thermal strain component, since all gauges were compensated for temperature effects. The thermal component can be added to the mechanical strain, knowing the temperature changes in concrete and its coefficient of thermal expansion.
Figure 8: Mechanical strain measured in Section 1
Examination of the mechanical strains recorded in the longitudinal direction reveals that these strains are not directly proportional to corresponding changes in temperature (Figure 4). This is an indication that the barrier wall is significantly strained by other parts of the bridge structure reacting in various ways to temperature changes. Also, the mechanical strain in the transverse direction of the patch is significantly smaller than the corresponding longitudinal strain. This is due to the different loading and restraining conditions with respect to the direction considered.
7. SUMMARY AND CONCLUSION
The strategy selected for this bridge repair project is to evaluate the long-term performance of concrete patching systems under field conditions, using internal monitoring (embedded instrumentation) as well as external monitoring (non-destructive test methods). The embedded instrumentation installed on site includes (i) reference electrodes and electrical resistance probes for the monitoring of the
electrochemical corrosion activity of the reinforcement, (ii) temperature and relative humidity sensors for the determination of the key environmental conditions which strongly affect corrosion, and (iii) strain gauges for the measurement of the deformation of the repaired system under various loads. The use of remote data loggers equipped with a cellular modem and solar collectors allows continuous remote monitoring of the long-term field performance of the rehabilitated barrier walls. This technology is extremely useful for bridges remote from the laboratory or for busy highway bridges on which the traffic can not be disrupted.
8. ACKNOWLEDGEMENTS
The authors would like to acknowledge the following organisations for their contributions: Axim Concrete Technology, IMCO, King Packaged Materials, Master Builders Technologies, Sika Canada, Silcrete Technologies and the Region of Peel. The assistance of Mr. Chan, Mr. Lowery and Mr. Glazer of IRC, and of Mr. Islam, Mr. Cheng and Mr. Tremblay of MTO (Eastern Region) is also greatly appreciated.
9. REFERENCES
Arup, H., Klinghoffer, O. and Mietz, J. (1997) Long Term Performance of MnO2-Reference Electrodes in Concrete,
Corrosion97 NACE Conference, New Orleans, 11p.
ASTM C876-91 Standard Test Method for Half-Cell Potentials of Uncoated Reinforcing Steel in Concrete. ASTM F43-93 Standard Test Methods for Resistivity of
Semiconductor Materials.
Bradbury, A. (1987) A Laboratory Evaluation of Concrete Patching Materials, Materials Information MI-67, Rev. 1, Ministry of Transportation, Concrete Section, Ontario. Cusson, D. and Mailvaganam, N. (1999) Monitoring
Techniques for the Evaluation of Corrosion Inhibiting Systems in Reinforced Concrete Bridge Barrier Walls,
Concrete International, 21(8), 41-47.
Emberson, N.K. and Mays, G.C. (1990) Significance of Property Mismatch in the Patch Repair of Structural Concrete Part 1: Properties of Repair Systems, Magazine
of Concrete Research, 42(152), 147-160.
Gulis, E.W., Lai, D. and Tharambala, B. (1998) Performance and Cost Effectiveness of Substructure Rehabilitation/Repair Strategies, Draft Report, Ministry of Transportation, Structural Office, Ontario.
Morris, W., Moreno, E.I. and Sagues, A.A. (1996) Practical Evaluation of Resistivity of Concrete in Test Cylinders Using a Wenner Array Probe, Cement and Concrete
Research, 26(12), 1779-1787.
Repette, W.L., Glazer, R., Lowery, M. and D. Cusson (2000) Development of Probes for the Long-Term Field Evaluation of Electrical Resistance in Concrete, to be submitted. -200 -100 0 100 200 300
15 Nov 1999 16 Dec 1999 16 Jan 2000 16 Feb 2000
Microstrain
in patch (transverse) in patch (longitudinal) in old concrete (longitudinal)