HAL Id: hal-00869314
https://hal-enpc.archives-ouvertes.fr/hal-00869314
Submitted on 3 Oct 2013
HAL is a multi-disciplinary open access
archive for the deposit and dissemination of
sci-entific research documents, whether they are
pub-lished or not. The documents may come from
teaching and research institutions in France or
L’archive ouverte pluridisciplinaire HAL, est
destinée au dépôt et à la diffusion de documents
scientifiques de niveau recherche, publiés ou non,
émanant des établissements d’enseignement et de
recherche français ou étrangers, des laboratoires
The Prospective Evolution of the Vietnamese Power
Sector: The Vulnerability and Externality Analysis
Trinh Hoang Anh Nguyen
To cite this version:
Trinh Hoang Anh Nguyen. The Prospective Evolution of the Vietnamese Power Sector: The
Vulner-ability and Externality Analysis. Prof. August Schläpfer. Sustainable Energy: Planning and Policies,
Théoneste Uhorakeye, pp.20-36, 2013, ISBN 978-3-8236-1648-1. �hal-00869314�
1
The Prospective Evolution of the Vietnamese Power Sector: The Vulnerability and Externality Analysis
Nguyen Trinh Hoang Anh* Abstract:
With its rapidly increasing power demand of 16% p.a since 1990s along with its limited supply power capacity, how sustainable is Vietnam’s electricity development? What are the major factors explaining its sustainable performance relative to other Asian countries? To answer these questions, this paper examines the Vietnamese power system from the 1990s to 2040 by using LEAP simulation. Twelve vulnerability and externality indexes regarding social-economic-environmental dimensions are calculated to assess vulnerable levels of the sector in seven scenarios. External costs of CO2, NOx, SO2 and PM10 are calculated to examine how far the
costs could affect on the electricity cost in Vietnam. In sensitivity analysis, the paper assesses the impacts of international coal price’s fluctuations on the electricity price and the trade balance of Vietnam.
The study confirms that Vietnam’s power sector will become more vulnerable to fossil fuels’ prices, environmental pollutants and climate change if the sector goes for the current policy pathways. With proposed efficiency scenarios by the study, the sector would be more dependent and less vulnerable. To reduce the vulnerabilities, the study suggests that Vietnam should promote energy efficiency and electricity generation from non-fossil fuels and internalize external costs into the power sector. Vietnam needs also actively get involved in international financial mechanisms such as the CDM and technology transfer programs to efficiently exploit its renewable energy potentials.
*) This article is based on the author’s master thesis, with the same title, completed in 2010 under the supervision of Prof. Olav Hohmeyer, Prof. August Schläfer (University of Flensburg, Germany) and Dr. Minh Ha-Duong, Dr. Thanh Nhan Nguyen (International Center for Environment and Development, CIRED/CNRS, France)
.
2
I. Introduction
Vietnam locates on the Indochina Peninsula, a region of South East Asia with a long-S shape and a long coastline of over 3,200 km. Vietnam owns a large continental shelf of 1 million km2 with rich natural resources, such as natural gas, crude oil and seafood. As pointed in the national climate report to UNEP, Vietnam is one of countries most vulnerable to climate change, especially for higher annual average temperature, sea-level rise, etc1.
Vietnam’s government has been pursuing a high-growth-rate economy which requires high energy inputs. Therefore, the country is under pressure to develop a secure and affordable energy supply to support the socio-economic development. The power sector has been causing a number of environmental- and energy security-related problems for the country. This paper reviews and simulates electricity supply and use in Vietnam during the 1990s and 2040. LEAP, a bottom-up model for energy planning, is applied to simulate the power system and inventory airborne emissions of the power generation sector for the next 30 years in Vietnam.
II. Methodology
2.1 Vulnerability analysis
The concept of energy security is often understood as developing and maintaining a reliable energy supply with affordable costs and
prices. According to the World Bank2, three key elements of global
energy security are: energy efficiency, proper diversification of energy supply and ability to deal with volatility of energy prices. National energy planners should take them into account as the long-term goals of energy development strategy.
Vulnerability analysis approach
In the current study, mainly based on relevant studies as mentioned earlier, some energy-related indicators for vulnerability analysis of
1Institute of Strategy and Policy on Natural Resources and Environment: Vietnam
Assessment Report on Climate Change to United Nations Environment Programme, 2009
2 The State University of New York
http://www.globalization101.org/index.php?file=issue&pass1=subs&id=327, printed on 21.7.2009
3
sustainable development in Vietnam are proposed and measured as shown in Table 1.
Table 1: Energy-related indicators for vulnerability analysis
Indicators Unit
Social dimension
1. Share of households or population without electricity access
2. Electricity access and poverty rate % %
Economic dimension
3. Energy and electricity consumption per capita kWh/capita 4. Energy and electricity use per unit of GDP GWh/Mill.$GDP 5. Efficiency of energy transformation process % 6. Diversity of primary fuels for power generation
7. Energy import dependence %
Environmental dimension
8. Quantities of CO2& other airborne emissions from power sector ton 9. Annual emissions per capita ton/capita 10. Costs of CO2 by GDP % 11. External costs by GDP % 12. External costs by total investment costs in power sector %
(Source: author)
2.2 Externality analysis
Airborne emission inventory
In this study, some airborne emissions as listed in Table 2 are inventoried to examine external costs of the power generation sector.
Table 2: Types of emissions and damages considered
No. Impact category Pollutants Effects
1. Human health NOx, SO2,
PM10 -Reduction in life expectancy, congestive heart failure
2 Impacts on crop and materials NOx, SO2
-Yield change for rice, potato, sugar cane,
-Ageing of galvanized steel, limestone, mortar, sandstone, paint, rendering, and zine for utilitarian buildings 3. Global warming CO2 -Wide effects on mortality, morbidity, coastal impacts, agriculture, energy demand and economics.
(Source: ExternE project) Table 3: Emission factors in estimation of NOx, SO2, PM10 emissions inventory
Fuel (unit) Emission factors
SO2 NOx PM10
Coal (kg/t) 16.58 9.95 4.16 Diesel oil (kg/t) 4.00 27.40 2.08 Natural gas (×10-4 kg/m3) 0.01 40.96 1.22
4
(Source: Kato and Akimoto, 1992)3
*CO2 emission inventory: calculated based on the method adopted
by the Intergovernmental Panel on Climate Change, IPCC 1995.
Table 4: Parameters in estimation of CO2 emission inventory
Fuel QL (kJ/kg) EFC (kgC/GJ) OC (%) Coal 20,934 25..8 91.8 Diesel oil 42,705 20.2 98.0 Natural gas 38,979 15.3 99.0
(Source: Qingyu Zhang et al.) 4
External cost calculations
Due to lack of sufficient data and particular evaluations to calculate externality costs in the power sector, external costs factors are extrapolated from other relevant studies in China.
(1) External cost for NOx, SO2 and PM10:
ܧݔݐ݁ݎ݈݊ܽ ܿݏݐ ݂ ݁݉݅ݏݏ݅݊ ሺ݅, ݆ሻ = ܥܨ,∗ ܶݐ݈ܽ ݁݉݅ݏݏ݅݊ ሺ݅, ݆ሻ -External cost factors for NOx, SO2 and PM10:
ܥܨ, = ܥܨݔܦܦ ݔ ܲܲܲ ܲܲܲ ቈ ܷܵ$ ݐ݊ Where:
D: population density (person/km2), PPP: purchasing power parity (Bill. US$), i = region, j = pollutant
(2) External cost factors for CO2:
There are several existing methodologies to evaluate costs of CO2. It
could be 19 US$/ton which is an average cost of CO2 control used
by the European Commission (2003). In some studies of these issues in China, costs of CO2 are US$50/ton (Kypreos S, Krakowski R5).
In long-term projections, an average CO2 control cost of US$ 20/ton
would be used.
3 Kato, N. and H. Akimoto (1992): Anthropogenic Emissions of SO
2 and NOx in
Asia: Emissions Inventories (plus errata), Atmos. Env. 26a: 2997-3017. 1992
4 Qingyu Zhang , Tian Weili, Wei Yumei, Chen Yingxu (2007): External costs from
electricity generation of China up to 2030 in energy and abatement scenarios, Energy Policy 35 (2007) 4295–4304
5 Kypreos S, Krakowski R. (2002): Introducing externalities in the power generation
5
2.3 Scenarios development and simulation
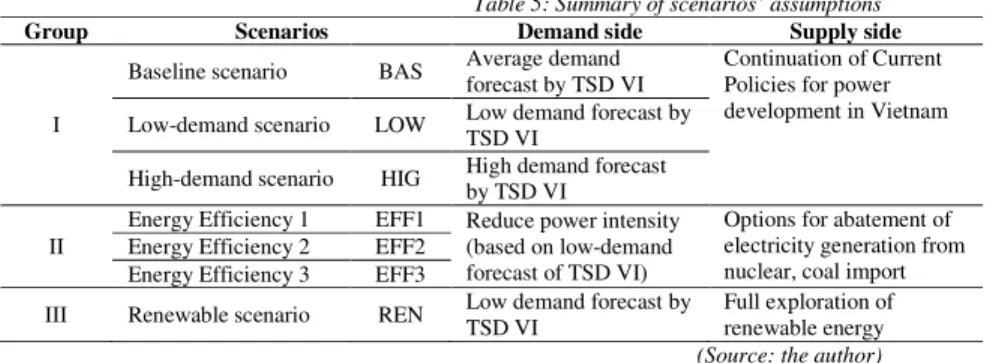
To analyze different perspective evolutions of the power sector in Vietnam, a number of scenarios are developed using the LEAP model. Basically they are derived from the three scenarios in the latest master plan of power development in Vietnam, abbreviated TSD VI. 7 scenarios are considered and summarized in Table 5.
Table 5: Summary of scenarios’ assumptions
Group Scenarios Demand side Supply side
I
Baseline scenario BAS Average demand forecast by TSD VI Continuation of Current Policies for power development in Vietnam Low-demand scenario LOW Low demand forecast by
TSD VI
High-demand scenario HIG High demand forecast by TSD VI II
Energy Efficiency 1 EFF1 Reduce power intensity (based on low-demand forecast of TSD VI)
Options for abatement of electricity generation from nuclear, coal import Energy Efficiency 2 EFF2
Energy Efficiency 3 EFF3
III Renewable scenario REN Low demand forecast by TSD VI
Full exploration of renewable energy
(Source: the author)
GDP: In the LOW scenario, the projection of annual GDP growth rate is 7.5% during 206-2010, 7.2% during 2011-2020 and 7% afterwards. The BAS and HIG scenarios have the same annual GDP growth rates over the selected period: 8.5% during 2006-2020 and 8.0% afterwards.
Power demand: Data of the three scenarios LOW, BAS and HIG are from the TSD VI. The TSD VI has only projected the power demand up to 2025, thus the data from 2025 to 2040 is extrapolated by annually decreasing growth rates.
Power losses: The total power losses in transmission and distribution grids are 10.8%-9.6%- 8.5% and7.5% by 2010-2015-2020 and 2025, respectively. For power self-consumption of power plants in the system, this rate increases from 3% by 2010 to 4.5% by 2040.
6
Reserve margin: Reserve margin will increase regularly from 1% in 2010 to 15% by 2040 as references from other power system operators6.
Power supply:
Table 6: Power capacity potential from non-fuel energy up to 2040
No. Type of primary fuel MW GWh No. Type of primary fuel MW
1 Large & Medium hydro 17,174 70,000 5 Geothermal 472 2 Small hydro 4,045 6 Biomass 1,000 3 Hydro pumped storage 10,000 20,805 7 Solar 10 4 Tidal 23 8 Wind 840
(Source: Combined from Master plan for renewable energy development in Vietnam (Institute of Energy) and other relevant studies)
LEAP: a computer tool for energy planning
LEAP which stands for Long-range Energy Alternatives Planning has been used in numerous countries to enhance national communication on GHGs emission to the UNFCCC. So far LEAP is expected to be one of the most efficient tools for non-Annex I
countries implementing their GHG mitigation assessment7.
6 The North American Electric Reliability Corporation:
http://www.nerc.com/page.php?cid=4|331|333, printed 30.4.2010
7
7
III. Results
3.1 Energy balances
Figure 1: Electricity generation in Vietnam power system, 2000-2040
(Source: EVN and results of LEAP simulation)
In the model, all scenarios can ensure the energy balances over the period 2010-2040. In the BAS scenario, total electricity output increases by about 10 times to 1,111 TWh in 2040 as compared to 112 TWh in 2010 and by more than 40 times as compared to 26 TWh in 2000. In the BAS scenario, the total power capacity is approximately 186 GW. It is about 1.5-1.3-1.2 times more than those of the EFF1, EFF2 and EFF3 scenarios, respectively. The main differences between installed capacities of these scenarios are due to differences from gas/coal-fired power.
Additionally, from the three efficiency scenarios, the deployments of nuclear power are insignificant. For EFF1 and EFF2, there is no nuclear power deployed while in EFF3, there is only 2,000 MW of nuclear power starting in 2039. This is one third of the 6,000 MW proposed recently by the Vietnamese Government as simulated in the LOW, BAS and HIG scenarios.
0 200 400 600 800 1000 1200 2 0 0 0 2 0 0 3 2 0 0 6 2 0 0 9 2 0 1 2 2 0 1 5 2 0 1 8 2 0 2 1 2 0 2 4 2 0 2 7 2 0 3 0 2 0 3 3 2 0 3 6 2 0 3 9 T W h Baseline (BAS) High-demand (HIG) Low-demand (LOW) Efficiency 1 (EFF1) Efficiency 2 (EFF2) Efficiency 3 (EFF3) Renewables (REN)
8
Figure 2: Total capital costs for power generation in Vietnam, 2010-2040
(Source: LEAP simulation)
In the BAS scenario, cumulative investment cost for power generation from 2010 to 2040 is about 306 billion US$ and from 2014 annual investment cost accounts for 5-8% of GDP in Vietnam. Compared to the BAS scenario, the reduction of investment costs over the period 2010-2040 in the EFF1, EFF2 and EFF3 scenarios are 80, 67 and 47 billion US$, respectively. The government should liberalize the power market to attract private and foreign investors to the power generation sector. As empirical examples in developing countries show, many energy experts recommend that 1 US$ expense on the demand side could save 2 US$ saving on the supply side. For example, if the government would take EFF2 as its power development pathway, about 33.5 billion US$ would need to be invested from 2010 to 2040 for DSM programs.
In the BAS scenario, total costs of electricity generation increases by about 15 folds to 28 billion US$ in 2040 as compared to 1.8 billion US$ in 2010. Cumulative total costs in the BAS is estimated 438 billion US$ that is higher than those of other scenarios as: (LOW, REN, EFF1, EEF2, EFF3) and (9, 10, 117, 88, 67) billions US$, respectively. In return, it is 2 billion US$ lower than the HIG’s.
3.2 Vulnerability indexes
Overall use of electricity
Figure 3 below graphically presents power intensity in term of MWh per capita in selected Asian countries and three scenarios of power
0 2 4 6 8 10 12 14 16 18 20 22 2 0 1 0 2 0 1 2 2 0 1 4 2 0 1 6 2 0 1 8 2 0 2 0 2 0 2 2 2 0 2 4 2 0 2 6 2 0 2 8 2 0 3 0 2 0 3 2 2 0 3 4 2 0 3 6 2 0 3 8 2 0 4 0 B il li o n U S D BAS EFF1 EFF2 EFF3
9
development in Vietnam: the BAS, LOW and EFF1 scenarios over the period 1971-2040.
Figure 3: Power intensity (MWh per capita) of selected Asian countries, 1971
(Source: Institute of Energy; the Institute of Energy Economic, Japan (IEEJ) and
In the BAS scenario, Vietnam’s power intensity is in the lower group, with the Philippines and Indonesia. However, from the period 2005-2015, it is growing very fast and will overtake China by 2025. In the LOW scenario, the pattern of power intensity increase is the same as in the BAS with slightly slower growth and it is projected to equal China’ one by 2030. In the EFF1 scenario, all countries have more or less the same growth rate of power intensity and the correlations among the countries’ power intensity does not ch during 2005-2030.
Overall productivity of power use
The indicator of power intensity tells us how much power in MWh a country uses to produce a million US$ of its GDP.
Figure 4, Vietnam’s power intensity in the BAS scenario
twice as high as Malaysia’s which is second place among the group. Even in the best energy efficiency scenario, EFF1, power intensity of Vietnam is still highest. In fact, the unusual trends of power intensity changes in Vietnam can be easily recognized. Although the patterns are inverted-U-shape like the environmental Kuznetz’s
0 2000 4000 6000 8000 10000 12000 14000 1 9 7 1 1 9 7 3 1 9 8 0 1 9 8 5 1 9 9 0 1 9 9 5 2 0 0 0 2 0 0 5 2 0 1 0 2 0 1 5 2 0 2 0 2 0 2 5 MWh/capita
development in Vietnam: the BAS, LOW and EFF1 scenarios over
per capita) of selected Asian countries, 1971-2030
(Source: Institute of Energy; the Institute of Energy Economic, Japan (IEEJ) and results from LEAP)
nario, Vietnam’s power intensity is in the lower group, with the Philippines and Indonesia. However, from the period 2015, it is growing very fast and will overtake China by 2025. In the LOW scenario, the pattern of power intensity increase is the e as in the BAS with slightly slower growth and it is projected to equal China’ one by 2030. In the EFF1 scenario, all countries have more or less the same growth rate of power intensity and the correlations among the countries’ power intensity does not change
The indicator of power intensity tells us how much power in MWh a country uses to produce a million US$ of its GDP. As shown in in the BAS scenario is nearly which is second place among the group. Even in the best energy efficiency scenario, EFF1, power intensity of Vietnam is still highest. In fact, the unusual trends of power nam can be easily recognized. Although the shape like the environmental Kuznetz’s
2 0 2 5 2 0 3 0 2 0 3 5 2 0 4 0 LOW scenario BAS scenario EFF1 Phillipines Malaysia Indonesia South Korea China
10
curve, the figures still leads to few concerns regarding its high power intensity in Vietnam from 2010 afterwards
Figure 4: Power intensities (MWh/Mill.USD.2008) of several Asian countries
(Source: Institute of Energy; the Institute of Energy Economic, Japan (IEEJ) and
Diversification of fuels for power generation Figure 5 below presents the Herfindahl
fuel mix of the power generation inVietnam over the period 2003 2040. In the four scenarios, all HHI indexes are very high, more than 3,000, that indicate a highly concentrated fuel mix in Vietnam’s power generation sector.
Figure 5: Diversity of fuel supply in Vietnam power system, 2003
During the observed period, the HHIs of the three efficiency scenarios fluctuate around 3000 until 2030 then annually increases to close to 4000 by 2040 in case of EFF2 and EFF3.
the reliance on hydro-power to coal-fired power probably makes the
0 300 600 900 1200 1500 1 9 7 1 1 9 7 3 1 9 8 0 1 9 8 5 1 9 9 0 1 9 9 5 2 0 0 0 2 0 0 5 2 0 1 0 2 0 1 5 2 0 2 0 2 0 2 5 2 0 3 0 MWh/Mill.USD 2008 2500 3000 3500 4000 4500
curve, the figures still leads to few concerns regarding its high afterwards.
Wh/Mill.USD.2008) of several Asian countries
(Source: Institute of Energy; the Institute of Energy Economic, Japan (IEEJ) and results from LEAP)
power generation
Herfindahl-Hirschman Index (HHI) of fuel mix of the power generation inVietnam over the period 2003-2040. In the four scenarios, all HHI indexes are very high, more than 3,000, that indicate a highly concentrated fuel mix in Vietnam’s
f fuel supply in Vietnam power system, 2003-2040
(Source: LEAP simulation)
During the observed period, the HHIs of the three efficiency scenarios fluctuate around 3000 until 2030 then annually increases to close to 4000 by 2040 in case of EFF2 and EFF3. Shifting from fired power probably makes the
2 0 3 0 2 0 3 5 2 0 4 0 LOW scenario BAS scenario EFF1 EFF2 EFF3 Phillipines Malaysia Indonesia China LOW EFF1 EFF2 EFF3
11
electricity system of Vietnam more vulnerable to fossil fuel price fluctuations.
Net energy import dependence
This indicator assesses how far a country relies on energy imports to maintain national energy balance. If a country heavily depends on energy imports, it definitely faces to two risks: shortage of supply and higher price.
Figure 6: Percentage of imported-fuel-based power capacity in Vietnam, 2003-2040
(Source: combined by author from: EVN, IE, MOIT, results from LEAP simulation)
In overall, the shares in all scenarios are increasing gradually. It is easy to see that higher demand scenarios have higher share of imported-fuel-based power capacity. That means the domestic exploration of conventional energy for power generation is fully considered in all scenarios. For each energy unit higher in demand side, the power system has to mobilize imported fuel or electricity to satisfy.
Vulnerability to power sector caused by high share and high price of imported fuels
As current energy policy for power development in Vietnam as well as the results of LEAP simulation, coal accounts for a lion share of total energy import for power generation. In the LOW scenario by 2025, among 35% of total electricity generation is derived from imported fuels, including both electricity and fossil-fuels, 70% are from coal. To 2040, power generation from imported coal accounts for 53% of the total generation.
0% 20% 40% 60% 80% 2 0 0 3 2 0 0 6 2 0 0 9 2 0 1 2 2 0 1 5 2 0 1 8 2 0 2 1 2 0 2 4 2 0 2 7 2 0 3 0 2 0 3 3 2 0 3 6 2 0 3 9 LOW EFF1 EFF2 EFF3
12
Figure 7 presents different changing ranges of the vulnerability index in the seven scenarios over the period 2012-2040. Varied values of fuel independency and power intensity among the scenarios lead to different levels of vulnerability to Vietnam’s GDP. The HIG scenario is the most vulnerable with ratio of imported fuel bill for power generation to GDP of close to 2.5% by the year 2040.
Figure 7: Ratio of fuel bill for power generation to GDP by scenario
(Source: LEAP simulation)
In other analyses, the LOW scenario is chosen because it is the most possible scenario for the current energy status and policy in Vietnam. The range of selected prices to change is from 3 to 4 US$/GJ due to the international coal price projections from 2010 afterwards also vary in this range8. The selected average efficiencies of coal-fired power plants vary from 38%, which is the current average efficiency in Vietnam, up to 43%, the future recommended efficiency of coal-based power plants, as discussed earlier. The largest changes of the current vulnerability index are caused by changes of power intensity and fuel independency among the scenarios, between 1.0% to 2.5% by 2040. In the LOW scenario, the vulnerability indexes are quite close when the average efficiency changes. By 2040, the variance range is projected at 0.3%, from 2.0% to 2.3%. The range when coal price variance is about 6%, from 1.9% to 2.5%. Thus, to reduce the current vulnerability index, it is important to lower power intensity and coal independency of the power system. Coal price is also a significant factor to the index, thus it is necessary take use of domestic coal for power generation.
8
Combined from IEA, IE, etc. 0.0% 0.5% 1.0% 1.5% 2.0% 2.5% 3.0% 2 0 1 2 2 0 1 4 2 0 1 6 2 0 1 8 2 0 2 0 2 0 2 2 2 0 2 4 2 0 2 6 2 0 2 8 2 0 3 0 2 0 3 2 2 0 3 4 2 0 3 6 2 0 3 8 2 0 4 0 LOW BAS HIG EFF1 EFF2 EFF3
13
To conserve the coal reserve by reducing heat rate of coal-fired power plants as well as current coal exportation could be possible and effective solution to the issue.
3.3 Externality indexes
Externality and its costs in Vietnam’s power sector in period 2000-2009
All airborne emissions steadily increase. In which, the fastest increase is of CO2 emission, almost 3 times. SO2 emission had the
lowest growth rate of 1.3 times during the period of 9 years.
Table 7: Airborne emissions from power generation in Vietnam 200-2009
Year CO2 SO2 NOx PM10 Year CO2 SO2 NOx PM10
2000 14,060 60 38 11 2005 22,646 68 50 22 2001 14,231 68 37 11 2006 24,697 66 56 25 2002 15,942 71 40 14 2007 26,478 77 58 26 2003 19,253 64 46 18 2008 28,540 74 62 28 2004 19,916 57 46 18 2009 38,009 76 89 33 Unit: Million ton; (Source: author)
Table 8: External costs factors of emissions and renewable power in Vietnam
NOx SO2 PM10 CO2 Nuclear Biomass Hydro Geothermal Solar PV Wind
US$/tonne $US cent/kWh
1,328 2,047 1,460 7-20 0.88 1.87 0.61 0.09 0.11 0.27 (Source: author)
The study estimates external cost factors for 4 types of pollutants and six types of power plants as shown in the table 8. Total external costs of the power generation over the period 2000-2009 are estimated as shown in Table 9.
Table 9: Total external costs of power generation sector 2000-2009
Year 2000 2001 2002 2003 2004 2005 2006 2007 2008 2009 Total external costs 591 639 685 743 805 954 1,033 1,152 1,288 1,679
(Source: author)
14
As can be seen in Figure 8, almost all external costs in the power generation sector are during the period 2000
fossil fuel based power plants, accounting for
total external costs. However, fossil fuel based power plants account for a large share in the Vietnam’s power system. Therefore, those power plants definitely contribute a large percentage of the total external costs.
Figure 8: Total external costs of power generation in Vietnam 2000
Detailed sensitivity analysis of CO2
other vulnerable indicators, such as ratio of ext
shown in Figure 9, is discussed in the following part in this chapter.
Figure 9: Ratio of external costs by GDP in Vietnam, 2000
(Mean value = 1.8%) (Source: author)
Quantities of CO2 and other airborne emissions from power sector
As consequence of total electricity generation in each scenario, CO emitted from the HIG scenario is highest and the lowest is from the EFF1 scenario. In the HIG scenario, the total CO
2000 2001 2002 2003 Non fossil fuels 88 110 110 115 Fossil fuels 470 490 537 604 0 500 1000 1500 Million US$ 200 0 200 1 200 2 200 3 % GDP 1.9% 2.0% 2.0% 1.9% 0.0% 0.5% 1.0% 1.5% 2.0% 2.5% E x te rn a l co st s / G D P ( % )
, almost all external costs in the power generation sector are during the period 2000-2009 was caused by the fossil fuel based power plants, accounting for about 85%-90% of the However, fossil fuel based power plants account for a large share in the Vietnam’s power system. Therefore, those power plants definitely contribute a large percentage of the total
external costs of power generation in Vietnam 2000-2009
(Source: author)
prices to external costs and other vulnerable indicators, such as ratio of external costs to GDP as , is discussed in the following part in this chapter.
: Ratio of external costs by GDP in Vietnam, 2000-2009
(Mean value = 1.8%) (Source: author)
other airborne emissions from power sector
As consequence of total electricity generation in each scenario, CO2
emitted from the HIG scenario is highest and the lowest is from the EFF1 scenario. In the HIG scenario, the total CO2 emission from
2003 2004 2005 2006 2007 2008 2009 109 100 115 124 158 181 603 692 740 802 845 1127 200 4 200 5 200 6 200 7 200 8 200 9 1.8% 1.8% 1.7% 1.6% 1.4% 1.8%
15
power generation increases by more than 52 folds to 732 million
tCO2 in 2040 as compared to 14 million tCO2 in 2000, whereas the
total electricicty production grows by over 40 folds in the same period.
Cumutative CO2 emission of the HIG over the period 2000-2040 is
over 9,000 MtCO2. The lowest cumulative CO2 emission is of the
EFF1, equal to 55% of the highest of the HIG. Although generating the same volume of electricity, cumulative CO2 emission of the
LOW is higher than those of the REN, 6820 Mt as compared to 6670 Mt. This is because in the REN, all renewables potential are fully exploited and used for electricity generation and lower fossil fuels are used.
Figure 10: Cumulative SO2, NOx and PM10 emissions from power generation in
Vietnam over period 2000-2040
(source: author)
The radar chart above presents cumulative SO2, NOx and PM10
emissions over the period 2000-2040 by scenarios. As compared to the cumulative CO2 emission over the same period, emissions of
three others are much lower but the correlative amounts among the scenarios are alike.
CO2 intensity
All other scenarios present slightly increasing CO2 emission
intensities up to 2040, the EFF1 scenario is recorded as the lowest and decreasing CO2 emission intensity. Its value by 2040 nearly
equals to 2010 level of approximately 500 tCO2 per million US$
GDP. 0 10 20 30 40BAS HIG LOW EFF1 EFF2 EFF3 REN
Million tons SO2
NOx PM10
16
Total external costs of power generation sector
Figure 11: Total external costs of power generation sector by scenario, 2000-2040
(Source: author)
Externality analysis in the future evolution of Vietnam’s power sector
The study shows that during the period 2000-2009, with CO2 control
cost of 20 US$/ton, external costs per generated kWh in Vietnam decreased from 2.1 to 1.5 US$ cents per kWh. However, afterwards this value increases over the period 2010 up to 2040, from 1.5 to 2.4 US$ cent per kWh, under the BAS and LOW scenarios.
In other aspect of the externality issue, the ratio of total external cost to GDP of Vietnam has been increasing continuously from 1.4% to more than 3.0% over the period 2000-2040 in the three scenarios LOW, BAS and LOW. Those results may relate to two issues in the future evolution of Vietnam’s power sector: (1) penetration level of non-fossil fuel based power capacity and (2) allocation of the external cost to reach a sound development of the power sector.
IV. Conclusions and recommendations
4.1 Conclusions
With the continuation of current policies for energy development, Vietnam hardly can guarantee a secure and affordable energy supply! With a high share of imported fuels, electricity prices will much depend on international prices of fuels but average income of the population is relatively lower. In addition, power losses rates are still high and management level still low. Therefore, the government
0 5 10 15 20 25 30 2 0 0 0 2 0 0 2 2 0 0 4 2 0 0 6 2 0 0 8 2 0 1 0 2 0 1 2 2 0 1 4 2 0 1 6 2 0 1 8 2 0 2 0 2 0 2 2 2 0 2 4 2 0 2 6 2 0 2 8 2 0 3 0 2 0 3 2 2 0 3 4 2 0 3 6 2 0 3 8 2 0 4 0 Billion U$ LOW BAS HIG EFF1 EFF2 EFF3 REN
17
cannot limit retail electricity prices, as presently, for maintaining affordable energy services in whole country.
4.2 Recommendations
(1) To meet increasing power demand while reduce the vulnerability of the power system, full potential of renewable resources, especially hydro, wind and solar should be exploited. The potentials should be investigated to determine location, scale and time to develop of renewable power plants/stations within the country. The government should promote advanced technology transfers from developed countries. Government’s financial incentive schemes are required to attract investments on renewable power development. (2) In the next three decades, because fossil based power output will continue to be dominant power generation in Vietnam, advanced energy conversion technologies should be applied in the power sector to improve the efficiency of fossil-based power plants. (3) Efficient and advanced power equipments should be adopted in electricity transmission, distribution and end use to reduce electricity demand and losses. Benchmarking programs on efficiency of power use should be implemented nationwide to define standards of power use and guide power users to apply the equipments.
(4) Applying pollutant abatement policies is necessary and it could lead to high penetration of advanced coal technologies with emission controllers, even with deployment of CO2 capture system
in the country. These could reduce both airborne emissions and external costs caused by coal-based power plants which have been accounting for large shares of total emission and external costs in Vietnam’s power system.
(5) Internalizing external costs in the power sector is necessary and it needs an adequate roadmap for adaptation of relevant stakeholders. Various methods and tools could be used: regulation of power utilities, tax and subsidy schemes, standards for emissions and damages in power generation sector, tradable permits, voluntary actions, etc.
18
References:
1. Institute of Strategy and Policy on Natural Resources and
Environment: Vietnam Assessment Report on Climate Change to United Nations Environment Programme, 2009
2. The State University of New York
http://www.globalization101.org/index.php?file=issue&pass1=s ubs&id=327, printed on 21.7.2009
3. Kato, N. and H. Akimoto (1992): Anthropogenic Emissions of
SO2 and NOx in Asia: Emissions Inventories (plus errata),
Atmos. Env. 26a: 2997-3017. 1992
4. Qingyu Zhang , Tian Weili, Wei Yumei, Chen Yingxu (2007):
External costs from electricity generation of China up to 2030 in energy and abatement scenarios, Energy Policy 35 (2007) 4295–4304
5. Kypreos S, Krakowski R. (2002): Introducing externalities in
the power generation sector of China. Int J Global Energy Issues 2004; 22(2–4): 131–54
6. The North American Electric Reliability Corporation: http://www.nerc.com/page.php?cid=4|331|333, printed 30.4.2010
7. United Nations Development Program: http://ncsp.undp.org/,
printed on 1.5.2010