Publisher’s version / Version de l'éditeur:
Vous avez des questions? Nous pouvons vous aider. Pour communiquer directement avec un auteur, consultez la première page de la revue dans laquelle son article a été publié afin de trouver ses coordonnées. Si vous n’arrivez pas à les repérer, communiquez avec nous à [email protected].
Questions? Contact the NRC Publications Archive team at
[email protected]. If you wish to email the authors directly, please see the first page of the publication for their contact information.
https://publications-cnrc.canada.ca/fra/droits
L’accès à ce site Web et l’utilisation de son contenu sont assujettis aux conditions présentées dans le site LISEZ CES CONDITIONS ATTENTIVEMENT AVANT D’UTILISER CE SITE WEB.
Laboratory Technical Report (National Research Council of Canada. Aerospace. Aerodynamics Laboratory); no. LTR-AL-2019-0024, 2019-03-29
READ THESE TERMS AND CONDITIONS CAREFULLY BEFORE USING THIS WEBSITE. https://nrc-publications.canada.ca/eng/copyright
NRC Publications Archive Record / Notice des Archives des publications du CNRC :
https://nrc-publications.canada.ca/eng/view/object/?id=6e28009c-c7c5-4ebd-b408-27604e35fef5 https://publications-cnrc.canada.ca/fra/voir/objet/?id=6e28009c-c7c5-4ebd-b408-27604e35fef5 For the publisher’s version, please access the DOI link below./ Pour consulter la version de l’éditeur, utilisez le lien DOI ci-dessous.
https://doi.org/10.4224/40001210
Access and use of this website and the material on it are subject to the Terms and Conditions set forth at Investigation of tolerance for icing of small UAV rotors/propellers Phase 1
Aerospace
Investigation of Tolerance for Icing
of Small UAV Rotors/Propellers
Phase 1
LTR-AL-2019-0024
Ali Benmeddour March 29, 2019
Classification: Unclassified NRC-CNRC
Distribution: Limited Page 2 of 27
AERODYNAMICS LABORATORY
Investigation of Tolerance for Icing of Small
UAV Rotors/Propellers – Phase 1
Volume 1
Report No.: LTR-AL-2019-0024 Date: March 29, 2019
Author: Ali Benmeddour
Classification : Unclassified Distribution: Limited
For: Enzo Diodati, Transport Canada – RPAS Task Force Engineering
SIGMA ID#: A1- 014440
Submitted by: Dr. Michael Benner, Director, Aerodynamics Laboratory
Approved by: Dr. Ibrahim Yimer, Director General, Aerospace Research Centre Pages : 27 Copy No : 0
Fig. : 20 Diagrams : 0
This report may not be published wholly or in part without the written consent of the National Research Council of Canada.
Classification: Unclassified NRC-CNRC
Distribution: Limited Page 3 of 27
EXECUTIVE SUMMARY
This report presents the achievements of Phase 1 of the NRC-Transport Canada (TC) collaboration on the experimental investigation (wind tunnel testing) of tolerance for icing of small-size propellers used to power small Unmanned Aerial Systems (sUAS). Since data on icing of these propellers at high rotation speeds (RPMs) are almost non-existent, the main objective of the current study is to characterize the icing of small propellers at high RMPs and provide TC with scientific data to support the development of a safe and commercially viable regulatory framework for UAS operations in Canada.
The report consists of three parts:
1. A literature review of the icing of small UAS propellers (for simplicity, the word propeller is used throughout the report to refer to both propellers in the case of fixed-wing UAS and rotors in the case of rotary-wing UAS).
2. A description of the RCbenchmark dynamometer (thrust stand) Series 1580 and the propeller models that have been acquired to conduct icing tests in the NRC Altitude Icing Wind Tunnel (AIWT). The thrust-stand/propeller test rig has been assembled and calibrated, and a number of preliminary shakedown static tests (wind off, outside the test section) have been performed to ensure proper functioning of the test apparatus. A sample of the static test results is included in the report along with a brief description of the NRC AIWT facility.
3. A work plan for Phase 2 of the NRC-TC R&D collaboration, which concerns the actual wind tunnel testing of various small size propellers with diameters ranging between 8” and 12”. Phase 2 will be executed during FY 19/20.
Classification: Unclassified NRC-CNRC
Distribution: Limited Page 4 of 27
TABLE OF CONTENTS
1 Introduction ...5
2 Icing of small UAS propellers – literature review ...7
3 Wind Tunnel Testing – Test Equipment ...20
3.1 Test Rig ... 20
3.2 UAS Propellers ... 21
3.3 Static Shakedown Tests ... 22
3.4 NRC Altitude Icing Wind Tunnel (AIWT) ... 23
4 Phase 2 Work Plan ...24
5 Concluding Remarks ...24
6 Acknowledgements ...24
Classification: Unclassified NRC-CNRC
Distribution: Limited Page 5 of 27
1 INTRODUCTION
With the drastic increase over the last two decades in the use of unmanned aerial systems (UAS), especially small ones (sUAS), for both commercial (e.g., aerial monitoring, delivery of packages, entertainment and recreation, research and development,…) and public “public good” (e.g., aerial surveillance, search and rescue, law enforcement, research and education,…) applications, there has been a tremendous demand for routine access of these vehicles to all classes of national airspaces, including civilian airspace [1].
Unmanned aerial systems typically operate at low to medium altitudes, and their integration into civilian airspace would present a potential risk to ground personnel and property. This risk would be more significant for sUAS since many of the applications being considered involve low altitude operations in and around urban areas. Given the potential hazard associated with the integration of UAS into the national airspace, a regulatory framework for both airworthiness and operations that balances safety with utility is required. To this end, Transport Canada has put in place a task force, the RPAS Task Force Engineering, whose mandate is to provide R&D data that support the development of a safe and commercially viable regulatory framework for UAS operations in Canada.
One of the major obstacles to safe operations of UAS in Canadian airspace is the dangerous hazard of icing that can be encountered during flight. Unmanned air systems, especially small ones, are more vulnerable to the risk of ice formation than conventional aircraft. This is mainly due to their lower flying altitudes, lower speeds and small excess power and payload margins. Propellers are the most vulnerable parts of these vehicles; their blades tend to collect ice more rapidly and their performance is quickly degraded with a considerable loss of thrust and abrupt increase of power consumption that could result in a catastrophic failure. There is a very limited data on icing and ice shapes for small UAS propellers and the impact of icing on their aerodynamic performance. Further research is needed to characterize icing of these propellers, improve understanding of the impact of icing on their performance and ultimately determine the critical icing conditions for the safe operation of small UAS in a northern climate.
To provide the required data on the icing of small UAS propellers, Transport Canada has collaborated with the National Research Council Canada (NRC) to conduct icing tests in its Altitude Icing Wind Tunnel (AIWT) to investigate the tolerance for icing of small UAS propellers, especially at high RPM. The main objectives of the collaboration are:
Develop a wind tunnel testing capability at NRC to study icing of small UAS propellers Conduct icing tests and provide experimental data to characterize icing of small propellers
Classification: Unclassified NRC-CNRC
Distribution: Limited Page 6 of 27
Investigate tolerance for icing of small UAS propellers and the feasibility of using a correlation between ice accretion and performance degradation as means of ice detection The NRC-TC collaboration is executed in two phases. During Phase 1 (FY 18/19), the following tasks were completed and are part of this report:
Conduct a review of the available literature on icing of small UAS propellers
Acquire the various parts of the test rig (dynamometer and propellers), set up and calibrate the test rig and conduct shakedown static tests to ensure proper functioning of the dynamometer/propeller assembly
Classification: Unclassified NRC-CNRC
Distribution: Limited Page 7 of 27
2 ICING OF SMALL UAS PROPELLERS – LITERATURE REVIEW
Propellers are the predominant type of propulsion used to power unmanned air systems, especially small UAS. Generally, these propellers have a small diameter and operate at low Reynolds numbers, low forward speeds, low tip speeds, and high RPMs [2]. They generally develop ice along their blades when operating in winter precipitation conditions. Icing of the blades reduces their lift and increases their drag, as shown in Figure 1. The centrifugal force of the rotating blades can theoretically act as a natural de-icing method. However, if the ice is not shed symmetrically, the uneven accretion causes vibration and imbalance in the propellers, which can lead to loss of the UAS.
Figure 1. Lift and drag coefficients on clean airfoil and airfoil with ice [3].
Over the last two decades, a considerable number of research studies, both experimental [4]-[10] and computational [11]-[14], have been conducted to improve the understanding of the low Reynolds aerodynamics of clean (no ice) UAS propellers and evaluate their performance. However and surprisingly, while icing of UAS has been an active area of research in recent years [15]-[24], studies on the icing of UAS propellers and its effects on their performance are very limited and very recent [25];[26], [28];[29] and [31]. Most of the icing studies for UAS have been for fixed-wing vehicles with emphasis on icing of the fixed-wings and tails. Below are summary reviews of the limited available literature on icing of UAS propellers. More details are available in the reviewed publications.
Using a scaled model of a three-bladed propeller typical of those found on modern UAS, Liu et al. [25] conducted a series of icing tests and studied the transient ice accretion process over the blade surfaces of the rotating model propeller. The tests were performed in the Iowa State University Icing Research Tunnel (ISU-IRC) under icing conditions ranging from rime to glaze ice. During the experiments, the air and the rotation speeds of the propeller were kept constant at 16 m/s and 3000 RPM, respectively. To cover both rime and glaze ice conditions, the ambient temperature
Classification: Unclassified NRC-CNRC
Distribution: Limited Page 8 of 27
was varied from T= -15° to -5° and the liquid water content (LWC) from LWC= 0.5 to 2.0 g/m3. The transient details of ice accretion over the rotating blades were resolved and captured using a “phase-locked” high-speed imaging technique. Simultaneous measurements of the dynamic aerodynamic loads acting on the propellers as well as the input power required to drive the propeller at a constant RPM were also taken during the ice accretion process.
The experimental investigation of Liu et al. provided a quantification of the dynamics of ice accretion on the leading edges of the blades as a function of time and space. It revealed that under moderate icing conditions (rime ice and glaze ice with low LWC), the ice layer formed around the blade leading-edge has a streamlined profile as shown in Figures 2a and b. However, an extended coverage on the inner blade section and a “needle-shape” ice formation at the tip of the blade were observed in the case of the glaze ice (Figure 2b). Under severe icing conditions (glaze ice with high LWC), a significant mass of ice accumulated around the blade tip, and the “needle-shape” ice feature developed into “lobster-tail-like” ice branches as depicted in Figure 2c.
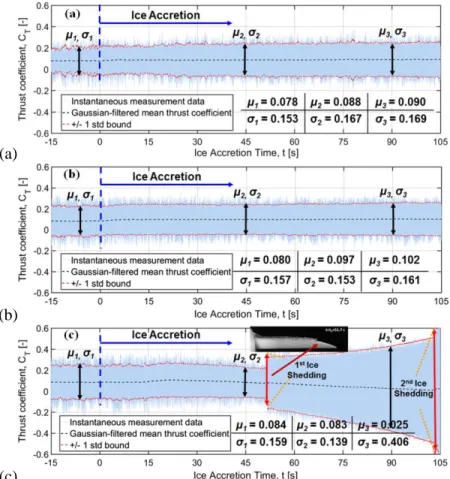
To assess the impact of icing of the blades on the propeller performance, the detailed ice accretion phases shown in Figure 2 were correlated with the dynamic aerodynamic load data and the input power response. The icing effects were analyzed based on the changes in the time history of the thrust coefficient (CT), shown in Figure 3, and the input power presented in Figure 4. With
streamlined ice shapes of the accumulated ice, moderate icing conditions induced only slight increases in the thrust coefficient as well as in the power input to keep the propeller at a constant rotational speed. At severe icing conditions, however, the features of the accreted ice dramatically contaminated the blade aerodynamic profiles, as indicated by the decrease of the thrust coefficient (Figure 3c) and the exponential increase of the power input (Figure 4).
The study also revealed that at severe icing conditions (glaze ice with high LWC), pieces of ice were shed from the blades because of the significant mass of ice that was accumulated at the tip. These ice shedding events increased the structural vibrations of the propeller, as indicated by the sudden divergence in the amplitude of the thrust coefficient fluctuations (Figure 3c).
In a follow-on work, Liu et al. [26] extended their study to investigate the effects of icing on the wake characteristics of the three-bladed model propeller to understand further the impacts of icing on the propeller performance and correlate them with the changes in the flow field.
Classification: Unclassified NRC-CNRC
Distribution: Limited Page 9 of 27
(a)
(b)
(c)
Figure 2. “Phase-locked” images of the ice accretion process on the rotating propeller blade, (a) rime ice, T= -15°, LWC = 1.0 g/m3, (b) glaze ice, T= -5°, LWC = 1.0 g/m3, (c)
Classification: Unclassified NRC-CNRC
Distribution: Limited Page 10 of 27
(a)
(b)
(c)
Figure 3. Time histories of the dynamic thrust coefficient, (a) rime ice, T= -15°, LWC = 1.0 g/m3, (b) glaze ice, T= -5°, LWC = 1.0 g/m3, (c) glaze ice, T= -5°, LWC = 2.0 g/m3.
99
Classification: Unclassified NRC-CNRC
Distribution: Limited Page 11 of 27
During flight tests with their Meteodrone (Figure 5), a small multi-rotor UAS, Meteomatics engineers, a weather service company [27] located in St. Gallen, Switzerland, experienced ice accumulations that had negative impact on the controllability of the vehicle. To understand the icing of the Meteodrone and consequently develop countermeasures or warning systems and reduce the icing hazard, Meteomatics, in collaboration with the Swiss Federal Office of Civil Aviation (FOCA), launched a project called SOPHIA (Study of Propeller Icing Hazard in Mini-UAV Aviation) [28] where they investigated the icing of UAS rotors. They examined ice accumulations on the rotor blades and the body of the aircraft during different icing conditions considering the EASA CS25/CS29 Appendix C guidelines. The study included flight tests, outdoors tests during winter, indoor tests in a ski slope and wind tunnel tests in the Vienna Climatic Wind Tunnel (VCWT).
Figure 5. Meteomatics Meteodrone UAS.
Two flight tests were conducted at night during forecasted icing conditions. The first flight test was performed with the Meteomatics Meteodrone SUI-9993 at a height of 565 m above ground level (AGL), where the air temperature was -2° and relative humidity was 100%. The second flight test was performed with the Meteomatics Meteodrone SUI-9990 at a height of 534 m above ground level (AGL), where the air temperature was -2.5° and relative humidity was 95%. During both flight tests, ice was formed on the rotors and the autopilot systems were not able to control the vehicles anymore. By measuring the rotary frequency, power expense and thrust of the rotors, the influence of icing on the rotor performance of the Meteodrones was determined. The flight tests revealed that icing caused an increase in the required power input as shown in Figure 6.
Classification: Unclassified NRC-CNRC
Distribution: Limited Page 12 of 27
Figure 6. Influence of icing on power input.
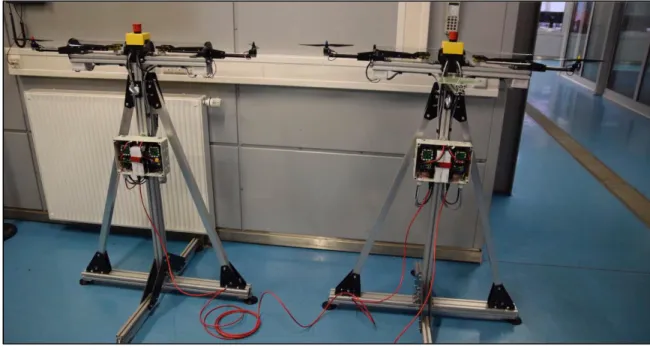
The icing wind tunnel tests were performed using two stands together with four parallel rotors. The two stands/rotors are presented in Figure 7. The rotors were tested in hover flight state only under six different icing conditions (two stratiform clouds and four cumuliform clouds) as summarized in Figure 8. The focus of the wind tunnel tests was on smaller LWCs since they are more common in real clouds.
Figure 7. VCWT test set up
Classification: Unclassified NRC-CNRC
Distribution: Limited Page 13 of 27
Figure 8. Icing conditions.
Measurements of the rotary frequency, power input and thrust of the rotors were used with photographs taken during testing to analyze the icing process and assess the icing impact on the rotors’ performance. The photographs showed that under severe glaze ice conditions, complex “lobster-tail-like” ice branches developed around the tips of the blades. These ice features are shown in Figure 9 and are similar to what was reported in the study of Liu et al. [25].
In a correlation between the amount of accreted ice and measured thrust, which is shown in Figure 10, the study showed that as the amount of ice increased, the thrust decreased. When examining the relationship between the measured rotational speed (RPM) of the rotors and the electric current feed to the motors, it was found that, considering the amount of accumulated ice, the RPM-current correlation allowed the determination of the region of operation where although ice was present on the blades, enough thrust was still provided by the rotors.
Classification: Unclassified NRC-CNRC
Distribution: Limited Page 14 of 27
Figure 10. Thrust .vs. ice amount
Figure 11. RPM – current correlation.
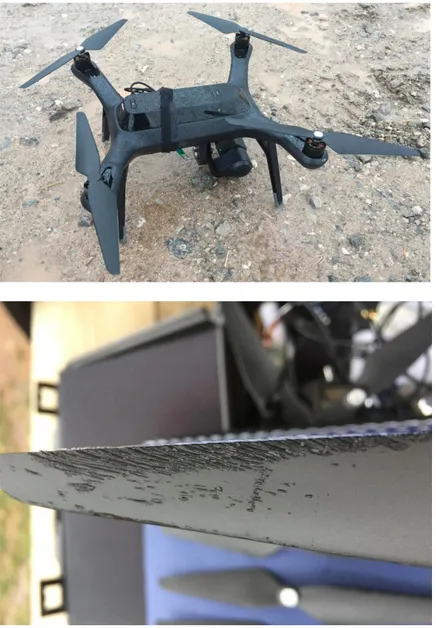
In a recent evaluation of low altitude icing conditions for small unmanned aircraft, Avery et al. [29] reported that minor icing was encountered on a routine atmospheric sounding with a 3D Solo small quadcopter UAS shown in Figure 12. The airframe was estimated to have been in icing
Classification: Unclassified NRC-CNRC
Distribution: Limited Page 15 of 27
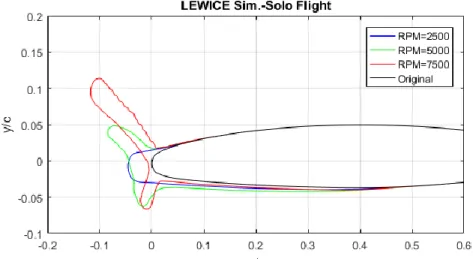
conditions for approximately 4 minutes. A close-up of the ice on the rotor blade is also shown in Figure 12. To investigate the icing occurrence on the rotor blade, an attempt was made to mimic the occurrence using the NASA ice accretion computational simulation software LEWICE [30]. Since the parameters of the ice accretion were not measured, the LEWICE simulations were based on estimated conditions. The results of the simulations obtained by Avery et al. are shown in Figure 13. A distinct horn structure was predicted by LEWICE, which was not seen on the actual rotor blade. Only aggregated data were used to validate the computational predictions because of the unknown exact icing parameters.
Classification: Unclassified NRC-CNRC
Distribution: Limited Page 16 of 27
Figure 13. LEWICE ice accretion predictions for the Solo rotor blade.
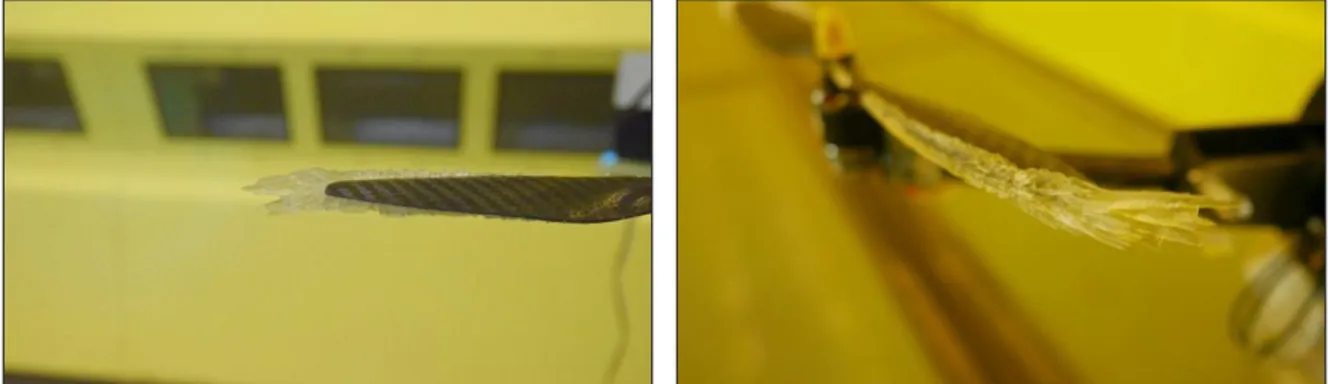
In a recent study on icing of multi-copter small UAS, Yan et al. [31] used a co-axial rotor configuration and the commercial UAS, DJI Mavic Pro, to conduct experimental studies. The co-axial rotor configuration consisted of 4 co-co-axial rotor pairs and was tested in the Pennsylvania State University (PSU) icing wind tunnel (IWT). The DJI Mavic Pro UAS was tested in the PSU Adverse Environment Rotor Test Stand (AERTS) facility, which is built in an industrial cooling chamber. Figure 14 shows the co-axial rotor configuration and the DJI vehicle mounted on a rotor blade of the AERTS.
The co-axial rotor configuration was tested in both forward and hover states at -10°, varying air speed (0, 5 m/s), tilt angle (0, 10°) and LWC (1g/m3 to 2.5 g/m3) for a water droplet size of 40 µm. The tests were performed at either constant RPM (2000 or 3000) or constant thrust (20 or 30 N). A degradation in thrust and power was observed due to ice accretion. The ice formation on the rotor blades increased power consumption and decreased thrust as shown in Figure 15. The study showed that the power consumption increase and the thrust decrease can be modeled as a linear function with respect to icing time. It also indicated that a small decrement in thrust due to icing can significantly impair the power performance and flight endurance. Thus, when a UAS encounters icing conditions, power variations will likely be a major concern.
Only one icing flight test was performed with the DJI Mavic Pro as exposure to an icing cloud (droplet size 20 µm, LWC=1.5 g/m3, ambient temperature -12°) for 30 s damaged one of the motors. It was found that although the rotor blades of the DJI aircraft were collecting ice at a higher rate than those of the co-axial rotor configuration and a significant amount of ice accumulated on them, the DJI Mavic Pro rotors did not suffer any ice shed events as was observed during icing of the co-axial rotors. Figure 16 shows the amount of ice accreted on the rotor blades of the two configurations. The study revealed that the material of the blades plays an important role in the
Classification: Unclassified NRC-CNRC
Distribution: Limited Page 17 of 27
icing process, especially ice shedding. The rotors of the co-axial rotor configuration were equipped with carbon fiber blades while the DJI Mavic Pro blades were plastic with a matt finish. Fiber carbon blades have a smooth finish and a lower adhesion strength than plastic blades.
Classification: Unclassified NRC-CNRC
Distribution: Limited Page 18 of 27
Classification: Unclassified NRC-CNRC
Distribution: Limited Page 19 of 27
(a)
(b)
Classification: Unclassified NRC-CNRC
Distribution: Limited Page 20 of 27
3 WIND TUNNEL TESTING – TEST EQUIPMENT
Part of Phase 1 of the NRC-Transport Canada collaboration is to acquire all the necessary parts and build a test rig that will be used to conduct the icing tests planned for Phase 2 of the project. Phase 2 will be completed in FY 19/20 and the tests will be performed in the AIWT.
3.1 Test Rig
The test rig consists of a RCbenchmark Series 1580 Dynamometer, a Turnigy 2834-800 brushless DC electric motor, a Hobbyking 50A Electronic Speed Controller (ESC) and a 4s Lipo (14.8v DC) power supply. The RCbenchmark Series 1580 Dynamometer is shown in Figure 17 and its design specifications are provided in Table 1. The dynamometer directly measures torque, thrust, voltage, current, RPM, motor winding resistance, and accelerations due to vibrations. For static tests outside the wind tunnel test section, a safety cage was required.
Classification: Unclassified NRC-CNRC
Distribution: Limited Page 21 of 27
Table 1 RCbenchmark Series 1580 Dynamometer design specifications
Specification Min. Max. Tolerance Unit
Thrust -5 5 0.5% kgf
Torque -1.5 1.5 0.5% Nm
Voltage 0 35 0.5% V
Current 0 40 1% A
Angular speed* 0 190k 1 eRPM
Coil resistance 0.003 240 0.5% Ohm
Digital scale 0 3 0.5% kgf
*Electrical RPM, divide by the number of motor poles to obtain true mechanical RPM.
3.2 UAS Propellers
A set of Master Airscrew and APC propellers were acquired for wind tunnel testing. Samples of these propellers are shown in Figure 18. The propeller diameters range from 8” to 14” and the propeller pitches range between 4.5” and 6”. Both MA and APC propellers are made of glass fiber-reinforced composite material.
Classification: Unclassified NRC-CNRC
Distribution: Limited Page 22 of 27
3.3 Static Shakedown Tests
After set up and calibration of the test rig, a number of shakedown static tests were conducted to fix any issues with the system and ensure all the parts were working properly and providing accurate measurements. The shakedown tests were performed using a MA multi-rotor propeller with a 12” diameter and a propeller pitch of 4.5” (MA MR 12”x4.5”). Successful measurements of the thrust and torque of the tested propeller, as functions of the RPM, were obtained and are shown in Figure 19.
Classification: Unclassified NRC-CNRC
Distribution: Limited Page 23 of 27
3.4 NRC Altitude Icing Wind Tunnel (AIWT)
A schematic of the NRC AIWT is depicted in Figure 20. It is a refrigerated closed-loop low-speed facility oriented in the vertical plane. Being refrigerated, this facility can be used any time of the year to conduct icing tests in accordance with the FAA Appendix C conditions.
The standard test section in the AIWT is 0.57 m × 0.57 m × 1.83 m (width × height × length), and has controlled airspeeds from 5 to 100 m/s. An insert can reduce the test section width to 0.52 m and height to 0.33 m to achieve airspeeds up to 180 m/s. The tunnel airspeed is calculated through the use of total temperature and total pressure sensors located upstream of the spray bars in the settling chamber, as well as a ring of static pressure ports located upstream of the AIWT test section.
The air temperature in the AIWT is controlled by varying the amount of the refrigerant passing through a heat exchanger located in the tunnel circuit; achievable static air temperatures (SAT) at Mach 0.3 range from -40˚C to +30˚C. A vacuum pump can be used to evacuate air from the wind tunnel circuit, lowering the pressure and creating simulated flight altitudes up to 12,200 m (40,000 ft). More technical details on the NRC icing facility can be found in [32].
Classification: Unclassified NRC-CNRC
Distribution: Limited Page 24 of 27
4 PHASE 2 WORK PLAN
Phase 2 of the NRC-TC collaboration concerns the actual wind tunnel testing of the UAS propellers in the NRC AIWT facility. Phase 2 will be executed in FY 2019/2020 and includes the following activities:
Calibrate and adapt the test rig for testing in the NRC AIWT facility
Conduct targeted rime and glaze ice (from Appendix C) tests in the NRC AIWT facility to characterize icing of small UAS propellers of different diameters (i.e., 8”, 10” and 12”) at high RPM
Assess tolerance for icing of tested small UAS propellers at high RPM using icing data obtained in the NRC AIWT
Correlate variations of RPM and electric current with ice build-up to determine the feasibility of using a correlation between the ice accretion and the performance degradation as a means of ice detection
Establish a baseline database of icing data for icing of small UAS propellers at high RPM
5 CONCLUDING REMARKS
Two main objectives were achieved related to Phase 1 of the NRC-Transport Canada collaborative study on the tolerance of small unmanned aerial systems’ propellers at high rotational speeds to icing contamination. The first objective was to conduct and summarize a review of the available literature on the icing of small UAS propellers. Surprisingly, although icing of UAS has been an active area of research the last decade, research studies on icing of UAS propellers were found to be very limited and most of them concerned propulsion systems of rotary-wing multi-rotor aircraft. The second objective was to acquire all the necessary parts to build a test rig to conduct actual icing tests in the NRC Altitude Icing Wind Tunnel, which is part of the follow-on Phase 2 of this collaboration. A dynamometer, a power supply, four brushless electric motors, an electronic speed controller and a set of propellers with different diameters have been acquired. A test rig was set up and a number of preliminary static shakedown tests were performed, confirming that the test rig is working as expected.
6 ACKNOWLEDGEMENTS
The present work was funded by Transport Canada, RPAS Task Force Engineering.
Classification: Unclassified NRC-CNRC
Distribution: Limited Page 25 of 27
1. Logan M.J., Bland G. and Murry J. “A Framework for Safe Integration of Small UAS into the NAS”, AIAA Paper 2011-6939, 11th AIAA Aviation Technology, Integration, and Operations
(ATIO) Conference, 20-22 September 2011, Virginia Beach, VA, USA.
2. Venkatesh B.J. “Design and Performance Evaluation of a Propeller”, LAP LAMBERT Academic Publishing GmbH & Co. KG: Saarbrüken, Germany, 2012.
3. Instrument Flying Handbook, FAA-H-8083-15B, 2012.
4. Corrigan E.K. and Altman A. “Survey of Small Aerial Vehicle Electric Propulsion Systems”, AIAA Paper 2008-179, 46th AIAA Aerospace Sciences Meeting and Exhibit, 7-10 January 2008, Reno, NV, USA.
5. Gamble D. E. and Arena A. “Automatic Dynamic Propeller Testing at Low Reynolds Numbers”, AIAA Paper 2010-853, 48th AIAA Aerospace Sciences Meeting and Exhibit, 4-7
January 2010, Orlando, FL, USA.
6. Brandt J.B. and Selig M.S. “Propeller Performance Data at Low Reynolds Numbers”, AIAA Paper 2011-1255, 49th AIAA Aerospace Sciences Meeting and Exhibit, 4-7 January 2011, Orlando, FL, USA.
7. De Oliveira L.F.Q. and Cerόn-Muñoz H.D. “Aerodynamic Analysis of High Rotation and Low Reynolds Number Propeller”, AIAA Paper 2012-3838, 498h AIAA/ASME/SAE/ASEE Joint
Propulsion Conference and Exhibit, 30 July – 30 August, Atlanta, GA, USA.
8. Deters R.W., Ananda G.K. and Selig M.S. “Slipstream Measurements of Small Scale Propellers at Low Reynolds Numbers”, AIAA Paper 2015-2265, AIAA Aviation, 33rd AIAA
Applied Aerodynamics Conference, 22-26 June 2015, Dallas, TX, USA.
9. Verstraete D. and Gong A. “Development of a Dynamic Propulsion Model for Electric UASs”, 7th Asia-Pacific International Symposium on Aerospace Technology, 25-27 November 2015, Cairns, Australia.
10. Gong A., MacNeill R. and Verstraete D. “Performance Testing and Modeling of a Brushless DC Motor, Electronic Speed Controller and Propeller for a Small UAV”, AIAA Paper 2018-4584, AIAA Propulsion and Energy Forum, 2018 Joint Propulsion Conference, 9-11 July 2018, Cincinnati, OH, USA.
11. Westmoreland W.S., Tramel R.W. and Barber J. “Modeling Propeller Flow-Field Using CFD”, AIAA Paper 2008-402, 46th AIAA Aerospace Sciences Meeting and Exhibit, 7-10 January 2008, Reno, NV, USA.
12. MacNeill R. and Verstraete D. “Blade Element Momentum Theory Extended to Model Low Reynolds Number Propeller Performance”, 20th Australian Fluid Mechanics Conference, 5-8
December 2016, Perth, Australia.
13. Kutty H.A. and Rajendran P. “3D CFD Simulation and Experimental Validation of Small APC Slow Flyer Propeller Blade”, MDPI Aerospace Journal, Vol. 4, No. 10, February 2017. 14. Molter C. and Cheng P.W. “Propeller Performance Calculation for Multicopter Aircraft at
Classification: Unclassified NRC-CNRC
Distribution: Limited Page 26 of 27
Micro Air Vehicle Conference and Flight Competition (IMAV), 18-21 September 2017, Toulouse, France.
15. Koenig G.G. Ryerson C.C. and Kmiec R. “UAV Icing Flight Simulation”, AIAA Paper 2002-0812, 40th AIAA Aerospace Sciences Meeting and Exhibit, 14-17 January 2002, Reno, NV, USA.
16. Tran P., Baruzzi G., Tremblay F., Benquet P., Habashi W.G., Peterson P.B., Liguett M.W. and Fiorucci S “FENSAP-ICE Applications to Unmanned Aerial Vehicles (UAV)”, AIAA Paper 2004-402, 42nd AIAA Aerospace Sciences Meeting and Exhibit, 5-8 January 2004, Reno, NV, USA.
17. Chang R.C., Ye C.-E. and Shyu L.-S. “The Situational Awareness of In-Flight Icing for Unmanned Aerial Vehicles”, Journal of China Institute of Technology, Vol. 38, No. 12, 2008. 18. Szilder K. and McIlwain S. “In-Flight Icing of UAVs – The Influence of Flight Speed Coupled with Chord Size”, Canadian Aeronautical and Space journal, Vol. 28, No. 2, pp. 83-94, July 2012.
19. Szilder K. and Yuan W. “The Influence of Ice Accretion on the Aerodynamic Performance of a UAS Airfoil”, AIAA Paper 2015-0536, AIAA SciTech Forum, 5-9 January 2015, Kissimmee, FL, USA.
20. Lucas A., Whidborne J. and Armanini S. “The Challenge – UAS Operations in Known Icing Conditions”, AAUS 2015 Conference, February 2015, Melbourne, Australia.
21. Szilder K. and Yuan W. “In-Flight Icing on Unmanned Aerial Vehicles and its Aerodynamic Penalties”, Progress in Flight Physics, Vol. 9, pp. 173-188, 2017.
22. Williams N., Benmeddour A., Brian G. and Ol M. “The Effect of Icing on Small Unmanned Aircraft Low Reynolds Number Airfoil”, 17th Australian Aerospace Congress, 26-28 February
2017, Melbourne, Australia.
23. Hann R., Wenz A., Gryte K. and Johansen T.A. “Impact of Atmospheric Icing on UAV Aerodynamic Performance”, 2017 Workshop on Research, Education and Development of Unmanned Aerial Systems (RED-UAS), 3-5 October 2017, Linköping, Sweden.
24. Hann R. “UAV Icing: Comparison of LEWICE and FENSAP-ICE for Ice Accretion and Performance Degradation”, AIAA Paper 2018-2861, AIAA Aviation Forum, 25-29 June 2018, Atlanta, GA, USA.
25. Liu Y., Li L., Ning Z. Tian W. and Hu H. “An Experimental Study on the Ice Accretion Process over the Blade Surface of a Rotating UAS Propeller”, AIAA Paper 2017-0727, AIAA SciTech Forum, 9-13 January 2017, Grapevine, TX, USA.
26. Liu Y., Li L., Hu H. and Chen W. “Effects of Ice Accretion on the Aerodynamic Performance and Wake Characteristics of an UAS Propeller Model”, AIAA Paper 2018-3496, AIAA Aviation Forum, 25-29 June 2018, Atlanta, GA, USA.
Classification: Unclassified NRC-CNRC
Distribution: Limited Page 27 of 27
28. “Study of Propeller Icing Hazard in Mini-UAV Aviation”, Project “SOPHIA” – Final Report, Meteomatics GmbH, St. Gallen, Germany, May 2017.
29. Avery A.S. and Jacob J.D. “Evaluation of Low Altitude Icing Conditions for Small Unmanned Aircraft”, AIAA Paper 2017-3929, AIAA Aviation Forum, 5-9 June 2017, Denver, CO, USA. 30. Wright W.B. “User Manual for the NASA Glenn Ice Accretion Code LEWICE, Version 2.2.2”,
NASA/CR-2002-211793, August 2002.
31. Yan S., Opazo T., Palacios J., Langelaan J.W. and Germain L.-D. “Experimental Evaluation of Multi-Rotor UAV Operation under Icing Conditions”, AHS International 27th Annual Forum & Technology Display, 14-17 May 2018, Phoenix, AZ, USA.
32. Clark C. “Effects of Wind Tunnel Aerodynamic Blockage on Stagnation Collection Efficiency in an Icing Environment”, AIAA Paper 2018-3832, AIAA Aviation Forum, 2018 Atmospheric and Space Environments Conference, 25-29 June 2018, Atlanta, GA, USA.
![Figure 1. Lift and drag coefficients on clean airfoil and airfoil with ice [3].](https://thumb-eu.123doks.com/thumbv2/123doknet/14017260.457046/8.918.190.722.386.630/figure-lift-drag-coefficients-clean-airfoil-airfoil-ice.webp)