An Analysis of Alternative Fuels Promotion:
The Case of Synthetic Gasoline Production in New Zealand by
Takeshi Sugiyama
M. Eng., Science and Engineering (Materials Science) University of Tsukuba, Japan 1989
Submitted to the Department of Materials Science and Engineering in Partial Fulfillment of the Requirements for the Degree of
Master of Science in Technology and Policy at the
Massachusetts Institute of Technology May 1994
C 1994 Takeshi Sugiyama. All rights reserved.
The author hereby grants to MIT permission to reproduce and to distribute publicly paper and electronic copies of this thesis document in whole or in part.
Sianature of Author . . . .. . . . .
Department of Materials,§Cience and Engineering
May 6 1994
Certified by . . . . . . . . . . . .
A. Dennv Ellerman
Executive Director, enter for Energy and Environmental Policy Research
f Thesis Advisor Certified by Certified by Accepted by Accepted by . . . .. .
...
Michael C. Lynch, Cnter for Inte Studfcs
Thesis Advisor \. . ... . . . . ... . . . . Joel P. Clark, Professor of Materials Systems
Thesis Reader
. . . .
RiLd de Neufville, Professor of Civil ah Environmental Engineering Chair, Technology and Policy Program . . . .. I . . . . Carl V. Thompson II, Professor of Electronic Materials Chair, Departmental Committee on Graduate Students
An Analysis of Alternative Fuels Promotion:
The Case of Synthetic Gasoline Production in New Zealand
by
Takeshi Sugiyama
Submitted to the Department of Materials Science and Engineering on May 6 1994 in partial fulfillment of the requirements for the Degree of
Master of Science in Technology and Policy
ABSTRACT
During the 1980s, many nations attempted to promote alternative fuels because of energy security concerns incited by the oil crises in the 1970s. Countries which had substantial technical and financial capability promoted synthetic fuels derived from non-oil fossil resources to replace crude non-oil in conventional energy systems. However, with the decline of world oil prices after the mid-1980s, most synthetic fuel projects became infeasible and were either terminated or canceled. Returns from such huge investments were minimal, if any. Consequently, the promotion of synthetic fuels in the 980 is perceived as a failure today. New Zealand also promoted synthetic gasoline during the 1980s in order to reduce its dependence on imported oil. The synthetic gasoline process, among other synthetic fuel processes, was known to be technically and economically feasible. The process proved to be a technical success after its start-up in 1985 as it supplied one-third of gasoline needs in the country. Although still in operation today, the process has been uneconomical because oil prices remained low since 1986.
This research focuses on the general approaches the New Zealand government used to promote alternative liquid fuels derived from indigenous natural gas resources as substitutes for imported crude oil and oil products. Other alternative fuels that were considered by the government included CNG, LPG and methanol. The research also evaluates technology, policy and management aspects of the alternative fuels promotion. Based on the evaluation, the snthetic gasoline process possessed the designed economic performance standards. Hence, the main cause of the unsuccessful outcome was the misjudgment in economic planning. The results of the sensitivity analysis show that the same goals could be economically achieved by other means in theory. Therefore, the synthetic gasoline might not be the optimal solution to the nation's energy security concerns. The policy and management issues involved in the promotion also largely influenced the success of each alternative fuel program. The overall results of the research have implications for alternative fuels promotion in the future.
Thesis Advisor: A. Dennv Ellennan
Title: Executive Director. Center for Energy and Envirorumental Policy Research
Thesis Advisor: Michael C. vnch
Title: Center for International Studies
ACKNOWLEDGMIENT
First, I would like to thankfaculty and staff of the Technology and Policy Program for the ftuifful two years I have had since entering the program. Equally, Dr. Denny
Ellermanfor accepting an advisor role for my thesis and giving me constant advice and support throughout my research, Prof. Joel Clark for being a thesis reader, and the Department ofMaterials Science and Engineeringfor their assistance.
I would especially like to thank Mr. Michael L vnch for being my thesis advisor for nearly a year and providing me a lot of opportunities to broaden my scope into energy economics and policy fields. A so, Mr. Charles Piec.ulewski and Mr. Edmund Chen for helping me correct my English grammar, and Mr. Yoshihiko Hashimoto for giving me some ideas and informationfor my thesisftom Holland.
Lastly, I would like to thank my employer, Showa Shell Sekiyu K.K., for their support throughout my years at MIT, and my parents and parents in law for their everlasting encouragement. I would like to dedicate this thesis, to my wife, Hroe, for helping me accomplish my goals and supporting me all the time.
TABLE OF CONTENTS
Page
ABSTRACT 2
ACKNOWLEDGMENT 3
TABLE OF CONTENTS 4
1. INTRODUCTION SYNTHETIC FUELS AS ALTERNATIVE FUELS 6
1. 1. Emergence of Synthetic Fuel Projects 6
1. 1. 1. The oil crises and synthetic fuels 1 12. History of synthetic fuels production 1 13. The turning point
1.2. Future of Synthetic Fuels Promotion - Thesis Theme 10
2. ENERGY SCENES IN NEW ZEALAND 12
2. 1. After the Oil Crises 12
2. 1. 1. New Zealand's energy resources 2.1.2. Energy scenes
2.1.3. Energy policy
2.1.4. Decision on synthetic gasoline
2.2. Synthetic Gasoline Project 17
2.2. 1. Planning and construction 2.2.2. After the start-up
2.3. The 1980s and Now 20
3. SYNTHETIC GASOLINE PRODUCTION 23
3. 1. Natural Gas-To-Gasoline Process 23
3. 1. 1. Process
3.1.2. Infrastructure 3.1.3. Technical feasibility
3.1-4. The M[TG process among other synthetic fuel processes
3.2. Product 28
3.3. Project Costs 29
3,3. 1. Production costs 33.2. Investment costs
3.4. The Production Today 32
4. ALTERNATE CHOICES 35
4. 1. Liquid Fuels Promotion 35
4, 1. 1. Goals and the programs 4,1.2. Liquid fuel programs
4.1.4. Energy conservation programs
4.2. Government's Choices 41
4.2. 1. CNG (Compressed Natural Gas) 4.2.2. LPG (Liquefied Petroleum Gas)
4.2.3. Methanol and gasohol
4.3, Economic Feature of the Promotion 43
4.4. In the Long Term 44
5. ANALYSIS - NEW ZEALAND'S ALTERNATIVE FUELS PROMOTION 46
5. 1. Reviewing the Liquid Fuel Programs 46
5. 1. 1. Goals and the achievements
5.1.2. Economic aspects - sensitivity analysis (1)
5.1.3. Same achievement without synthetic gasoline - sensitivity analysis 2)
5.1.4. Technology issues involved in the decision-makings
5.2. Policy and Management 54
5.2. 1. Mismanagement in economic planning 5.2.2. Effect of the government policy
5.3. Synthetic Gasoline for the Future 57
5.3. 1. The policy required
5.3.2. Necessity - the production today 5.3.3. The role of the synthetic gasoline
6. CONCLUSIONS 63
6.1 Lessons from Synthetic Gasoline Promotion 63
6. 1. 1. True market value of oil 6.1.2. Replacement of oil by oil
6.1.3. Energy promotion and deregulation 6.1.4. Energy security
6.2. Conclusion 65
APPENDICES 67
Appendix 1. Sensitivity Analysis (1) 67
A. 1. 1. Notes
A. 12. Analyzed data
Appendix 2 Sensitivity Analysis 2) 68
A. 2. 1. Notes
A.2.2. Analyzed data
Year
Figure I - . Arabian Light/Dubai Spot Crude Prices
Source: BP Statistical Review of World Ener June 1993
1. INTRODUCTION SYNTHETIC FUELS AS ALTERNATIVE FUELS
1.1. Emergence of Synthetic Fuel Proiects
1. 1. 1. The oil crises and synthetic fuels
The oil crises in the 1970s alarmed many oil importing countries about their energy and national security. Oil prices escalated from $3/barrel in 1972 to $30/barrel by the late 1970s, and peaked at $36/barrel in late 1980 as seen
in Figure 1-1. Oil was no longer a cheap and accessible energy supply as once
thought. As a result, nations began searching for the alternatives to crude oil. On the basis of their domestic energy resources, each nation proposed a strategy to remedy this perceived problem, but, not too surprisingly, they came up with similar strategies - to synthesize fuels oil from alternative fuel resources. This outcome was a direct consequence of the permeation of oil used throughout the world.
US$/bbI An -- --30 20 10 I I I 1970 n L 1975 1980 1985 1990 1995
Many synthetic fuel projects were pursued during the period between the late 1970s and the early 1980s. They were particularly significant in the United States and Canada. With substantial coal and other non-oil fossil reserves, financial resources and technical capabilities, these countries had a strong potential for developing synthetic fuels. Also, many other nations in the world attempted to promote synthetic fuel projects, and some industrialized
countries like Japan and West Germany began to develop their technologies to
enter a future competition of the synthetic fuels industry.
In most cases, synthetic fuel projects were conducted under the administration of governments. These projects required anywhere from hundred million to a few billion dollars in start-up, and the pvate energy industries were not willing to take the risk alone to invest heavily in unproved technologies into the uncertainties of the market without government support.
However, the promotion of synthetic fuels continued to be enhanced
because of the world wide anticipation that oil prices would continue to rise in the future. Many oil economists predicted that the oil prices would be
$40-55/barrel by the mid- 1980s and continue upwards afterwards. In addition, the possibility of oil scarcity in the near future, which was widely believed at the time, supported the movement. With the hope for future technology improvement, the economics of synthetic fuels production were regarded less important, especially when national energy security was at stake.
1 12. History of synthetic fuels production (IPE, 19801)
The concept of producing man-made oil as alternative fuels is not a new
occurred, humans have been using various kinds of synthetic fuels.
Experiments with synthetic fuels began more than 200 years ago, before the
discovery of flowing oil and gas deposits. Oil was refined from shale in England
in the late 1600s. By the late 1700s, paraffin wax, ammonia and varnish were produced from shale all over Europe. In the 1800s, vegetable and animal fat were replaced by shale oil for heating. In the United States, shale oil replaced whale oil in the 1850s, and lasted until Pennsylvania oil discoveries provided cheap and abundant kerosene in the 1880s.
In the early 1900s, coal conversion began in Germany, who had
abundant coal resources but little petroleum. Coal was liquefied by
hydrogenation under high-pressure by the Bergius process. In 1923, Franz Fischer and Han Tropsch produced an oily liquid from a gas mixture, carbon monoxide and hydrogen, from coal. The process, called Fischer-Tropsch process today, was a noteworthy innovation, and has been the foundation of
gas liquefaction ever since.
Commercial-scale coal liquefaction plants were first built for political and strategic purposes before and during World War II, and later by South Aftica as energy security against economic sanctions. South Africa has been producing liquid fuels using the Lurgi process to make gas from coal and the Fischer-`Iropsch method to convert gas since 1957. In the United States, there was an early attempt to develop a methanol-to-gasoline venture by the private sector in Texas in the 1950s. At that time, the U.S. Bureau of Mines
suggested synthetic coal fuels as the solution during times petroleum shortage.
However, during the 1960s, this history of synthetic fuels seemed to be interrupted by the outgrowth of cheap and abundant oil and its products. Almost nothing was done during this period in the United States compared to
the 1950s. The U.S. government maintained coal research only on a virtual
starvation diet of about $ 10 million per year until the early 1970s. (Rose, 1986) Synthetic fuels development was stagnant until the fuels were brought back into the spotlight by the oil cses.
1. 1.3. The turning point
Synthetic fuels became promising fuels for the future around 1980. Many energy industries' journals and magazines frequently reported the progress of synthetic fuels as their feature stories in the early 1980s. At that time, establishing synthetic fuels production and its industry was the key to the energy security of the nations which were imported-oil dependent.
However, by the mid-1980s, the synthetic fuels enthusiasm was lost since oil prices did not rise as expected. The difference between real and
expected prices began to increase as described in Figure 1-2. Investors began
to think that they would not be paid back for their massive investment in the synthetic fuel projects, and canceled many projects which were in progress. In
1982 alone, more than 800,000 barrels/day of oil equivalent in coal gasification
projects slid from design engineering or planning stages into cancellation or
deferral. Ninety percent of all projects firmly planned were canceled or delayed
indefinitely. (OGJ, 1983b) Correspondingly, the plants already in operation were
US$/bbl !A)
80 -
0
70 O/ 60 - e A - Actual O', "W, - - I-mFli3jeefion 50 -e Ix
I
- -A - Mickfle Al -- - fligh 140 30 -2or
in I I I I 1975 1980 1985 1990 1995 YearFigure 12. World Oil Prices Projections, 1982-1990
Source: Energy Information Administration, 1982 Annual Energy Outlook.
DOE/EIA-0383(82), (Washington, D.C., 1982)
Then, finally the oil-coRapse in 1986, as in Figure 1-1, entirely eliminated
the remaining synthetic fuels fervor. Many more synthetic fuel projects were terminated. Many plants in operation became subject to closure. The oil industries in the world returned to their core business, oil refining and marketing, once cheap and accessible crude oil was again available to
consumers. While there are still a few synthetic fuel facilities operating and projects being undertaken today, the words "synthetic fuels" seems to have
disappeared from today's energy scene.
1.2. Future of Synthetic Fuels Promotion - Thesis Theme
Once oil prices fell, most synthetic fuels enthusiasm disappeared and the projects were either canceled or scrapped. The billion dollar investments
around the world were therefore wasted. Many energy analysts see the synthetic fuels promotion in the 1980s as a failure. This is certainly true for
those synthetic fuel projects which failed to operate and made no contribution to the energy sector they belong to. However, questions remain:
- hat caused the failure of synthetic fuels promotion?
- Was the unexpected decline in oil prices the only problem?
- Were the synthetic fuel processes not feasible?
In order to look into these disputes, this research analyzes the
promotion of alternative fuels including synthetic fuels. Alternative fuels could be defined in broader terms compared to synthetic fuels, as some of them, for
example natural gas, traditionally exist and are being used for other purposes. New Zealand's liquid fuels promotion is chosen for this research because the program promoted a synthetic gasoline project which proved to be technically and economically feasible. Unproved synthetic fuels processes are not suitable for this study. The synthetic gasoline project in New Zealand also produces large enough volumes that it can supply one-third of gasoline needs in the country, and, most importantly, is still in production today.
This paper will discuss promotion of synthetic gasoline as part of the
national liquid fuels promotion by the New Zealand government. The focus is
more on the overall approaches taken by the alternative fuels promoter, New Zealand government in this case, than technology and economics aspects of the synthetic gasoline production. The paper includes suggestions for future
2. 1. After the Oil Crises
2.1. 1. New Zealand's energy resources
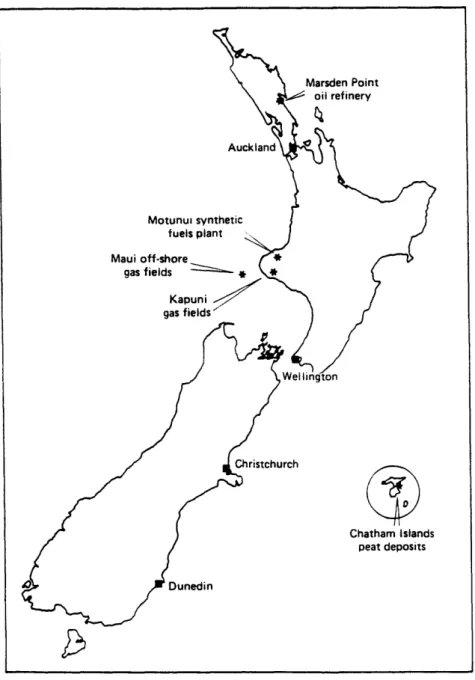
New Zealand's indigenous primary energy resources are coal, natural gas condensate, hydro power, geothermal water and a little uranium. Although the country had been searching for commercial oil deposits for a nearly century, no deposits could be found until 1980. The country, instead, has plenty of gas in the Kapuni and Maui reserves.
The Kapuni gas reserves were discovered in 1959 at the offshore of
Taranaki. They were estimated to be about 600 billion ft3 of gas and
condensate in the early 1970s. The Maui gas/condensate field was discovered
in 1969 by Shell, BP and Todd. The reserves were estimated to be approximately 56 trillion ft3, and were one of the 25 largest natural gas reservoirs in the world. From these domestic gas reserves, New Zealand had
production of 150 million ft3/day of gas and 15,000 barrels/day of condensate in
1978. UEA, 1980) Figure 21 shows the locations of the Maui and Kapuni reserves.
2.1.2. Energy scenes
The country is rich in hydroelectric power because lakes offer natural reservoirs for hydroelectric power. From the early 1920s, the development of
state-owned hydroelectricity was conducted, and by 1930, the sale of cheap 2. ENERGY SCENES IN NEW ZEALAND
Marsden Point : oil refinery Motunui synthetic fuels pant Maui gas Chatham Islands peat deposits Dunedin
Figure 2- 1. New Zealand energy developments
Source: (Lonergan, 1990)
domestic electricity was subsidized to some degree. Hydroelectric power now accounts for over three-quarters of total electricity generation.
On the other hand, the subsidies for hydroelectric power prevented natural gas and other energy supplies from growing for a long time. Gas consumption, in fact, remained the same level for over 40 years until before
the 1980s. (Petroleum PS, 1970) Only the consumption of crude oil became
relatively large because of high rate of car ownership. More than 1.5 million
cars were owned by 3 million New Zealand people in the early 1980s - one of
the highest ownership rates in the world. (OGJ, 1983a)
The country therefore had a heavy reliance upon imported oil. With only gas condensate available from the Maui and Kapuni fields, the oil consumption of 40 million barrels/year needed to be imported. Consequently, the country was severely damaged by the oil crises in the 1970s like other industrialized
countries. The oil crisis in 1973 forced a 5 percent cut in domestic petroleum
use. Gasoline stations were closed on weekends, speed limits were strictly
enforced. The allocation system for all oil products bit deeply into the lifestyle of most people. Not surprisingly, the economy went into a long time recession
soon after the first crisis in 1973.
2.1.3. Energy policy
Until the 1970s, the government's interest in the domestic energy sector had been to locate domestic oil resources. Private companies conducted this task, but were unsuccessful. Hence, even the findings of big gas reserves, in Kapuni and Maui, were disappointing results for the government. However,
this energy policy was forced to change after the oil crises. The focus then was
to increase domestic energy resources use to improve self-sufficiency. The policy of the government was stated in the early 1980s as follows: (Boshier,
1984')
Through the 1950s and 1960s we fueled our economy on cheap imported oil. This enabled us to enjoy economic and social progress and to develop our way of life. The oil shocks of the 1970s brought home to us how
vulnerable we are. In 1973, oil cost us 93 million, this year a massive $1500 million, over 30 percent of our imported bill. While we remain dependent on imported oil, the oil producing countries effectively undermine our level of economic independence. The National Party
believes this is quite unacceptable to the people of New Zealand.
Our aim is to ensure an orderly transition from an economy dependent on imported oil to an economy relying on our own diversified energy
resources. The long term goal is for New Zealand to be totally
self-sufficient in energy by the turn of the century.
The National Party, in charge of government at the time, strongly urged the necessity of domestic energy resource development. The government began the search for natural gas use in addition to domestic oil field development. For this purpose, the Ministry of Energy formed a new state company, the Petroleum Corporation of New Zealand (Petrocorp) in the late 1970s to take over government interests in oil and gas to enter joint partnerships with the private sector. The company had three subsidiaries: Offshore Mining Company, to look after the state's involvement in the Maui natural gas project; the Natural Gas Corporation of New Zealand; and
Petrocorp, (Exploration), to explore for oil offshore.
Consequently, natural gas became a main energy supply for the future, and use of the Maui reserves was urged since it was left undeveloped after being found. For the use of the plentiful domestic gas, a number of projects and proposals were made at that time. Initially, natural gas use for electric
generation was considered. However, it was not completely carried out due to
the lack of demand for additional electricity. The government began seeking other ways to use surplus Maui gas, but the New Zealand market for petrochemicals, then, was too small and liquefied natural gas (LNG) export
Meanwhile, there was a project in progress in 1979 to construct a plant to produce 160,000 tonnes/year of ammonia-urea fertilizer. The government also approved the design work on a 2500 tonnes/day methanol plant, to be on
operation by 1983-84, for a 15-85 blend with gasoline for automotive use. Private companies, Shell-BP-Todd consortium, proposed a 100 million project to produce 400,000 tonnes/year liquefied petroleum gas (LPG) for automotive
and other uses. (IPE, 1980)
2.1.4. Decision on synthetic gasoline
Among many proposals for natural gas use, Mobil's offer in 1976 caught
the New Zealand government's attention. The plan was to produce gasoline
from natural gas using a catalyst developed by Mobil. This synthetic gasoline
production could increase self-sufficiency and produce an exportable oil
product, and would gratify the government which as a sole customer for Maui
gas, was hoping to upgrade it into liquid fuels for domestic use and export.
Consequently, the synthetic gasoline (Synfuel) project, meeting the
government's energy policy, gradually grew into a big national venture.
In addition, the government's decision to proceed with the Synfuel
project was encouraged by the following: (Hooper, 1991a)
- There was a large amount of domestic natural gas which could meet national requirements for a long time.
- The domestic energy sector was regulated, and thus gas and oil prices
were under the government's control.
- There was no alternative natural gas project that could provide the same national benefits
Under these supportive circumstances, the government's involvement in the project began to increase as it knew that no such a large venture would proceed without the New Zealand government's intervention.
2.2. Svnthetic Gasoline Proiect
2.2.1. Planning and construction
Mobil's proposal in late 1976 was a NZ$200 million project to convert Maui gas to gasoline at a rate which would rise to 57 million barrels/year. The
company estimated that gasoline could be made from natural gas at a price
that would cost no more than the consumer was paying for imported products. The Mobil MTG (Methanol To Gasoline) process converts methanol to high octane unleaded gasoline using a zeolite catalyst. The process, which would be
the first commercial production in the world, would supply one-third of the domestic gasoline demand - 22% of its total fuel requirements in 1986, when the plant was in full operation.
The project was finally approved by the government in late 1979. The
plan announced by the Ministry of Energy was to build a 530,000 tonnes/year methanol-to-gasoline conversion plant with an estimated cost of US$445
million. The plant was to use about 50 billion ft3/year of natural gas to produce 13,000 barrels/day of high octane, low sulfur gasoline. The Mobil MTG process was said to be able to produce a barrel of synthetic gasoline for US$23.00.
(Petroleum Econ., 1979)
Through a series of design sessions, the plant site was decided in
billion in 1985 dollars. The New Zealand government was to provide 206
million, while Mobil 69 million. Citicorp International Group, a consortium of
40 banks led by Citibank, financed the remainder with a standby overrun of $550 million, which resulted in a total commitment of almost 2 billion. The
government owned 75% of the venture while Mobil had a 25% interest and
would manage the project. Project services were provided by Bechtel
Petroleum. (Wilhams, 1984)
Meanwhile, the opposition political party, the Labour Party, strongly objected to the project on the ground that it was "too expensive", and
campaigned the during 1981 election with this appeal. (PIW, 1982) However,
the joint venture moved ahead as planned after the National Party's reelection
by a slim margin. The construction began in March 1982 with Mobil's consent,
and the New Zealand Synthetic Fuels Corp. NZSFC) was established for the
Synfuel project.
2.2.2. After the start-up
Despite the fact that the plant was the first commercial-scale
production of the new technology, construction was completed on time, July 1985, and the Motunui plant began operations in October 1985 as scheduled. In addition, the construction costs ended up being 17% less than estimated.
(AUum, 1987) The construction was, therefore, recognized as successful. The
New Zealand Synthetic Fuels Corp. had made a desirable launch of its operations. The plant also proved technically feasible, and had performed better than expected. The designed capacity of 14,000 barrels/day of production was attained by the early part of the following year, 1986, when the
plant was in full operation. Later, Mobil announced that the plant had
exceeded 13% of its design capacity in 1991. (Petroleum Econ., 1991b)
However, the government was already considering the possibility of selling the plant due to the low oil prices after only a half year into its
operation. (Petroleum Econ., 1986) Because the production would be economical if
oil prices were at $28/barrels in 1980 dollars or above, the operation had never
been profitable as the oil pices remained for below this price. Besides, the
oil-collapse in early 1986 just a few months after the start-up, compounded the problems seriously. While the plant was expected to save the country an
average of NZ$220 million/year in 1985 dollars in import oil expenses according to NZSFC, it was, instead, churning a loss by the same amount or more due to the production costs. McEldowney, 1985a)
At the same time, the national energy policy that supported the production was altered after the National Party government was defeated in
the 1984 elections. The new Labour Party government proceeded to withdraw
fi-om further involvement in the energy sector, and hastened the privatization
of state-owned energy related companies. The state-owned Petrocorp, through
which the government had owned 70% of domestic oil and gas field explorations
and developments, was not an exception. Not surprisingly, the government urged the unprofitable NZSFC.
The government sold the company to Petrocorp in 1990 for US$260 million, including US$150 million which Petrocorp had prepaid for existing offshore gas supplies contract through 2009. OGJ, 1990) As Petrocorp at that time was already sold to Fletcher Challenge Ltd., New Zealand's biggest chemical company, the Motunui plant became detached from the government.
Mobil, on the other hand, was not responsible for the investment capital debt, and was in fact reaped a 16% return on the Synfuel production. However, the
company sold its interest to Fletcher Challenge in 1993 for 73 million, which
included the royalty payment to continue providing the necessary technical support, as the plan to merge methanol interests of Fletcher Challenge and
Methanex Corp., a Canadian chemical company, became apparent. (OGJ, 1993) Today, the Synfuel plant is in operation and is still producing one-third of
gasoline needs in New Zealand, even though its original owner and process-designer have both left the corporate scene. Meanwhile, Methanex's purchase of the plant was linked to the package deal consisting of the natural gas supplies and the methanol production units in the plant, since the company, the world's largest methanol company, is investing in the natural gas and
methanol businesses. (Methanex, 1992) Therefore, the future of the remains of
the big national project, now called the Methanex New Zealand Ltd. Motunui plant, is unknown.
2.3. The 1980s and Now
The New Zealand government began promoting domestic energy supplies since the late 1970s. The government spent NZ$750 million in 1983 dollars between 1983 and 1986 on oil exploration both on and off the country. Using attractive packages and tax incentives, the government has encouraged
the private industry to develop oil fields. At the same time, a plan for increased
natural gas use was strongly promoted. Other than the Synfuel project, the government had carried on the plan to use domestic gases in the form of
These efforts of developing domestic energy supplies showed good results
as shown in Figure 22. Four promising oil fields were found in the 1980s, including the country's first commercial scale oil field, McKee in Taranaki,
which was discovered in 1980. The total domestic production today amounts
to 40,000 barrels/day and supplies about half of the total needs of the country.
(NZ Yearbook, 1992) The government also made progress in promoting the use of
LPG and CNG for automobile fuels since nearly 8% of the New Zealand
vehicles have converted to these fuels. About 10% of transport fuels demand was met by 130,000 CNG vehicles and 3 by 40,000 LPG vehicles by 1986.
(Lonergan,1990)
As a whole, New Zealand's self-sufficiency in energy has changed substantially since 980. There is a significant shift from the situation in the
early 1980s where 85% of the domestic oil supply was dependent on foreign oil.
Oil Production Gas Production
('000 tonnes) (billion cubic feet)
I- -/.UW 1500 1000 500 0 IDU 200 150 100 50 n 1980 1982 1984 1986 1988 1990 Year
Figure 22. New Zealand: Oil and Gas Production
I . ... - --- - --- ---
-...
3 56
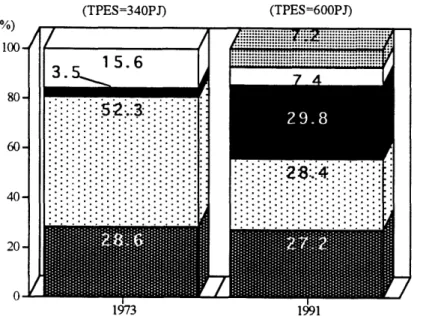
5---New Zealand has achieved 60% self-sufficiency in petroleum products today by
promoting the domestic gas use. As Figure 23 shows, the pmary energy
supply significantly changed between 1973 and 1991. New Zealand's self-sufficiency in energy reached 84% in 1990. Apparently, the synthetic gasoline from the Synfuel plant contributed to this achievement.
(TPES=340PJ) (TPES=600PJ) 100- 80- 60- 4020 -
A-t
...
...
...
...
...
...
...
...
...
...
...
...
...
...
...
...
...
...
...
...
...
...
...
...
...
...
...
...
...
...
M Hvdro/Geothermal El Oil INatural Gas El CoalIM Other Solid Fuels
...
...
...
...
...
...
...
...
...
...
...
...
2 1973 1991Figure 23. Primarv Energy Supply, 1973 and 1991
3.1. Natural Gas-To-Gasoline Process
3.1.1. Process Allum, 1987)
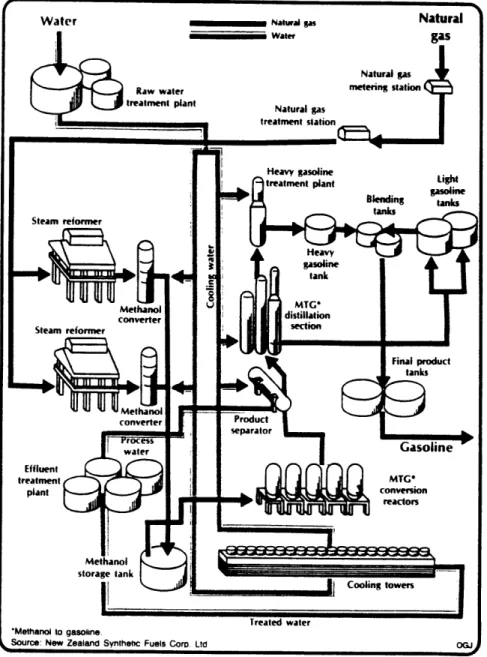
Figure 31 describes the flow of the natural gas to gasoline process. At designed conditions, 52.5 PJ/year lpj=1012BTU) of natural gas is converted
to 570,000 tonnes/year of synthetic gasoline. Fundamentally, there are two main processes involved in the synthetic gasoline production. Natural gas is first converted to methanol using the Davy McKee/ICI technology. The
methanol is then converted into gasoline by a ZSM-5 zeolite catalyst, invented by Mobil. This methanol to gasoline reaction is known as the Mobil MTG (Methane To Gasoline) process.
Methanol can be derived from a blend of Maui and Kapuni gases. The main steps in the process are desulfurization of the eed gas, steam reforming to synthesis gas, compression and methanol synthesis. The methanol plant,
which is designed by Davy-McKee, is made up of two conversion units of which
capacity are 2200 tonnes/day each. The operation and the performance of the methanol units is well understood from previous commercial experience.
Approximately 155,000 m3/hr 5.47 million ft3/hr) of natural gas is converted to 6700 m3/day 0.24 million ft3/day) of crude methanol. The crude methanol
must be further processed if it is to be used as product methanol. However, it
can be fed to the MTG unit without such processing. Also the crude methanol
can be sent to the neighboring methanol plant for upgrading to chemical grade methanol. Methanol production during 1990 totaled 17 million tonnes. The methanol units stand as the largest single site methanol capacity in the world.
Conversion of methanol to gasoline occurs in two stages. First, the crude methanol is partly dehydrated in a fixed bed reactor to an equilibrium mixture of dimethyl ether DME), methanol and water. The DME mixture is then combined with recycle gas and passed to the gasoline conversion AM reactors where reactions to form gasoline take place. The methanol is
Figure 3 - . Natural gas to gasoline flow chart
converted to approximately 44% hydrocarbons and 56% water. The hydrocarbons yielded are in the gasoline boiling range, and contain mainly isoparaffins, aromatics and olefins, and thus has a high octane number. The ZSM-5 catalyst in the MTG reactors consists of a structure made of tiny holes which have about a 6A diameter. This structure creates shape-selectivity, preventing the production of hydrocarbons heavier than C1 1. The catalyst
ZSM-5 can be regenerated while on stream and has catalyst life excess of two
years.
The overall process has 57% thermal efficiency. The thermal efficiency
of the MTG reaction alone is 95%. The gasoline produced has at least 91 octane number, and is transferred to Port Taranaki by pipeline for either shipping to the Marsden Point refinery for blending and distribution or for export to overseas markets.
3.1.2. Infrastructure
Infrastructure of the production, such as the pipelines of feedstock, product transfer and water supply, off-sites and utilities, was all supplied and
owned by the government A 0 inch diameter, 32.2 mile pipeline transports
synthetic gasoline at a rate of 19,500 barrels/day from the plant to the Omata
tank farm. An 18 inch, 2 mile loading line carries about 306,000 barrels/day of
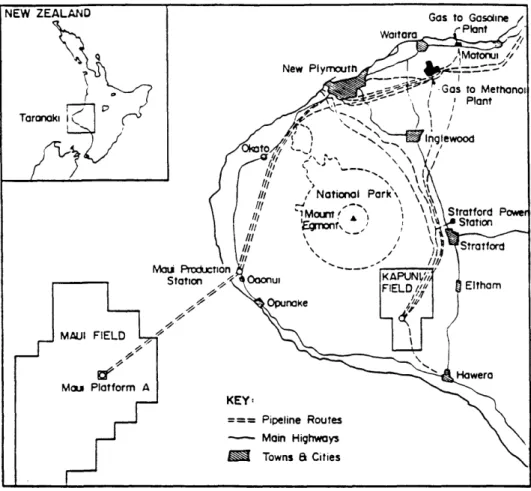
the gasoline from Omata to Port Taranaki for shipment to the Marsden Point refinery. Two supply pipelines, 24 inch and 12 inch, carry natural gas 33 miles from Waitara to the plant for use as feedstock. Their combined capacity is 182 million ft3/day. (OGJ, 1983d) Figure 32 shows the location of the Synfuel plant and the natural gas fields.
Figure 32. Synfuel gas-to-gasoline plant location
Source: (Hooper, 1991a)
3.1.3. Technical feasibility
Prior to the start-up of Synfuel plant, both the New Zealand government
and Mobil were confident of their new venture as there was already evidence to
support the technical feasibility of the process This feature makes the Synfuel
project different from some of new technology ventures where optimistic views
of the planners about technology improvement does not match real technology practicality, causing unsatisfactory outcome right from the start of operation.
The Mobil MTG process, which was discovered and studied since the
1960s, showed technical feasibility during the 1970s. The construction of a
pilot plant began in 1980 in West Germany, by the West German and the U.S. governments, Mobil, and West German operators and engineers. The fluid-bed plant was completed in 1983 and successfully processed 100 barrels/day of methanol to yield gasoline. The methanol-to-gasoline pilot plant surpassed targeted production and converted 135 barrels/day of methanol into high
octane gasoline. OGJ, 1983d)
3.1.4. The MTG process among other synthetic fuel processes
Like many other newly introduced technologies, many synthetic fuel
technologies at the time of emergence were unproved and uneconomical. It is
therefore necessary to distinguish the practical processes from the promising processes. The Synfuel process will be included in the former as well as Malaysia's middle distillate synthesis yielding kerosene, gas oil, naphtha and some wax from natural gas. Both processes are similar to oil refining processes as equipment used in the both processes are similar to petroleum hydrotreating. Also, both processes yield direct production of oil products which is advantageous over synthetic crude production which requires further
refining steps to make high-quality oil end products. (Petroleum Econ., 1991a)
In comparison with other synthetic gasoline processes, the MTG
process in the Synfuel production also has great economical potential. The
AM process would give significant cost advantages over the Fischer-Tropsch
synthesis, another prominent process for synthetic gasoline. The expectation before the start up of the Synfuel plant was that the plant would produce
Table 3 - 1. Typical properties of finished MTG gasoline
Source: (OGJ, 1976)
Table 32. Properties of the Synthetic Gasoline
Source: (Hooper, 1991b)
the cost of imported gasoline. (Wilhams, 1984) For the case of methanol as a fuel, gasoline by the AM process was the only interim production technique at that time unless methanol could be used directly in engines designed for its use.
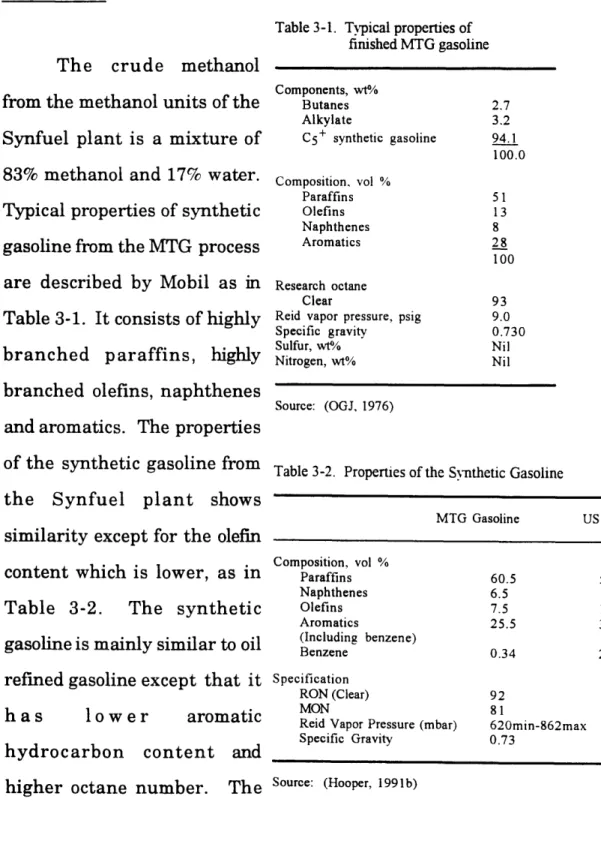
3.2. Product
The crude methanol
from the methanol units of the Synfuel plant is a mixture of 83% methanol and 17% water. Typical properties of synthetic
gasoline from the MTG process
are described by Mobil as in Table 31. It consists of highly
branched paraffins, highly
branched olefins, naphthenesand aromatics. The properties of the synthetic gasoline from
the Synfuel plant shows
similarity except for the olefin
content which is lower, as in
Table 32. The synthetic
gasoline is mainly similar to oil
refined gasoline except that it
h a s I w e r aromatic
hydrocarbon content and
higher octane number. The
Components, wtO/o Butanes Alkylate C5 + synthetic gasoline Composition, vol % Paraffins Olefins Naphthenes Aromatics Research octane Clear
Reid vapor pressure, psig Specific gravity Sulfur, vAO/o Nitrogen, wt% 2.7 3.2 94.1 100.0 5 1 3 8 2 100 93 9.0 0.730 Nil Nil MTG Gasoline US Gasoline Composition, vol % Paraffins Naphthenes Olefins Aromatics (Including benzene) Benzene Specification RON (Clear) MON
Reid Vapor Pressure (mbar) Specific Gravity 60.5 6.5 7.5 25.5 0.34 56-60 10-12 30-32 2.0 92 8 1 620min-862max 0.73
higher octane number enables the synthetic gasoline to be used as lead-free
gasoline. It is also suitable for reformulated gasoline, cleaner gasoline for the future, because of the low aromatic hydrocarbons, especially benzene.
Although there are no hydrocarbons heavier than C11, the AM gasoline contains a relatively high proportion, approximately 2 of total product in weight base, of durene (1 2 4 5-tetramethyl benzene), a heavy
aromatic. Because of its high melting point (790C), durene causes precipitation
in an engine's carburetor when used in gasoline, and thus has to be either
diluted or removed from the final product. The durene, however, is a potential
feedstock for the manufacture of pyromellitic dianhydride (PMDA) used in polymide polymers, engineering plastics and for other high performance
applications, and can be sold to the petrochemical industry. Given the Synfuel
plant can produce as much as 35,000 tonnes/year of durene, the government sought to use this by-product by constructing a 40,000 tonnes/ year PMDA plant.
3.3. Proiect Costs
3.3. 1. Production costs
According to the New Zealand government's estimation, the project could pay the full commercial price for natural gas, which was then US$1.03/GJ, if crude oil prices remained above US$28/barrel in 1980 dollars over the life of the venture. (Boshier, 19841) The oil price in 1980 was
US$36/barrel, and thus the project could even afford a decline in the oil prices.
The government's expectation also included an escalation in the net-profit with oil price rises in the future.
The actual 1988 financial situation and the 1990 costs of the natural gas to gasoline conversion process are described in Table 33 and Table 34 respectively. As the Table 34 shows, the factor influencing the cost rise most was "Full Investment Recovery." The rest of the operating costs, in fact, were less than 60% of the total costs. Interestingly, the production costs without the returns on investment are approximately equal to the total revenue. These values are in accordance with the statement made by New Zealand Synthetic Fuels Corp. before the plant start-up that the synthetic fuel project
would be economical as long as crude oil prices remain more than US$12/barrel in 1984 dollars, since the average oil prices in 1989 were close to US$12/barrel in 1984 dollars. (Williams, 1984)
The plant was operated on a tolling basis, which amounted to a fixed fee
per unit of feedstock processed. The natural gas feedstock and the gasoline produced by the plant were both owned by the government, which thus took the risks and benefits of fluctuating value of the product. Consequently, a government subsidy was required to maintain the operation economical.
However, the venture was undertaken without such subsidy and was on a project loan basis. (Hooper, 1991b) Synfuel production therefore lost nearly
NZ$350 million in 1988 as shown in Table 33.
3.3.2. Investment costs
There was a significant difference between the cost estimates of 1981 and 1984 because of a large increase in investment cost during the construction period. The total capital cost including fees and startup costs was
initially estimated to be US$886 million in March 1980 terms. However, there
Table 33. Synfuel Project Financial Position 1988/89
Costs NZS million Revenues NZS million
Gas purchase 127.5 Gasoline sales 189.2
Fee to NZSFC 438.5 Other revenue 29.6
GGT operating expenses 24.0 NZSFC dividend 92.3 Stock movements 5.3
Interest charges 72.2
Totol costs 667.5 Total revenue before tax 311.1 Government loss on operations after interest and before tax 356.4
Energy resources lew foregone 25.8
Withholding tax (6.8)
Net loss to government 375.4
Source: (IEA, 1989)
Note: Report for the year ended 31st March 1989.
Table 34. Gas-To-Gasoline Costs, 1990
Cost Component Contribution Required Required Gasoline Selling Pce
(US$/bbl) (US$/bbl)
Variable Cost 13 13
Cash Cost 7 20
Debt Service Cost 15 35
Full Investment Recovery 30 65
Basis Gas Cost USSI.25/GJ gas Plant Capacity 630,000 tonnes/year
Required Return I % real after tax
construction period of 283 million. Therefore, the total cost summed up to
US$1.475 billion in 1985 dollars. The interest rate during this period was very
rapid and was recognized as 16%, which was the adjusted value for inflation of New Zealand's 10% real rate of return for the public investment. (Boshier, 1984)
As the construction was completed at 17% under budget, the overall investment costs became US$1.218 billion in 1985 dollars. The government
paid 200 million and loaned almost 1.7 billion from the Citicorp consortium.
As the loan was on 10 year term and the government could pay 0.5 billion immediately, payments averaged 200 million per year over this period at a 16% discount rate adjusted for inflation. This value coincides with the full investment recovery cost in Table 34. From the same table, the required
gasoline selling price for this cost was US$30/barrel, or N$0.33/liter. The
total required gasoline selling price of NZ$0.70/liter would be costly compared
to the domestic retail gasoline prices of NZ$0.52/liter after tax in the same
year. (IEA, 1993)
3.4. The Production To
Despite the government's prediction, world oil prices became
US$17/barrel by 1987, and continued to be at or below this level. As described
above, the government was losing more than NZ$350 million a year in 1988. It also shows that gasoline sales had to be three times the actual sales to meet the overall operational costs. However, the average gasoline prices in New Zealand had only slight increases over the period of 1986 and 1992 as shown in Table 35. Also, gasoline price in the world market did not show significant increases except for the period of the Gulf crisis, as in Table 36. Thus, by
Gasoline (NZS/liter) Price Tax 1986 0.829 0.256 1987 0.899 0.445 1988 0.898 0.452 1989 0.904 0.425 1990 0.964 0.441 1991 0.998 0.453 1992 1.006 0.469 Source: (IEA, 1993)
Note: Prices are set by the government. Data between 1986 and 1989 are reta'I gasoline prices. Data after 1990 are wholesale prices. Retail prices are no longer collected on a national basis.
Table 36. Gasoline Spot Prices, 1986-1992 (Rotterdam)
US dollars/barrel
Source: Platt's
Table 35. Gasoline Prices in New Zaland. 1986-1992
simply estimating the process
costs and the revenues, the
government could possibly have lost more than NZ$2 billion by 1992 if it had continued to own the plant. 1986 1987 1988 1989 1990 1991 1992 19.97 21.79 20.59 24.31 32.06 27.70 24.73
The Synfuel plant was eventually sold to a Canadian chemical company, Methanex Co., after being sold to privatized Petrocorp. Apparently, acquiring the methanol production capability of the plant was the main aim of Methanex Co., because the company currently stands as the world's largest producer of methanol, producing 16% of all chemical methanol in 1993. However, the change of the owner provided the plant an ability to swing production between gasoline and chemical grade methanol to take advantage of relative pricing differences between the two products, since Methanex Co.
also owns the neighboring methanol plant, as in Figure 33. (Methanex, 1992)
Yet, the company seems to place more emphasis on methanol production given
today's low oil prices, and plans to build an additional 2000 tonnes/day
methanol distiller which will subsequently reduce gasoline production.
(d"mid tonrm) 100 I 750 500 250 0 1990 1991 Year
Figure 33. Motunui Plant Production
Source: (Methanex, 1992)
4. 1. Liquid Fuels Promotion
4.1.1. Goals and the programs
In 1978, transport fuels was 75% of total oil consumption, which were 85% dependent on imported crude oil and oil products. (Hooper, 1991a) As a
consequence, the government decided to promote replacement of transport
fuels by liquid fuels from some indigenous energy resources in order to achieve
the nation's goals to decrease its imported oil dependence.
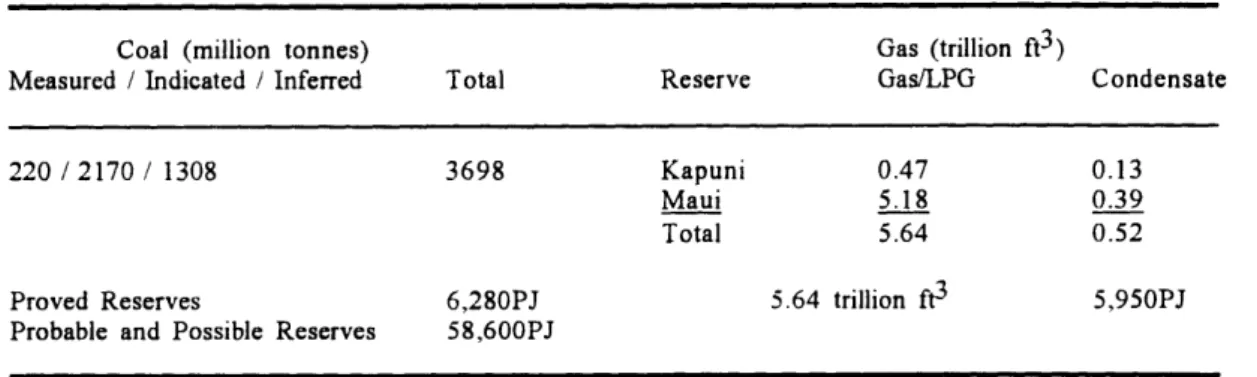
Major domestic energy resources included coal and gas. As shown in Table 41, the coal reserves were estimated to be ten times larger than the gas reserves in terms of energy potential. The use of coal, however, was declining because of the high distribution costs and inconveniences in the handling and
use of coal. The situation was compounded by a take-or-pay" contract of the
Maui gas between the developers and the government. The contract, which
would run from 1978 through 2008, created an obligation for the government to
Table 4- 1. Recoverable Coal and Gas Reserves, 1980
Coal (million tonnes) Gas (trillion ft3)
Measured Indicated Inferred Total Reserve Gas/LPG Condensate
220 2170 1308 3698 Kapuni 0.47 0.13
Maui 5.18 0.39
Total 5.64 0.52
Proved Reserves 6,280PJ 5.64 trillion ft3 5,950PJ
Probable and Possible Reserves 58,600PJ
Source: (IEA, 1980)
use the resource. For these reasons, the government decided to use natural gas alone for producing the liquid fuels. Together with Kapuni reserves, the domestic natural gas was expected to be major energy supply for the next 30 years.
In order to proceed with the liquid fuel programs, the Liquid Fuels Trust
Board (LFTB) was formed by the Alinistry of Energy in 1978. The LTB was funded by a levy on gasoline and diesel sales. The Nfinistry's energy goals
announced in the late 1970s also included policies which supported the liquid
fuels program: (IEA, 1980)
- to reduce its dependence on imported oil by the progressive
implementation of substitution measures selected to inimize increases
in the cost of energy supply
- to promote the effective and economic utilization of indigenous energy resources which contribute to energy supply, assist economic growth, and benefit export receipts
By proceeding with the policies above, the government expected a substantial decrease in oil dependency by 1990.
4.1.2. Liquid fuel programs
The Liquid Fuels Trust Board examined and made recommendations to make use of indigenous natural gas resources. Later, the programs to use gas as a fuel were announced in the early 1980s. CNG, LPG and methanol had
been considered as alternative fuels as well as synthetic gasoline.
The CNG program was to introduce CNG vehicles to the North Island.
The targets were 150,000 vehicles by the end of 1985 and 200,000 by 1990 In
constructed assuming that each would serve 500 CNG vehicles. For this purpose, taxation and financial incentives were provided to motorists and the
industry. Also, the minimum gasoline price controls existed. The conversion
investment was, hence, repaid within one or two years by the various incentives and fuel savings though the cost of a conversion was about
NZ$1,500 in 1981 dollars. The government also converted its own vehicles as many as possible. (IEA, 1981)
As a result, the number of vehicles converted to CNG increased
gradually as shown in Figure 41. (Sperhng, 19881) CNG had gained 10% of the
New Zealand market share in 1986, more than in any other country, even though it was used only on the North Island where the Maui gas reserves were
available. CNG Vehicles 1.)UA" 100000 50000 0 1979 1980 1981 1982 1983 1984 1985 1986 Year
Figure 41. CNG Vehicle Conversions in New Zealand. 1979-1986
The LPG program was also introduced at the same time as the CNG
program but at a lower level. It was a higher cost option than CNG, but LPG was necessary for the South Island, as there was no gas pipeline connected to
the North Island to obtain CNG. The government expected that at the end of
the 1980 335 PJ of LPG would be consumed by automobiles 2.7% of total
automobile fuel use). Because of the increases in capital and operating costs, the government provided assistance to the LPG distribution company in order
to assure a reasonable return as well as incentives similar to those of CNG.
(IEA, 198 1)
Meanwhile, Liquigas Ltd. was formed with Shell, BP and four local companies as the main shareholders to make LPG available for transport throughout the country as the government aggressively pursued the liquid fuel programs. Liquigas tied to bing LPG to the South Island as the fuel had been restricted to the North Island until the early 1980s. There was also private investment in facilities to make CNG available for transport. (McEldowney,
1985b)
Methanol for transportation was another option for the country. However, New Zealand had no domestic auto-manufacturing industry, and dropped the idea of creating a methanol car due to technical difficulties. The option of blending methanol with gasoline was also rejected by the Liquid Fuels .Trust Board, which concluded it was uneconomical because of the much greater value for methanol, which must be anhydrous for blending, as an exportable energy commodity. Therefore, the methanol program remained
The uses of natural gas were allocated as described in Figure 42 In addition to the gas uses described above, an ammonia/urea plant began production in 1979 with the capacity of 90,000 tons/year of ammonia to be
converted to 160,000 tons/year of urea fertilizer. Ethane was to be converted to chemical products for export, such as polyethylene. Also, a plant to produce
1,200 tonnes/day of chemical methanol started operation. On the other hand, another use of natural gas, LNG, was not endorsed. Converting gas to methanol for shipping as an export product was preferred over LNG in terms of
economical and technical feasibilities.
The expansion plan of the Marsden Point refinery, the only domestic refinery, was also closely related to the liquid fuel programs. The refinery's
capacity would be increased to 4000,000 tonnes/year of feedstock, which
I
Pmductic and hiui
ias 46
'Use of Maui, Kapuni gas reserves through 2008.. tReserves would be less by 2009 if second Maui platform were built and production increased.
. ource: Institute of Gas Technology OG)
Figure 42. Maui Gas Use*
Source: (OGJ, 1982)
would sufficiently satisfy country's demands for major petroleum products till 2000. The new main process unit, a hydrocracker, would eliminate naphtha and most refined product imports except gasoline, and would enable more
medium and heavy crude to be processed by the refinery while avoiding a fuel
oil surplus. The expansion by the mid-1986 was expected to diminish imports
of oil products to nearly zero.
4.1.4. Energy conservation programs
In addition to the liquid fuel programs, the government implemented a number of measures to encourage energy conservation in the transportation
sector. (IEA, 1982)
- The introduction, in co-operation with the motor vehicle industry, of fuel
consumption labeling for new cars
- The development of a program which aims to market a package of fleet management and fuel saving techniques to New Zealand vehicle fleet
managers.
- The assessment of the effectiveness of encouragement to motorists to practice fuel efficient driving behavior.
- Encouragement for car pooling.
- The study of more efficient use of diesel in heavy transport.
- Financial support for urban transport systems.
Especially, New Zealand's graduated sales tax on new gasoline vehicles based
on engine size seems to have had a significant effect on improving vehicle fuel
economy. The trend toward larger vehicles seems to have been halted - in
1980, 91% of new car registrations were of vehicles of less than 2 liter engine capacity compared to about 59% in 1973.
4.2. Goverrunent's Choices
4.2. 1. CNG (Compressed Natural Gas)
CNG is the most direct application of natural gas among the gasoline substitutes. The gas is compressed for fuel use because of its lower energy
intensity. A CNG vehicle was a new technology for New Zealand. Actually,
only Italy had made significant CNG vehicles conversion in the world before the late 1970s. Its use as a transport fuel required a significant modification to the automobile. Refueling stations also required high-pressure gas-storage facilities and high pressure compressor units to attain the pressure for CNG.
Mchener, 1980)
The advantage of CNG compared to gasoline is that the fuel is clean-burning, while the disadvantage of CNG is its low energy density. The typical range of a car fueled with a CNG cylinder is 110 miles, and the car must, therefore, operate close to the refueling area. In addition, CNG vehicles suffer a slight power loss, and the usable space in the car is narrowed because of the gas cylinders. Consumer preference, therefore, would favor gasoline vehicles more unless CNG vehicles have significant incentives. Due to the additional
cost of installation, costing about NZ$1,500 in 1980 dollars each for CNG kits,
CNG was not economical in all vehicles, although its production cost was
relatively low among many non-conventional fuels.
4.2.2. LPG (Liquefied Petroleum Gas)
Like CNG vehicles, LPG vehicles have a relatively small driving range
been more widely proven, and more than 25 million vehicles worldwide operate
on LPG mixtures today.
The total use of LPG in New Zealand had been growing rapidly. Consumption had risen to 25,000 tonnes/year in 1981 and 40,000 tonnes/year
by 1984 from 1200 tonnes/year in 1971. The New Zealand LPG specification
is 80% propane and 20% butane which are available from natural gas liquids contained in the gas stream. An LPG component is extracted from natural gas
before it is transported via pipelines. Therefore, LPG production is limited to a
small percentage of gas production. As a consequence, the government's
target of LPG conversion compared to CNG was low. CNG would be the main fuel, while LPG would remain as complement to the CNG conversion for the
South Island.
4.2.3. Methanol and gasohol
There are mainly three different ways of using methanol as a motor fuel:
blending methanol into conventional motor fuels; use of pure methanol; and
conversion into gasoline. ixed with gasoline (gasohol), methanol can be used
without significant changes in vehicle fuel systems, while it cannot be used
with diesel fuels because it is a poor compressive ignition fuel. Methanol, also,
needs major vehicle modifications if used as a pure methanol fuel since it has characteristics such as high corrosivity and poor lubricity. The advantages of
a methanol fuel are cooler and cleaner burning and higher octane property. The disadvantages are that methanol is more expensive than gasoline and methanol vehicles have a smaller driving range and poor engine ignition due to low vapor pressure.
Features of New Zealand liquid-fuel supply and distribution system
imposed major obstacles to wide use of methanol blends. Expensive cosolvents
were required because the distribution system was wet and the climate was
damp. Aldehyde emissions from methanol vehicles would also be detrimental
to New Zealand because the country did not have local pollution problems that
were caused by conventional vehicles.
4.3, Economic Feature of the Promotion
New Zealand government had significant control over domestic energy supplies until the mid-1980s. Most of the energy pces were controlled by the government at the time of the liquid fuel programs. Direct price control by the
government applied to gasoline, diesel, fuel oil and natural gas at all levels, and
electricity and coal at the wholesale level. herefore, the gasoline price relative to CNG and LPG was always kept high so that CNG and LPG remained
attractive fuels over gasoline.
From the mid-1980s, the government began deregulating the nation's energy sector and hence decontrolled energy prices. The government announced its intention to adopt a more market-oriented approach in the 1985 Energy Plan. Consequently, the incentives to maintain differences between CNG and LPG pces and gasoline price were cut back by the government As
in Table 42, the gasoline substitutes still showed a significant price advantage
over gasoline in 1989, but the ratio of gasoline to the gasoline substitutes, especially CNG, decreased after abolition of the minimum gasoline price in
For the CNG program, 50-60 CNG outlets associated with gasoline
stations could be built at a cost of about NZ$23 million in 1981 dollars. The
total capital cost of the CNG program, conversions of 150,000 vehicles by
1985, was estimated at NZ$285 million in 1981 dollars, of which NZ$60 million
represents infrastructure costs.
Table 42. National Average Retail Price of Gasoline, CNG and LPG - 1981 and 1989
(NZO/liter equivalent)
Gasoline CNG LPG Gasoline/CNG
1981 58 32 38 1.813
1989 90 56 61 1.607
Source: (1EA, 1981), (IEA, 1989)
4.4. In the Long Term
The goverrunent's plan of domestic gas use is described in Figure 43 In
1982, the government estimated that about 1.5 million vehicles out of a total
of 2.2 million could theoretically be converted to either CNG or LPG. (IEA, 1982)
However, CNG and LPG conversions were planned to be kept constant after 1990. Most of the current natural gas use would come to end in 2008, as the
Maui gas field was expected to be depleted by then, and the contract would
expire.
Unless further gas reserves are found, coal and geothermal energy is expected to be the major energy supply of the country beyond 2010. Their recoverable and potential resources are substantially larger than natural gas
Figure 43: Uses for natural gas
Source: (Boshier, 1984)
Table 43. Domestic energy resources in New Zealand, 1990
Resource Recoverable Energy (PJ)
Coal 117,600
Gas 3,600
Geothermal 75,000
Source: (NZ Yearbook, 1992)
Notice: Geothermal energy in terms of hat stored above 80T.
reserves as in Table 43. New Zealand could therefore face another problem in that it may need to promote new energy supplies, possibly alternative fuels
from coal, instead of natural gas.
240 220 200 180 160 140 n CL 120 100 so 60 40 20 0 1"2 1987 1"2 1"7 2002 2007 Year Ended 31 March
5.1. ReviewingtheLiquidFuelPrograms
5. 1. 1. Goals and the achievements
The goal of a substantial increase in self-sufficiency in energy was
achieved by 1990 as imported oil became approximately 50% of total oil supply in the early 1990s. The country's dependence on oil in energy decreased to 28% by 1991 from over 50% in 1973 as shown in Figure 5-1. Change and prediction
in the imported oil ratios are shown in Figure 52. Expected 45% imported oil
dependence in 1988 after the Synfuel start-up was also achieved as in Figure
5-2.
With the combination of synthetic gasoline, the use of CNG and LPG as
a fuel, and the production of condensate associate with the off-take of Maui and
WU 80 60 40 20 0
5. ANALYSIS - NEW ZEALAND'S ALTERNATIVE FUELS PROMOTION
1973 1979 1988 1991
Year
Figure 5-1. Percentage of Oil in Total Energy Supply
100 80 60 40 20 0 1973 1979 1988 1991 Year
Figure 52. Percentage of Imported Oil in Total Oil Supply
Source: (1EA, 1992)
Kapuni gas, New Zealand achieved its goal of 50% self sufficiency in transport
fuels. (IPE, 1989) The Synfuel plant contributed to the national goals by
producing one-third of domestic gasoline consumed as oiginally planned.
5.1.2. Economic aspects - sensitivity analysis (1) 1
The 1988/89 financial data of the Synfuel process described in Table 33
shows that the operation cost US48.90/liter. This is equivalent to
US30.70/liter in 1980 dollars, and coincides with the Mobil's estimation described previously. The Synfuel process therefore proved to perform both
technically and economically as designed.
In order to evaluate economics of the SynfLiel project, the net present
value (N-PV) of the project through its operating period will be necessary. From
Table 33, the Synfuel plant was known to be losing about NZ$350 million/year around 1989. To estimate economics of the whole Synfuel project, a simple sensitivity analysis is conducted for various rates of gasoline price (R') change
under certain assumptions and bases as follows. Assumption:
(1) The government maintained the Synfuel plant and made the repayment as planned.
(2) Rate of return, R, is 10% real and 16% adjusted for inflation, as
previously mentioned.
(3) Exchange rate of 1988, NZ$1.00=US$0.66
(4) Operating costs and revenues in 1988 described in Table 33 is the
basis for the Synfuel plant financial status, but the externalities, the government loss on operations after interest and before tax, energy resources levy forgone and withholding tax are not included.
(5) The loan had annual payments with an interest rate between 0.5% and 075% above the London interbank rate. These loan interest payments are assumed to be fully included in Table 33 costs. (6) Cost component and bases in Table 34 are used for the plant
operation status.
(7) Gasoline pce is taken from Rotterdam petroleum product spot prices.
(8) Gas cost was irrelevant to oil pice change as New Zealand had kept gas price control, even after decontrol of gasoline prices.
Basis:
(1) The N-PV for the operation period from 1986 through 2003 is
estimated. This period was used for the government's estimation.
(2) The NPV of 1984 is estimated for the same reason as above.
(3) Estimations are conducted for the 1980 gasoline price and the 1984 gasoline price. 'Me ol price was high when the project was planned in
1980, and was beginning to decline just before the start-up in 1984. Figure 53 show the result of the analysis. The actual rate of gasoline price change from the Synfuel start-up till 1988 was about 13% real.