HAL Id: inserm-00169297
https://www.hal.inserm.fr/inserm-00169297
Submitted on 4 Sep 2007
HAL is a multi-disciplinary open access
archive for the deposit and dissemination of sci-entific research documents, whether they are pub-lished or not. The documents may come from teaching and research institutions in France or abroad, or from public or private research centers.
L’archive ouverte pluridisciplinaire HAL, est destinée au dépôt et à la diffusion de documents scientifiques de niveau recherche, publiés ou non, émanant des établissements d’enseignement et de recherche français ou étrangers, des laboratoires publics ou privés.
Comparison of three spike detectors dedicated to single
unit action potentials of the auditory nerve
Jérôme Bourien, Jérôme Ruel, Lotfi Senhadji, Jean-Luc Puel
To cite this version:
Jérôme Bourien, Jérôme Ruel, Lotfi Senhadji, Jean-Luc Puel. Comparison of three
spike detectors dedicated to single unit action potentials of the auditory nerve. 29th
IEEE EMBS Annual International Conference, Aug 2007, Lyon, France. pp.1430 - 1433,
Abstract—This paper compares three methods for the detection of single unit action potentials in auditory nerve. The detector structures are similar consisting of a filtering procedure in the first stage and a decision rule in the second stage. The detection accuracy of each detector is characterized by the couple probability of a true detection vs. rates of false detection with synthetic data. The performance comparison between detectors shows that the detector using a band-pass finite-impulse-response filter with complex coefficients offers the best performance. This observation was especially evident for low signal to noise ratios. This finding is confirmed with real data and leads us to revise the protocol of spike detection in auditory nerve.
I. INTRODUCTION
N animal experiments, extracellular single unit (ESU) recordings from auditory nerves enable the study of normal and pathological functioning of the cochlea. After a posterior fossa approach, ESU is recorded with glass microelectrodes (tip diameter 0.1-0.5 µm) filled with 4 M NaCl, which have high resistances (20-60 MΩ ) [1]. Two types of ESU activity are generally taken into account: the spontaneous activity, which is characterized by the stochastic occurrence of transient signals (so-called action potentials) in the “silence” condition, and the sound-driven activity which carries information about the characteristic frequency, threshold, dynamic range and frequency selectivity of the fibers. Classically, the experimenter extracts the action potentials which emerge from the background noise by manually adjusting a “discrimination window” above the background noise level.
The aim of this study is to evaluate the effectiveness of other methods of spike detection. In the first set of experiments, we developed a numeric-window spike discriminator. The performance of the latter was then compared with two others spikes detectors. The first is based on the quasi-determinist character of the useful signal. The second used the transient character of the required signal.
Manuscript received April 2, 2007.
J. Bourien, is with: CREFA-Université Montpellier1, 15 avenue Charles Flahault, 34094 Montpellier, Cedex 5, and with the Institute of Neurosciences of Montpellier, INSERM U583, 80 rue Augustin Fliche, 34091 Montpellier, France (phone: 334-6754-8691; fax: 334-6766-8123; e-mail: [email protected])
L. Senhadji, is with: INSERM, U642, 35000 Rennes, France; and with Université de Rennes 1, LTSI, 35000 Rennes, France (e-mail: [email protected])
J. Ruel and J.L. Puel, are with the Institute of Neurosciences of Montpellier, INSERM U583, 80 rue Augustin Fliche, 34091 Montpellier, Cedex 5, France (e-mails: [email protected] ; [email protected]).
Performances of the three detectors were tested on simulated data. Results are presented as receiver-operating-characteristic (ROC) curves calculated for four signal-to-noise ratios (SNR). A representative example from a single-unit auditory nerve fiber is also given.
II. PROBLEM STATEMENT
The observation of the extracellular single unit activity of the auditory nerve fibers, over the interval [0, T], can be modeled as follows: 1 ( ) ( ) n i ( i) i e t b t a s t τ = = +
∑
× − (1)In this model, ( )s t is a determinist transient signal
(termed “spike” in the rest of this paper) corresponding to the extracellular action potential, n is the number of spikes in the recording, and τ is the random occurrence time of the i
ith spike. Considering the refractory period of a neuron, we
assume that the spike duration is smaller than the time interval between two consecutive spikes. The signal ( )b t is
a colored stationary noise representing the background physiological activities. The value a is the weighting i
coefficient applied to the ith spike. The coefficients
i
a model
the electrode moving during the measurement procedure and can be viewed as the sample of a low frequency band signal
( ) [0,1]
a t ∈ at time t= with τi ai =a( )τi . In this model, spike and noise powers are assumed to be constant; therefore, the SNRs depend only on the values of the coefficients a . i
With this formalism, the purpose of a detector will be to provide a set of time detections ˆ{ }τ , j j=1,...,nˆ, nearby the set of occurrences { }τ , i i=1,...,n (a hat applied to a variable denotes that the variable is an estimated quantity).
III. THE SPIKE DETECTORS
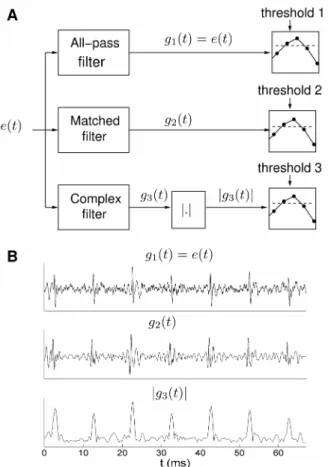
The three detectors are each composed of two blocks: an enhancement block for increasing the contrast between the spikes and the noise, and a decision block. The first block provides a statistic on which a decision rule is applied.
The decision rule, which is the same for all of the detectors, is the following: a spike is detected at time t t= 0 if the statistic value at time t is higher than the threshold 0
and if this value is a local maximum. Additionally, an initial delay or “dead time” is used to avoid detection in the 1 ms
Comparison of three spike detectors dedicated to single unit action
potentials of the auditory nerve
J. Bourien, J. Ruel, L. Senhadji and J. L. PuelI
Proceedings of the 29th Annual International Conference of the IEEE EMBS
Cité Internationale, Lyon, France August 23-26, 2007.
epoch which follows each detection.
The three enhancement blocks are the following:
1) An all-pass filter which does not modify the input signal. The output signal will be referred to as g t1( )=e t( ).
This block corresponds to a digital version of the analog detector used routinely in our laboratory.
2) A matched filter which computes the cross-correlation between ( )e t and a template of the signal ( )s t . This
technique was proposed by others [2] and the output signal is g t . 2( )
3) A complex filter which uses a convolution between ( )
e t and a band-pass Finite-Impulse-Response (FIR) filter
( )
h t with complex coefficients such that:
0 0 0 1 (1 cos(2 )) exp(2 ), if ( ) 2 0, otherwise C f t i kf t t h t = + π π ≤ f ,
where C is a normalizing coefficient, f a characteristic 0
frequency, and k∈ − −]
{
1, 0, 1}
. A temporal representation of this filter is shown in Fig. 1. This function has the properties of a continuous wavelet and was proposed for the detection of epileptic spikes in surface [3-5] and depth EEG signals [6, 7]. We applied the decision rule on the modulus, |g t , of the output signal, 3( ) | g t . 3( )We refer respectively to these detectors as: all-pass filter detector, matched filter detector, and complex filter detector in the rest of this paper. The block diagram of the three detectors is presented in Fig. 2-A.
IV. DATA A. Simulated data
Extracellular single unit activities were simulated using equation (1) and a sampling rate F =48 kHz. The spike S
shape ( )s t was built by aligning and averaging a large
number of spikes manually selected from experimental data. The physiological background ( )b t is a colored noise
generated using an autoregressive filter with 27 coefficients. The choice of this model was supported by a solid agreement between original and simulated background noises. Coefficients were identified on epochs of in vivo
background noise. One thousand spikes were introduced such that τ = ×i i 10 ms with i=1,...,1000. In this way, the duration T of a simulated ESU activity was close to 10 sec. The values of the coefficients a were held constant during i
the simulations in order to stabilize the SNR.
ESU activities were simulated with the above mentioned parameters with four different values for the a coefficients i
yielding simulated activities with SNRs of -6, -2, +2, and +6 dB. The epoch located at the beginning of the ESU activity simulated with an SNR of 6 dB is presented in Fig. 2-B.
B. In vivo data
The extracellular single unit activity was recorded in the auditory nerve of adult anesthetized guinea pigs [8]. Here, we present an auditory nerve fiber coded for 5 kHz with a high spontaneous rate activity of 58 spikes/s. The threshold is 0 dB SPL and the Q10 dB was equal to 4 Hz. This fiber
was selected because the spike magnitude varied with time during the course of the experiment. The sampling rate was set to 48 kHz.
Fig. 2. A: Block diagram of three spike detectors. B: The simulated single unit activity exhibits a regular spike train with 10 ms interspike intervals. The powers of the spike and the noise were both held constant such that the SNR was equal to 6 dB. The signals generated by matched and complex filters enhance contrast between the spikes and the background noise, which is especially prominent in the case of the complex filter.
Fig. 1. Complex impulse response of a band-pass FIR filter for S
F =48 kHz, f =500 Hz, and 0 k=3. The Real part is an even function
while the imaginary part is an odd function.
V. EVALUATION OF DETECTION ACCURACY
The detection accuracy of a detector, for a given threshold, was characterized by the couple Probability of True Positives (PTP) vs. the Rate of False Positives (RFP).
The TP was estimated using a short confidence temporal window W with the following method. For a given set of detection times ˆ{ }τ , j j=1,...,nˆ, the set of occurrence times { }τ , i i=1,...,n, was divided into two groups: true positives (TP) and false negatives. The partitioning rule was the following: the time occurrence τ is classified as a TP if it i exists j∈{1,..., }nˆ such ˆ
2 i j
W
τ τ− ≤ ; otherwise it is classified as a false negative. Considering this partition, the PTP was defined as the ratio of the number of TP to the number of occurrence times.
The RFP was estimated by counting the number of detections per second when only the background noise was present in the input of the detector.
For a set of threshold values covering a range of appropriate values, it was then possible to derive the ROC curve of the detector (PTP vs. RFP). The ROC curve is a monotonically increasing curve and for low threshold values, PTP and TFP tend to 1 and infinity, respectively, whereas for high threshold values, they both tend to zero. The efficiency of the detector increases as the ROC curve approaches the point (PTP=1, RFP=0 FP/s).
VI. RESULTS A. In simulated data
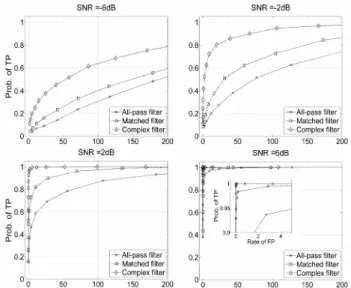
The three detectors were applied on the four simulated signals presented in section IV-A. All ROC curves were computed for a confidence temporal window, W , of 2 ms. The ROC curves for each of the simulated signals, characterized by their SNR values, were plotted together and are presented in Fig. 3. This figure shows that for all the chosen SNR values, the complex filter detector and the all-pass filter detector are the most and the less efficient detector, respectively. This observation is especially prominent for low SNR values (see SNR = -6 and –2 dB). For example, in the case of SNR=-2 dB and for a given false positive rate of 50 FP/s, the complex filter doubled the probability of a true positive (i.e. the PTD were approximately 0.4 and 0.85 with the all-pass and the complex filter, respectively). When the SNR is equal to 2 dB, the accuracy of the complex filter detector became excellent compared to those of the two other detectors. We also observed that the accuracy of the matched filter detector better than the accuracy of the all-pass filter detector for SNRs of +2 dB. Finally, when the SNR was equal to 6 dB, all three of detectors offered good accuracies, especially for the matched and complex filter detectors.
B. In real data
The three detectors were applied to the extracellular single
unit activity presented in section IV-B. The template used for the matched filter was constructed by aligning and averaging fifty representative spikes manually selected in the studied activity. The parameters of the complex filter were the following: f =500 Hz and k =3. Output signals of the 0
three filters are shown in Fig. 4. These signals show that the matched filter, and especially the complex filter, enhance the contrast between spikes and noise, even for low SNRs.
Fig. 3. The ROC curves for the four tested SNR values. The ROC curves of the three detectors were superimposed on a single plot for each of the four SNR values. For all the SNR values, the complex filter detector gives the best performance. The performance gap between this detector and the two other detectors is prominent for low SNRs. For a SNR equal to +6dB, the ROC curves apparently overlap; however, upon closer inspection, it is evident that the complex-filter-based detector is the most accurate.
Fig. 4. Application of the different detectors on single unit action potentials recorded from the auditory nerve. The left column corresponds to the beginning of the recording and the right column 20 min. after. Note the decrease of the spike amplitude during the course of the experiment. No spikes can be clearly discriminated from the background noise with the all-pass filter. In contrast, the matched filter, and more efficiently, the complex filter greatly increase the SNR, leading to clearer spike detection.
VII. DISCUSSION
In this study, we compared three detectors for localizing single unit spikes in the activity of auditory nerve fibers. The detectors have two stages. The first stage is dedicated to the enhancement of signal to noise ratio; while the second stage is for constructing the decision rule. The decision rule was the same for all of the detectors in order to compare only the influence of the first stage. Three filters are compared: 1) the all-pass filter which is used in routine in numerous laboratories; 2) the matched filter was considered because it is a classical approach for handling the problem of detection of a pattern whose morphology is quasi deterministic. Finally, the complex filter was selected for its good performances in the context of transient-signal detection in EEG signals [3-7, 9].
A comparison of the detection accuracies showed that the complex filter detector provides the best accuracy especially in low SNR (smaller than 2 dB in our experiences). For SNR larger than 2 dB, the three detectors all offer good accuracies. This trend was confirmed with experimental data. We observed that the contrast between spikes and background noise in the output of the complex filter, is greatly enhanced. This filtering allows then for easy selection of the threshold value.
Moreover, in our application, the choice of a detector does not depend only on the detection accuracy. Indeed, the detectors investigated in this paper present advantages and deficiencies. The all-pass filter permits continual on-line operation but offers poor detection accuracy. In spite of its drawback, this detector is still used in many research laboratories, requiring the visual supervision of an informed experimenter. On one hand, the matched filter presents the advantage of being highly specific to the expected pattern. On the other hand, it is time-consuming, it requires human pre-selection of the spike template, and it exhibits medium detection accuracy especially for low SNR. Finally, the band-pass FIR filter with complex coefficients gives good detection performances but is also time-consuming.
The main interest of the matched and the complex filters is to increase the detection accuracy of extracellular spikes. This is very important for the auditory neuroscientists who want to record single unit action potentials from the auditory nerve since amplitudes of the action potentials change in various conditions. For example, changes in amplitude are seen even during the course of an experiment. Although high magnitude action potentials can be easily detected with an all-pass filter, small amplitude action potentials are difficult to discriminate from the background noise. Consequently, researchers may try to locate the recording electrode as close as possible to the fiber in order to get the best signal-to-noise ratio. However, being too close can mechanically stimulate the fiber, and even destroy it. In addition, respiratory movements of the animal induce mechanical displacements of the recording electrode, and consequently change the amplitude of the single action potential, leading the experimenter to adjust manually the spike discriminator
window. Clearly, the complex filter detector based on sharp form rather than on action potential amplitude, provides a good alternative for spike detection in auditory nerve fibers when there is a low signal to noise ratio.
Regarding filtering procedures, the parameters k and f 0
were set heuristically to 3 and 500 Hz, respectively. Setting
k to any integer other than -1, 0, 1, ensures one to have a
zero-mean band-pass complex filter. The central frequency and bandwidth of this filter are respectively kf and 0 2 f [9]. 0
Simulations will be conducted to determine values of ( , )k f 0
that optimise detection accuracy. The matched filter based detector can also be enhanced by exploring the covariance matrix of single unit action potentials. Quadratic detectors maximizing deflection criteria could then be considered [3].
Increasing the complexity of the detection structure may lead to better detection results especially for low SNR. This could open the way for using lower impedance electrodes and thus considering multiunit auditory nerve data processing. However, a trade-off between execution time and performance is necessary to guarantee real-time functioning of the system or at least very fast off-line processing. In all cases, a procedure for determining the decision threshold needs to be defined. Controlling the false alarm rate under the assumption of null hypothesis will be investigated.
REFERENCES
[1] N. Y. Kiang, M. B. Sachs, and W. T. Peake, "Shapes of tuning curves for single auditory-nerve fibers," J Acoust Soc Am, vol. 42, pp. 1341-2, 1967.
[2] B. Saltzberg, L. S. Lustick, and R. G. Heath, "Detection of focal depth spiking in the scalp EEG of monkeys," Electroencephalogr Clin
Neurophysiol, vol. 31, pp. 327-33, 1971.
[3] L. Senhadji, J. J. Bellanger, and G. Carrault, "EEG Spike detectors based on different decompositions : a comparative study. ," in Time
Frequency and Wavelets in Biomedical Signal Processing., A. Metin,
Ed. New York: IEEE Press, 1997, pp. 407-421.
[4] L. Senhadji, J. L. Dillenseger, F. Wendling, C. Rocha, and A. Kinie, "Wavelet analysis of EEG for three-dimensional mapping of epileptic events," Ann Biomed Eng, vol. 23, pp. 543-52, 1995.
[5] L. Senhadji and F. Wendling, "Epileptic transient detection: wavelets and time-frequency approaches," Neurophysiol Clin, vol. 32, pp. 175-92, 2002.
[6] J. Bourien, F. Bartolomei, J. J. Bellanger, M. Gavaret, P. Chauvel, and F. Wendling, "A method to identify reproducible subsets of co-activated structures during interictal spikes. Application to intracerebral EEG in temporal lobe epilepsy," Clin Neurophysiol, vol. 116, pp. 443-55, 2005.
[7] J. Bourien, J. J. Bellanger, F. Bartolomei, P. Chauvel, and F. Wendling, "Mining reproducible activation patterns in epileptic intracerebral EEG signals: application to interictal activity," IEEE Trans Biomed Eng, vol. 51, pp. 304-15, 2004.
[8] J. Ruel, C. Chen, R. Pujol, R. P. Bobbin, and J. L. Puel, "AMPA-preferring glutamate receptors in cochlear physiology of adult guinea-pig," J Physiol, vol. 518 ( Pt 3), pp. 667-80, 1999.
[9] L. Senhadji, G. Carrault, and J. J. Bellanger, "Interictal EEG spike detection: A new framework based on wavelet transform.," presented at IEEE-SP International Symposium on Time-Frequency and Time-Scale Analysis, Philadelphia, 1994.