HAL Id: inserm-00719779
https://www.hal.inserm.fr/inserm-00719779
Submitted on 20 Jul 2012HAL is a multi-disciplinary open access archive for the deposit and dissemination of sci-entific research documents, whether they are pub-lished or not. The documents may come from teaching and research institutions in France or abroad, or from public or private research centers.
L’archive ouverte pluridisciplinaire HAL, est destinée au dépôt et à la diffusion de documents scientifiques de niveau recherche, publiés ou non, émanant des établissements d’enseignement et de recherche français ou étrangers, des laboratoires publics ou privés.
Phospholipid fingerprints of milk from different
mammalians determined by 31P NMR: towards specific
interest in human health
Cyrielle Garcia, Norbert Lutz, Sylviane Confort-Gouny, Patrick Cozzone,
Martine Armand, Monique Bernard
To cite this version:
Cyrielle Garcia, Norbert Lutz, Sylviane Confort-Gouny, Patrick Cozzone, Martine Armand, et al.. Phospholipid fingerprints of milk from different mammalians determined by 31P NMR: towards specific interest in human health: Milk phospholipid fingerprints by 31P NMR. Food Chemistry, Elsevier, 2012, 135 (3), http://dx.doi.org/10.1016/j.foodchem.2012.05.111. �10.1016/j.foodchem.2012.05.111�. �inserm-00719779�
Accepted Manuscript
Phospholipid fingerprints of milk from different mammalians determined by
31P NMR: towards specific interest in human health
Cyrielle Garcia, Norbert W. Lutz, Sylviane Confort-Gouny, Patrick J. Cozzone, Martine Armand, Monique Bernard
PII: S0308-8146(12)00960-0
DOI: http://dx.doi.org/10.1016/j.foodchem.2012.05.111
Reference: FOCH 12686
To appear in: Food Chemistry Received Date: 12 December 2011 Revised Date: 1 May 2012 Accepted Date: 29 May 2012
Please cite this article as: Garcia, C., Lutz, N.W., Confort-Gouny, S., Cozzone, P.J., Armand, M., Bernard, M., Phospholipid fingerprints of milk from different mammalians determined by 31P NMR: towards specific interest in human health, Food Chemistry (2012), doi: http://dx.doi.org/10.1016/j.foodchem.2012.05.111
This is a PDF file of an unedited manuscript that has been accepted for publication. As a service to our customers we are providing this early version of the manuscript. The manuscript will undergo copyediting, typesetting, and review of the resulting proof before it is published in its final form. Please note that during the production process errors may be discovered which could affect the content, and all legal disclaimers that apply to the journal pertain.
Phospholipid fingerprints of milk from different mammalians determined by
31P NMR:
towards specific interest in human health
Cyrielle Garciaa,b,c,*
, Norbert W. Lutzb,c
, Sylviane Confort-Gounyb,c
, Patrick J. Cozzoneb,c
, Martine Armanda,1
, Monique Bernardb,c,1.
a
INSERM, U476, F-13385 Marseille, France;
b
CNRS, UMR 7339, CRMBM, F-13385, France.
c
Aix-Marseille Univ, UMR 7339, 13385, Marseille, France;
*Corresponding author: Cyrielle Garcia, UMR CNRS 7336, Faculté de Médecine de la Timone, 27 Boulevard Jean Moulin, 13385 Marseille cedex 05, France. Fax: +33 4 91 25 65 39; Tel: +33 4 91 38 08
E-mail address: cyrielle.garcia@univmed.fr (C. Garcia).
1
are joint senior authors with equal contribution to the study.
Abbreviations: CaM, camel milk; CL, cardiolipin; CoM, cow milk; EPLAS, phosphatidylethanolamine
plasmalogen (alkenyl-acyl chains); HM, human milk; LPA, lysophosphatidic acid; LPC, lysophosphatidylcholine; LPE, lysophosphatidylethanolamine; LPS, lysophosphatidylserine; MM, mare milk; PA, phosphatidic acid; PC, phosphatidylcholine; aaPC, alkyl-acyl phosphatidylcholine; PE, phosphatidylethanolamine; PG, phosphatidylglycerol; PI, phosphatidylinositol; PL, phospholipid; PLs, phospholipids; PS, phosphatidylserine; SM, sphingomyelin; TG, triglyceride
ABSTRACT
Our objective was to identify and quantify phospholipids in milk from different species (human HM, cow CoM, camel CaM, mare MM) using an optimised 31P NMR spectroscopy procedure. The phospholipid fingerprints were species-specific with a broader variety of classes found in HM and MM; HM and CaM were richer in sphingomyelin (78.3 and 117.5 µg/ml) and plasmalogens (27.3 and 24 µg/ml), possibly important for infant development. Total phospholipid content was higher in CaM (0.503 mM) and lower in MM (0.101 mM) compared to HM (0.324 mM) or CoM (0.265 mM). Our optimised method showed good sensitivity, high resolution, and easy sample preparation with minimal loss of target molecules. It is suitable for determining the accurate composition of a large number of bioactive phospholipids with putative health benefits, including plasmalogens, and should aid in selecting appropriate ingredient sources for infant milk substitutes or fortifiers, and for functional foods dedicated to adults.
Keywords: Milk, Animal species, 31
1. Introduction
Phospholipids (PLs) play key biologic roles in lipid digestion, absorption and transport (Favé, Coste, & Armand, 2004), in inflammatory processes (Duan & Nilsson, 2009), and in signalling pathways (Shimizu, 2009), along with being essential components of the lipid bilayer of all cell membranes (van Meer, Voelker, & Feigenson, 2008). PLs are either provided directly from the diet (Souci, Fachmann, & Kraut, 2008) or via
de novo synthesis (Favé et al., 2004). Dietary PLs are typically consumed in low amounts, about 2 to 5 g per
day (Favé et al., 2004), through the intake of almost all foods, but especially eggs, soybean, meat, milk and other dairy products (Souci et al., 2008).
PLs are increasingly considered as nutrients with putative health benefits. Numerous studies showing beneficial effects of PLs in lipid metabolism have been conducted using lecithins (mainly from soybean or eggs) (Mastellone et al., 2000; Wilson, Meservey, & Nicolosi, 1998). However, the composition of lecithins is highly variable, leading to confusing data since PL classes are not always fully characterised. Furthermore, few studies have highlighted specific benefits of individual PL classes. Phosphatidylcholine (PC) is effective in ameliorating or curing liver disease (Cohn, Wat, Kamili, & Tandy, 2008). Phosphatidylserine (PS) is particularly important during the development of the central nervous system (De Simone, Ajmone-Cat, & Minghetti, 2004), and dietary supplementation improves cognition in humans (Pepeu, Pepeu, & Amaducci, 1996). Phosphatidylethanolamine (PE) or phosphatidylinositol (PI) exert hypocholesterolemic effects in rats (Imaizumi, Sekihara, & Sugano, 1991; Shirouchi et al., 2009). Other classes are involved in inflammatory responses (lysophosphatidylcholine (LPC), sphingomyelin (SM)) or in chemoattraction (cardiolipin, LPC) (Chaurio et al., 2009). SM reduces cholesterol absorption (Eckhardt, Wang, Donovan, & Carey, 2002), and is involved in gut maturation during the suckling period (Motouri et al., 2003). Plasmalogens, phospholipids with a vinyl-ether bond at the sn-1 position, seem of high interest as they are important components of the
brain (Martinez & Ballabriga, 1978), and show antioxidant properties (Yavin, Brand, & Green, 2002).
Among dietary sources, milk contains PLs as important bioactive compounds that are likely to have a positive effect on term and preterm infants as well as on adult health. PLs are the main component of the milk lipid globule membrane allowing the dispersion of triglycerides (about 98% of total milk lipids) as globules of
specific size in the aqueous phase of native milk (Jensen, 1999). Milk PL composition is currently analysed by thin layer chromatography (Bitman, Wood, Mehta, Hamosh, & Hamosh, 1984; van Beusekom, Martini, Rutgers, Boersma, & Muskiet, 1990), HPLC (Rombaud & Dewettinck, 2006), or more recently by tandem mass spectrometry (Gallier, Gragson, Jimenez-Flores, & Everett, 2010), with a prior separation of PLs and neutral lipids. An alternative method is 31
P-NMR spectroscopy that was used to determine PL classes of cow, buffalo and ewe milk (Andreotti, Trivellone, & Motta, 2006; MacKenzie, Vyssotski, & Nekrasov, 2009; Murgia, Mele, & Monduzzi, 2003), but showed some limitations that could be solved by adapting protocols previously used for characterising the PLs of tissues (Larijani, Poccia, & Dickinson, 2000; Lutz & Cozzone, 2010). We aimed to establish an improved sensitive 31
P NMR quantification procedure with minimal sample preparation for analysing the exact composition of PL classes at levels varying from 0.2 to 2% of total lipids in different milk sources (human, cow, mare and camel) (El-Agamy, 2009; Jensen, 1999; Morrison, 1968; Rombaud et al., 2006). Our final objective was to compare milk PL content from different mammalians and to obtain information relevant to potential health benefits in humans.
2. Materials and methods
2.1. Reagents and standards
The organic solvents (HPLC grade chloroform, methanol and hexane) and perchloric acid were purchased from Carlo Erba (Val de Reuil, France). Phosphatidylinositol and phosphatidylethanolamine plasmalogen were from Avanti Polar Lipids (Alabaster, AL, USA). Other phospholipid standards, cesium hydroxide, hydrochoric acid, cyclohexanediamine-tetraacetic acid (CDTA), sodium chloride, acetic acid, triethyl phosphate, methylenediphosphonic acid (MDPA), deuterated chloroform (CDCl3), boron trifluoride-methanol
(BF3) and phosphatidylcholine diheptadecanoyl were from Sigma-Aldrich (Saint Quentin Fallavier, France). Sunflower oil was used as a source of triglycerides (Lesieur, Coudekerque, France).
Camel (CaM) and mare (MM) milk specimens (n=8 for each, from 8 different animals) were obtained, respectively, from the Laboratoire d’Elevage et de la Faune sauvage (IRA, Medine, Tunisia) and the Haras Haflinger (Bourgogne, France). Thermically treated cow milk (CoM) samples (n=15, pools from 4 cows for each) were from the UMR INRA 1253 Science et Technologie du Lait et de l'Oeuf (Rennes, France). Within the same animal species, there was no variation regarding age, breed, farming, diet, and all collected samples were mature milk. Mature human milk (HM) samples (n=22, from 22 different mothers) were obtained from Neonatology departments after local committee approval and informed consent (Hôpital Nord and Hôpital de la Conception, Marseille, France; Study RBM2009-09). They were collected from full draft at the hospitals as the mothers were recruited, and stored frozen until transfer to the laboratory.
2.3. Milk sample preparation
Total milk lipids were extracted according to a modified Folch’s method as previously published (Garcia et al., 2011). Briefly, 4 ml milk sample was mixed with 20 volumes of chloroform/methanol 2:1, v/v. Then 20% of a 0.9% NaCl/2% acetic acid solution at pH 3 was added before centrifugation for 20 min at 2000 rpm. The lower organic phase containing lipids was harvested and evaporated under nitrogen. The dried lipids were weighed using a high-precision balance, and were stored at -20°C until analysis.
2.4. NMR measurements 31
P NMR analyses were conducted on an Avance 400 Bruker NMR spectrometer (9.4 T) using 5mm tubes and a quadruple nuclear probe. The number of transients was 4096 per spectrum acquisition to achieve an optimal signal-to-noise ratio. 31
P NMR spectra were acquired with a 9s inter-pulse delay, 4194 Hz spectral width, 90° pulse angle (9.5 µs), 32K data points and 1H decoupling (Waltz 16, decoupling power = 19 dB, pulse width = 100 µs).
Prior to milk sample analysis, a combination of six different pure PL classes (PC, SM, PE, PS, PI, LPC) in proportions close to those of human milk (Jensen, 1999) (5 mM final concentration) were analysed by NMR in presence or absence of 49 mM triglycerides, in order to test the possible interference from neutral lipids.
The extracted milk total lipids were dissolved in a ternary solvent system adapted from a previously published procedure (Larijani et al., 2000) and consisting of a mixture of deuterated chloroform (CDCl3)/methanol/cesium cyclohexanediamine tetraacetic acid (CsCDTA) 5mM in H2O (100:40:20, v/v/v), resulting in two phases. Afterwards, the PL standard mixture and lipid extracts from milk samples were analysed at four different pH values (6.2, 7.2, 7.7, 8.2) to determine the optimum protonation for best peak resolution. The field was locked on the CDCl3 signal. MDPA was chosen as an external reference (19.39 ppm)
because its resonance does not interfere with PL peaks. For the calculation of PL concentrations based on integrals (intensities) of 31
P NMR peaks, a calibration of the external reference was performed with 2.5 mM, 5 mM and 10 mM of triethyl phosphate in H2O/D2O 80:20, v/v. PL assignments were based on spiking with the
corresponding pure standard compounds, except for alkyl-acyl phosphatidylcholine (aaPC), whose assignment was based on its relative chemical-shift difference from the PC signal. The signal-to-noise ratio was improved by multiplication of the FID (free induction decay) with an exponential function (LB = 0.5 Hz), and the spectra were integrated using deconvolution (MDCON software, Bruker) as previously described (Lutz et al., 2010). The volume of the PL-containing lower (chloroform) phase in the biphasic system was measured and used to adjust the quantification. Initial milk volumes used for lipid extraction were also taken into account.
2.5. Phospholipid isolation and quantification
PLs from another 4 ml milk lipid extract were purified on a SPE column (Alltech, Maxi-clean silica, 900 mg Cartridges) using elutions with first hexane/diethylether 8:2, v/v then 1:1, v/v, then methanol and finally chloroform/methanol/water 3:5:2, v/v/v. Purified PL fractions were evaporated under nitrogen. Total PLs were quantified by GC analysis of their fatty acid content (Perkin Elmer Autosystem XL, Courtaboeuf, France) after methylation with BF3-methanol as previously described (Garcia et al., 2011) and using an internal standard (phosphatidylcholine diheptadecanoyl). These data were compared to PL quantities determined using 31
P NMR.
The size of milk lipid globules was measured by laser light scattering (Mastersizer Microplus, Malvern Instruments, UK) for all fresh milk specimens except for human milk because the samples were obtained frozen. The mean [d(4,3), µm] and median diameters [d(v0,5), µm] were calculated by the particle-sizer software from the droplet size distribution.
2.7. Statistical analysis
Values obtained from each group are presented as medians [1st percentile; 99th percentile], unless otherwise indicated, due to asymmetrical distribution of our data. Means ± SD are presented as supplementary data. Kruskal-Wallis and Mann Whitney test were used to analyse differences between groups, and P < 0.05 was considered as significant. Correlation coefficients were determined by the Spearman test.
3. Results
3.1. Set-up of the high-resolution 31 P NMR spectroscopy procedure
First, the influence of triglycerides on 31P phospholipids resonances was tested because of their high proportion in milk. The presence of triglycerides did not interfere with PL standard identification and quantification (data not shown). Optimal PL separation and signal intensity was found at pH 7.7 for both the PL standards and the milk lipid extracts. The effect of temperature on spectral resolution was also tested. At 10°C, the peaks corresponding to SM and PS overlapped totally (data not shown). Decreasing the temperature to 5°C for mare milk samples and increasing it to 25°C for other milk species allowed for the resolution of these overlapping peaks. The experimental conditions were validated for quantification by finding the expected quantities of each class in the PL standard mixture (data not shown).
3.2. Total lipid and phospholipid content
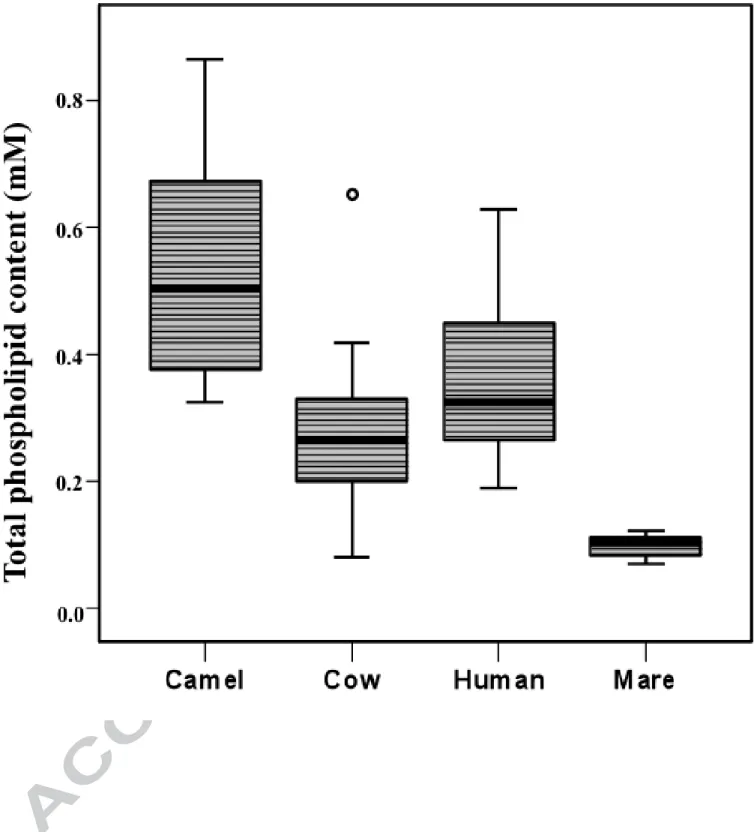
The mean concentrations (± SD) of total lipids (g/100 ml of milk) were 6.04 ± 2.95 in HM, 4.56 ± 1.87 in CaM, 3.71 ± 0.61 in CoM, and 0.68 ± 0.2 in MM, and are in agreement with values found in the literature (El-Agamy, 2009; Jensen, 1999; Malacarne, Martuzzi, Summer, & Mariani, 2002). Median total PL content (mM)
was the highest in CaM and the lowest in MM compared to HM and CoM, and only MM showed the least dispersed distribution pattern for PL content within samples (Fig. 1). Data expressed as weight per volume were calculated using an average molecular weight for each PL class; PL concentrations varied from 0.2% to 1.8% of total milk lipid content and were significantly higher in MM and CaM compared to CoM and HM (Table 1). These data were in accordance with PL content quantified using GC analysis with an internal standard (data not shown).
3.3. Fingerprint of milk phospholipids in the different mammalians species
Different numbers of PL classes were detected in HM (12 different classes), then for MM (11), CaM (9), and finally for CoM (7) (Fig. 2). PC, PE and SM were the most prevalent PL accounting for 62-80%, followed by PS and PI (12-15%), and minor PL classes (lysophospholipids, plasmalogens, alkyl-acyl PC), however PL proportions varied between species (Table 2). Interestingly, the EPLAS proportion tended to be higher in HM where it represented about 11% of total PLs and 39% of ethanolamine-containing PL (compared to 18% in CaM, 16% in MM and 13% in CoM). PC concentrations were similar in CoM, CaM and HM but lower in MM (Table 1). CaM exhibited the highest levels of PE, PS, and PI. CaM and HM shared highest concentrations in SM and EPLAS. MM showed similar levels for PC, SM and PE, and for PS and PI. AaPC was detected in 37.5%, 25% and 45% of CaM, MM and HM samples, respectively, but at very low concentrations, and none was found in CoM. LPC was only present in MM and HM, as was LPA. CoM had no LysoPL, except for LPE that was present at low amounts and less regularly than in HM and MM (in 20%, 100%, and 91% of the samples, respectively).
3.4. Milk lipid globule size
The diameter of lipid globules in CoM was two-fold larger than that in CaM and MM (Table 3), and close to values already reported in HM (Favé et al., 2004). The TG/PL ratio was higher in HM and CoM (178 and 181, respectively) compared to CaM and MM (115 and 93, respectively).
4. Discussion
and conclusion
As health beneficial effects are linked to specific PLs, professionals working in the field of ingredients and functional foods, as well as in clinical nutrition, need to know the exact amounts of PL classes present in dietary sources. Comparative studies for the determination of PLs in dietary matrices, such as lecithins, have shown that TLC, HPLC and 31
P NMR methods gave comparable results (Helmerich & Koehler, 2003). For milk, however, the large variety of PLs classes generated difficulties in their separation, resulting in an underestimation of, for example, PS, PI, plasmalogens and lysophospholipids, or in an overestimation of other PLs. For instance, PE was quantified together with EPLAS, and SM with LPC, in human milk using HPLC (van Beusekom et al., 1990). Only PE, PI, PS, PC and SM were detected in cow milk by using an optimised HPLC method (Rombaud et al., 2006), or in human milk by using one-dimensional TLC (Bitman et al., 1984), while a two-dimensional TLC enabled the additional detection of LPE in cow and camel milk and of LPE/LPC in Indian buffalo and human milk (Morrison, 1968). Furthermore, triglycerides and other neutral lipids are often removed by solid-phase extraction on a silica cartridge prior to quantitative analysis of milk PLs (Bitman et al., 1984; Gallier et al., 2010) that is time consuming, not always reproducible, and leads to a possible loss of some PL classes. Previous 31
P NMR characterisation of PLs conducted mainly on cow milk (Andreotti et al., 2006; MacKenzie et al., 2009; Murgia et al., 2003) can be directly compared with our data (Table 4). The use of the monophasic solvent system trimethylamine/dimethyl-formamide/guanidinium hydrochloride resulted in an underestimation of PE quantification due to the formation of different adducts (Andreotti et al., 2006; Murgia et al., 2003) when compared to a protocol using a detergent system at pH 7.1 (MacKenzie et al., 2009), or to our biphasic system at pH 7.7, which showed the best resolution of the PE peak; in addition, the PS peak was not well-resolved and was underestimated that was solved also by the two latter protocols. Ether lipids (ethanolamine plasmalogen and alkyl-acyl-phosphatidylcholine) were not detected in two published works (Andreotti et al., 2006; MacKenzie et al., 2009), but an EPLAS level close to the one we found was reported by Murgia and co-workers in spite of their very different protocol and of their weak resolution of this peak (Murgia et al., 2003). By comparison to these three published protocols, our current approach provides better resolution (well separated and narrower peaks, especially for PI), probably
due to the setting of an optimal temperature (25°C for cow, camel and human milk, and 5°C for mare milk); this might also explain why our cow milk PI level is lower than the published values.
We succeeded in setting-up a quantitative 31
P NMR procedure suitable to identify and quantify a large number of PLs, including minor classes such as PI, lysophospholipids, plasmalogens, aaPC, CL, PA and LPA. Our optimised protocol exhibits good sensitivity, which is associated with high resolution and easy sample preparation (no extensive extractions or column separation to remove triglycerides, and hence avoids the loss of target molecules). Total PL quantities were in accordance with values in the literature: 0.2-1% of total lipids in cow milk, 0.4-1.4% in human milk, 0.5-1% in camel milk, and 1.65% in horse milk (Bitman et al., 1984; El-Agamy, 2009; Jensen, 1999; Morrison, 1968; Rombaud et al., 2006).
The amount of bioactive phospholipids that are reported to have putative health benefits, including plasmalogens were then compared. The PL fingerprints were very specific to the animal species, with human and mare milk providing a broader variety of classes, and human and camel milk being specifically richer in sphingomyelin and in plasmalogens. The proportions for PE, PC, PS, PI and SM in cow milk were in accordance with the literature (Rombaud et al., 2006), but a higher proportion of plasmalogen-PE was detected compared to a recent report that used tandem mass spectrometry after extraction of PLs from neutral lipids on a silica cartridge (1%) (Gallier et al., 2010). SM and PC are the main PLs in human milk, followed by PE, PS and PI, in accordance with previous studies (Bitman et al., 1984; Jensen, 1999). Moreover, we confirmed the presence of plasmalogens from the PE family in human milk (van Beusekom et al., 1990; Garcia et al., 2011) and provided, for the first time, accurate concentrations, showing that human milk is an important source of plasmalogens with potential impact on infant health (Garcia et al., 2011). The proportions found for PE, SM, PC and PI in camel milk were in agreement with the sole report in the literature obtained using a two-dimensional TLC method (Morrison, 1968), but not for PS that was twice as high in our samples; our method clearly showed the presence of PE plasmalogens, suggesting that camel milk is a second source of interest for plasmalogens, besides human milk. PLs composition of mare milk, reported here for the first time, is more balanced than the other studied milk types, and is also of interest because of the presence of
plasmalogens. Of note, milk from camel and from mare contains nearly 1% of total lipids as PLs, i.e. more emulsifiers of fat, than human and cow milk, explaining why the milk lipid droplets have a smaller size. Specific PL fingerprints can be due to the specific nutrition of the animal species (herbivorous for mare, cow and camel, omnivorous for human) and, probably, to genetic determinants of the selected breed or individuals.
The present results demonstrate that each kind of milk is of specific interest for human health due to its PL fingerprints. To reach health benefits, the quantity of dietary PL classes to be ingested varies depending on the population age (infants versus adults), and can be estimated by combining data from experimental studies and amounts of PL species available from milk sources.
Milk, either from mothers or classically from cow, or from camel in developing countries, or from mare in specific regions in France (Bourgogne) or in Asia, is the main food source in newborns and infants, at least up to 6 months, and continues to be consumed during childhood. Considering PLs for infant and child health, we can focus on plasmalogens and sphingomyelin. Brain content of plasmalogens increases remarkably between the 32nd
week of gestation and the 4th
and 6th
postnatal month (Martinez et al., 1978). Moreover, plasmalogens exert antioxidant capabilities via their vinyl-ether bond (Yavin et al., 2002), and neonates who have lower erythrocyte levels of plasmalogens than older children (Labadaridis et al., 2009) could be more vulnerable to oxidative stress. As, dietary plasmalogens are absorbed by the intestine and delivered intact to tissues (Nishimukai, Wakisaka, & Hara, 2003), their intake during early life might be essential, but optimal daily
consumption is not known yet. However, based on an animal study, it was estimated that the SM consumption by breast-fed infants should be from 50 to 150 mg per day for promoting gut development (Motouri et al., 2003). Taking into account the median level of plasmalogen-PE and SM and a consumption of 800 ml of human milk per day, a term newborn would ingest about 22 mg of plasmalogens and 62 mg of SM daily. For a preterm newborn, an intake of 170 ml of human milk per day will provide 4.6 mg of plasmalogens and 13 mg of SM. Thus, it clearly appears that camel milk, which is readily available in arid countries, can potentially replace human milk providing similar amounts of plasmalogens and SM to term newborns, but that premature infants will fail to achieve the amount of those PLs due to the low volume of milk ingested (Table
5). Cow and mare milk can be beneficial in infant nutrition through the use of their PL, once purified and concentrated, to supplement human milk fortifiers or to develop new milk substitutes. In the specific case of premature infants, dedicated fortifiers or milk substitutes enriched with different PL classes is indispensable to enable sufficient intakes.
With regards to adults, the daily intake of PL classes was calculated by estimating that the consumption of cow milk and dairy products represents about 775 mL of milk per day (Table 6). Due to its high amount of total PLs, as well as by comparison to other milk species, camel milk also appears as a promising dietary source of PI, PS, SM, PE and plasmalogens for adults. Several studies have reported cardioprotective, hepatoprotective or brain protective effects of PL making the use of these naturally occurring compounds very attractive. The question that has to be addressed is the optimal dose and the specific PL classes to be selected. SM given at a dose of 205 mg/d reduces intestinal cholesterol absorption in mice by 85% (Eckhardt et al., 2002), cholesterol metabolism is normalized in Zucker rats fed 2% PI by weight in the diet (Shirouchi et al., 2009), and feeding rats 2% PE by weight in the diet (equivalent to about 1g/day in humans) reduces blood cholesterol levels (Imaizumi et al., 1991). PC exhibits hepatoprotective effects by reducing alcohol-induced hepatocyte apoptosis, inhibiting fibrosis, and reducing hepatic steatosis when orally administrated in rats at a dose of 2-6 % by weight in the diet (Cohn et al., 2008). PC given at a daily dose of 1.25% from total fat intake (equivalent to an intake of 0.625 to 1.25 g PC per day in humans) reduces liver cholesterol in mice fed a high-fat diet by decreasing intestinal uptake and increasing fecal excretion (Tandy et al., 2010). A daily oral administration of about 1-1.5 g plasmalogens in rats results in a decrease in triglyceride and cholesterol concentrations in the liver (Nishimukai et al., 2003). PS reduces brain degenerative diseases in humans at a daily intake of 200 to 600 mg (Pepeu et al., 1996). It is difficult to extrapolate effective amounts of specific PL classes from animal studies to humans, but it seems possible to envisage the use of dietary phospholipid-rich milk extracts from cow (Ohlsson, Burling, Duan, & Nilsson, 2010; Watt et al., 2009) or camel for improving adult human health at relatively low cost.
Milk represents an important source of bioactive PLs that can be used as ingredients by industries
involved in either agrofood or clinical nutrition. Phospholipid fingerprints of milk determined by
high-resolution 31P NMR spectroscopy using our optimised protocol are of particular practical interest for the
choice of optimal ingredients to produce functional foods or dietary supplements for the prevention or
treatment of specific diseases, or to produce new formulae for infants or adults in the field of artificial
nutrition. Such products need to be developed due to potential beneficial effects, and appropriate human
studies should be conducted in the near future with well-characterized PL compounds to clearly determine the
effective doses.
Acknowledgments
This work was supported by the Conseil Régional Provence-Alpes-Côte d’Azur (PACA) and Application Santé des Lipides (ASL) (thesis CG), program EGIDE UTIQUE from the French Ministries (Ministère des affaires étrangères et Européennes, Ministère de l’enseignement supérieur et de la recherche), grant from CNRS (UMR 6612).
The authors thank Mrs C. Antona for technical support, Dr Jean Gaudart (Aix-Marseille Univ, UMR 912 (SESSTIM), APHM, UF Biostatistiques 13005, Marseille, France) for advice in statistics, and Dr J Philpott (Oklahoma University, OK, USA) and Pr Judith Storch (Rutgers University, New Brunswick, NJ, USA) for
English reading. The following persons are acknowledged for providing milk samples : Dr V. Millet and Pr U.
Simeoni (Neonatology department, hôpital de la conception, Marseille), Dr C. Gire and Dr V. Brévault-Malaty (Neonatology department, hôpital Nord, Marseille), Mr Y. Gaget (Haras Haflinger, Bourgogne, France), Dr A. Souli (Science university of Gabès, Tunisia), Mr T. Khorchani (Laboratoire d’élevage et de la faune sauvage, Institut des regions arides, Mednine, Tunisia) and Dr. C. Lopez (UMR INRA 1253, Rennes, ANR Agilait Project).
References
Andreotti, G., Trivellone, E., & Motta, A. (2006). Characterization of buffalo milk by 31P-nuclear magnetic resonance spectroscopy. Journal of Food Composition and Analysis, 19, 843-849.
Bitman, J., Wood, D. L., Mehta, N. R., Hamosh, P., & Hamosh, M. (1984). Comparison of the
phospholipid composition of breast milk from mothers of term and preterm infants during lactation.
American Journal of Clinical Nutrition, 40, 1103-1119.
Chaurio, R. A., Janko, C., Munoz, L. E., Frey, B., Herrmann, M., & Gaipl, U. S. (2009). Phospholipids: key players in apoptosis and immune regulation. Molecules, 14, 4892-4914.
Cohn, J. S., Wat, E., Kamili, A., & Tandy, S. (2008). Dietary phospholipids, hepatic lipid metabolism and cardiovascular disease. Current Opininion in Lipidology, 19, 257-262.
Duan, R. D., & Nilsson, A. (2009). Metabolism of sphingolipids in the gut and its relation to inflammation and cancer development. Progress in Lipid Research, 48, 62-72.
De Simone, R., Ajmone-Cat, M. A., & Minghetti, L. (2004). Atypical anti-inflammatory activation of microglia induced by apoptotic neurons: possible role of phosphatidylserine-phosphatidylserine receptor interaction. Molecular Neurobiology, 29, 197-212.
Eckhardt, E. R., Wang, D. Q., Donovan, J. M., & Carey, M. C. (2002). Dietary sphingomyelin suppresses intestinal cholesterol absorption by decreasing thermodynamic activity of cholesterol monomers.
Gastroenterology, 122, 948-56.
El-Agamy, E.I. (2009). Bioactive components in milk and dairy products. In Y. W. Park (Eds), Bioactive
components in camel milk (pp. 159-194). Wiley-Blackwell: E-publishing Inc.
Favé, G., Coste, T. C., & Armand, M. (2004). Physicochemical properties of lipids: new strategies to manage fatty acid bioavailability. Cellular and Molecular Biology, 50, 815-883.
microscopy to probe the milk fat globule membrane and associated proteins. Journal of Agricultural and
Food Chemistry, 58, 4250-4257.
Garcia, C., Millet, V., Coste, T. C., Mimoun, M., Ridet, A., Antona, C., et al. (2011). French mothers’
milk deficient in DHA contains phospholipid species of potential interest for infant development. Journal
of Pediatric Gastroenterology and Nutrition, 53, 206-212.
Helmerich, G., & Koehler, P. (2003). Comparison of methods for the quantitative determination of phospholipids in lecithins and flour improvers. Journal of Agricultural and Food Chemistry, 51, 6645- 6651.
Imaizumi, K., Sekihara, K., & Sugano, M. (1991). Hypocholesterolemic action of dietary phosphatidylethanolamine in rats sensitive to exogenous cholesterol. Journal of Nutritional Biochemistry,
2, 251-254.
Jensen, R. G. (1999). Lipids in human milk. Lipids, 34, 1243-1271.
Labadaridis, I., Moraitou, M., Theodoraki, M., Triantafyllidis, G., Sarafidou, J., & Michelakakis, H. (2009). Plasmalogen levels in full-term neonates. Acta Paediatrica, 98, 640-642.
Larijani, B., Poccia, D. L., & Dickinson, L. C. (2000). Phospholipid identification and quantification of membrane vesicle subfractions by 31P-1H two-dimensional nuclear magnetic resonance. Lipids, 35, 1289-1297.
Lutz, N.W., & Cozzone, P. J. (2010). Multiparametric optimization of 31P NMR spectroscopic analysis of phospholipids in crude tissue extracts. 1. Chemical shift and signal separation. Analytical Chemistry, 82, 5433-40.
MacKenzie, A., Vyssotski, M., & Nekrasov, E. (2009). Quantitative analysis of dairy phospholipids by 31
P NMR. Journal of the American Oil Chemists’ Society, 86, 757-763.
Malacarne, M., Martuzzi, F., Summer, A., & Mariani, P. (2002). Protein and fat composition of mare’s milk: some nutritional remarks with reference to human and cow’s milk. International Dairy Journal, 12, 869-877.
cerebellum during the brain 'growth spurt' period. I. Gangliosides and plasmalogens. Brain Research, 159, 351-362.
Mastellone, I., Polichetti, E., Grès, S., de la Maisonneuve, C., Domingo, N., Marin, V., et al. (2000).
Dietary soybean phosphatidylcholines lower lipidemia: mechanisms at the levels of intestine, endothelial cell, and hepato-biliary axis. Journal of Nutritional of Biochemistry, 11, 461-466.
Morrison, W.R. (1968). The distribution of phospholipids in some mammalian milks. Lipids, 3, 101-103. Motouri, M., Matsuyama, H., Yamamura, J., Tanaka, M., Aoe, S., Iwanaga, T., et al. (2003).
Milk sphingomyelin accelerates enzymatic and morphological maturation of the intestine in artificially reared rats. Journal of Pediatric Gastroenterology and Nutrition, 36, 241-247.
Murgia, S., Mele, S., & Monduzzi, M. (2003). Quantitative characterization of phospholipids in milk fat via
31
P NMR using a monophasic solvent mixture. Lipids, 38, 585-591.
Nishimukai, M., Wakisaka, T., & Hara, H. (2003). Ingestion of plasmalogen markedly increased plasmalogen levels of blood plasma in rats. Lipids, 38, 1227-1235.
Ohlsson, L., Burling, H., Duan, R.D., & Nilsson, A. (2010). Effects on a sphingolipid-enriched dairy formulation on postprandial lipid concentrations. European Journal of Clinical Nutrition, 64, 1344-1349. Pepeu, G., Pepeu, I. M., & Amaducci, L. (1996). A review of phosphatidylserine pharmacological and
clinical effects. Is phosphatidylserine a drug for the ageing brain? Pharmacological Research, 33, 73-80. Rombaut, R., & Dewettinck, K. (2006). Properties, analysis and purification of milk polar lipids.
International Dairy Journal, 16, 1362-1373.
Shimizu, T. (2009). Lipid mediators in health and disease: enzymes and receptors as therapeutic targets for the regulation of immunity and inflammation. Annual Review of Pharmacology and Toxicology, 49, 123-50.
Shirouchi, B., Nagao, K., Furuya, K., Inoue, N., Inafuku, M., Nasu, M., et al. (2009). Effect of dietary phosphatidylinositol on cholesterol metabolism in zucker (fa/fa) rats. Journal of Oleo Science, 58, 111-115.
Souci, S. W., Fachmann, W., & Kraut, H. (2008). Food composition and nutrition tables (7th
Boca Raton, London, New York, Washington DC: Medpharm Scientific Publishers/CRC press. Tandy, S., Chung, R.W.S., Kamili, A., Wat, E., Weir, J. M., Meikle, P. J., et al. (2010). Hydrogenated
phosphatidylcholine supplementation reduces hepatic lipid levels in mice fed a high-fat diet.
Atherosclerosis, 213, 142-147.
van Beusekom, C., Martini, I. A., Rutgers, H. M., Boersma, E. R., & Muskiet, F. A. (1990). A
carbohydrate-rich diet not only leads to incorporation of medium-chain fatty acids (6:0-14:0) in milk triglycerides but also in each milk-phospholipid subclass. American Journal of Clinical Nutrition, 52, 326-334.
van Meer, G., Voelker, D. R., & Feigenson, G. W. (2008). Membrane lipids: where they are and how they behave. Nature Reviews Molecular Cell Biology, 9, 112-124.
Wat, E., Tandy, S., Kapera, E., Kamili, A., Chung, R. W., Brown, A., et al. (2009). Dietary phospholipid-rich dairy milk extract reduces hepatomegaly, hepatic steatosis and hyperlipidemia in mice fed a high-fat diet.
Atherosclerosis, 205, 144-150.
Wilson, T. A., Meservey, C. M., & Nicolosi, R. J. (1998). Soy lecithin reduces plasma lipoprotein
cholesterol and early atherogenesis in hypercholesterolemic monkeys and hamsters: beyond linoleate.
Atherosclerosis, 140, 147-153.
Yavin, E., Brand, A., & Green, P. (2002). Docosahexaenoic acid abundance in brain: a biodevice to combat oxidative stress. Nutritional Neuroscience, 5, 149-157.
Figures Legend
Fig. 1. Total phospholipid concentrations (mM) as determined by 31P NMR spectroscopy in camel (n=8), cow (n=15), human (n=23) and mare (n=8) milk samples. Horizontal bars represent medians; boxes represent 25th–75th percentiles, and whiskers indicate 5th-95th percentiles. One outlier was identified (small circle).
Fig. 2. High-resolution 31P NMR phospholipid spectra of lipid extracts from cow (A), camel (B), mare (C) and human milk (D); a representative spectrum was chosen for each species.
Table 1
Phospholipid concentrations of milk lipid extracts from different animal species by
31P-NMR spectrum.
PL classes Concentrationa (µg/ml)
Cow Camel Mare Human
LPA 0 [0 ; 0] 0 [0 ; 0] 0.5 [0 ; 1.6] 0 [0 ; 2.2] LPE 0 [0 ; 3]a 0 [0 ; 0]b 3.5 [2.4 ; 9.7]c 4.2 [0 ; 7.6]c PA 0 [0 ; 0]a 3.0 [0 ; 8.5]b 1.8 [0 ; 5.0]ab 0 [0 ; 4.9]ab CL 0 [0 ; 0] 0 [0 ; 16.8] 0 [0 ; 0] 0 [0 ; 1.5] EPLAS 7.1 [0.5 ; 30.7]a 24.0 [13.4 ; 66.3]b 2.4 [1.2 ; 8.5]c 27.3 [17.0 ; 54.9]b PE 61.8 [19.2 ; 143.0]a 125.0 [68.3 ; 182.7]b 15.3 [8.4 ; 23.4]c 41.5 [26.1 ; 102.8]a SM 46.1 [11.9 ; 98.9]a 117.5 [58.3 ; 174.6]b 18.0 [12.9 ; 22.9]c 78.3 [49.9 ; 132.9]b PS 21.3 [2.5 ; 56.5]a 50 [1.6 : 66.8]b 5.8 [1.8 ; 15.1]c 22.1 [11.3 ; 44.7]a LPC 0 [0 ; 0]a 0 [0 ; 0]ac 0.8 [0 ; 2.6]b 0 [0 ; 4.3]bc PI 7.6 [0.5 ; 26.7]ac 20 [10.3 ; 31.9]b 5.8 [3.7 ; 8.2]c 11.1 [2.2 ; 20.7]a aaPC 0 [0 ; 0]a 5.4 [0.1 ; 8.2]ab 0.8 [0.5 ; 1.1]ab 0 [0 ; 9.5]b PC 60.3 [18.2 ; 128.0]a 78.4 [42.2 ; 123.8]a 17.3 [11.3 ; 21.1]b 60.3 [32.1 ; 124.2]a unknown 4.2 [3.2 ; 4.6] 0 [0 ; 0] 0 [0 ; 0] 0 [0 ; 2.0] Total PL 204.0 [63.0 ; 483.7]a 393.4 [257.0 ; 660.3]b 77.8 [52.6 ; 87.9]c 250.3 [152.9 ; 473.6]a PL % of total lipids 0.55 [0.18 ; 1.27]a 0.87 [0.49 ; 1.79]b 1.08 [0.76 ; 1.73]b 0.56 [0.17 ; 1.07]a
a
Results are medians [1
st; 99
thpercentile] of 15 samples for cow, 8 samples for camel and mare, 22 samples
for human milk; the medians within each row labelled by different letters are significantly different (Mann
Whitney test, P < 0.05).
Table 2
Relative proportion of phospholipid classes in the milk from different animal species.
PL classes
Relative proportion
a(mol % of total PLs)
Cow Camel Mare Human
LPA 0 [0 ; 0] 0 [0 ; 0] 1 [0 ; 4.3] 0 [0 ; 1.4] LPE 0 [0 ; 2.4]a 0 [0 ; 0]a 8.3 [6.0 ; 17.2]b 2.5 [0 ; 5.8]c PA 0 [0 ; 0]a 0.9 [0 ; 1.9]b 3.1 [0 ; 8.0]ab 0 [0 ; 1.6]ab CL 0 [0 ; 0] 0 [0 ; 2.7] 0 [0 ; 0] 0 [0 ; 0.6] EPLAS 4.5 [0.4 ; 9.4]a 6.4 [5.2 ; 10.3]a 3.4 [1.5 ; 10.3]a 11.4 [7.7 ; 16.5]b PE 31.4 [27.9 ; 37.6]a 30.0 [27.6 ; 34.9]b 18.6 [13.3 ; 29.5]c 18.3 [12.4 ; 25.6]c SM 19.9 [17.9 ; 22.6]a 24.6 [21.2 ; 39.0]b 22.2 [15.6 ; 31.2]b 29.7 [25.7 ; 33.8]c PS 11.2 [3.1 ; 13.3] 9.2 [0.5 ; 22.2] 8.1 [2.5 ; 17.0] 8.1 [5.4 ; 15.2] LPC 0 [0 ; 0]a 0 [0 ; 0]a 2.0 [0 ; 4.8]b 0 [0 ; 3.2]c PI 3.6 [0.2 ; 6.6]a 4.3 [2.8 ; 4.9]a 6.5 [4.8 ; 7.5]b 3.8 [1.1 ; 5.2]a aaPC 0 [0 ; 0]a 0 [0 ; 1.8]ab 0 [0 ; 1.1]ab 0 [0 ; 2.7]b PC 28.7 [24.9 ; 35.7]a 19.3 [16.8 ; 20.5]b 21.3 [18.7 ; 28.2]c 24.5 [19.8 ; 30.2]c unknown 0 [0 ; 3.4] 0 [0 ; 0.1] 0 [0 ; 0] 0 [0 ; 2.0]
a
Results are medians [1
st; 99
thpercentile] of 15 samples for cow, 8 samples for camel and mare, 22
samples for human milk; the medians within each row labelled by different letters are significantly different
(Mann Whitney test, P < 0.05).
Table 3
Lipid globules size of the milk from different animal species.
Milk species
Diameter
a(µm)
d
(4,3)d
(v0,5)Cow
3.78 [0.22 ; 5.32]
a3.54 [0.22 ; 4.18]
aCamel
1.58 [1.05 ; 2.33]
b1.36 [0.33 ; 2.11]
bMare
1.55 [0.91 ; 1.94]
b0.40 [0.28 ; 0.68]
ba
Results are medians [1
st; 99
thpercentile] of 15 samples for cow, 8 samples for camel and
mare; the medians within each column labelled by different letters are significantly different
(Mann Whitney test, P < 0.05).
Table 4
Comparison of phospholipid fingerprint of cow’s milk identified by
31P-NMR with literature
PL classes
mol % of total PLs
Murgia et al. 2003
a Andreotti et al. 2006 b MacKenzie et al. 2009 c Our data d
PC 26.8 24.0 26.5 ± 0.3 28.7 ± 2.7 PE 25.8 23.5 26.7 ± 0.1 31.8 ± 3.0 PS 1.5 3.6 11.7 ± 0.2 10.0 ± 2.8 SM 26.8 24.2 20.8 ± 0.5 20.0 ± 1.4 PI 14.0 12.0 7.5 ± 0.1 3.7 ± 1.9 EPLAS 4.6 nd nd 4.9 ± 2.5
a
mean of one milk sample analysed 5 times; monophasic dimethyl formamide/triethylamine/guanidium
hydrochloride solvent mixture, 25°C; Bruker Avance 300 (7.05T).
b
mean of 2 samples; monophasic dimethyl formamide/triethylamine/guanidium hydrochloride solvent
mixture, 27°C; Bruker Avance 400.
c
data from a cow’ milk cream sample; sodium cholate (10%, w/w) EDTA (1% w/w), pH 7.1, 30°C; Bruker
Avance 300.
d
means ± SD of 15 independant milk samples (each sample being the pool of milk from 4 cows); biphasic
deuterated chloroform/methanol/CsCDTA 5mM in water solvent system, pH 7.7, 25°C; Bruker Avance 400
(9.4T). nb: means (±SD) are used instead of medians to be able to compare with data available from the
literature.
Table 5
Calculation of milk volumes able to supply same SM and
EPLAS amounts than HM for infants.
Milk volume (ml/d)
Term infant
Preterm infant
SM
EPLAS
SM
EPLAS
HM
800
800
170
170
CaM
530
908
113
193
CoM
1330
3070
289
648
Table 6
Estimated daily intake of phospholipids based on a consumption of 775 ml
of milk and dairy products per day in adults.
Phospholipid intake (mg/d)
PE
SM
PC
PS
PI
EPLAS
CoM
48
36
47
16
6
5
CaM
67
91
61
39
16
19
Fig. 2. Garcia C. et al.
A
PC PE SM PI PS EPLASC
PI LPC PS SM PC PE LPE LPA EPLAS PA PC SM PE EPLAS LPE LPC PI PSD
PA LPA PC PI PS SM PE EPLASB
Garcia et al. Milk phospholipid fingerprints by 31
P NMR
> Our 31
P NMR protocol improves identification and quantification of milk phospholipids > Milk phospholipid fingerprints are specific of mammalian species
> Camel milk provides close amounts of sphingomyelin and plasmalogens than human milk > Dietary phospholipid characterisation is useful in agrofood and in clinical nutrition > The putative health benefits of dietary phospholipid sources depend on their classes