UNIVERSITÉ DU QUÉBEC
MEMOIRE
PRÉSENTÉ À
L'UNIVERSITÉ DU QUÉBEC À CHICOUTIMI
COMME EXIGENCE PARTIELLE
DE LA MAÎTRISE EN INGÉNIERIE
Par
FARANAK ARIANPOUR
Water and ice-repellent properties of nanocomposite coatings
based on silicone rubber
Propriétés hydrophobes et glaciophobes de revêtements
nanocomposites à base de silicone
11
Abstract
In cold-climate countries such as Canada, Norway, Russia, Finland, the USA, China and Japan, ice accumulation on power network equipment may cause serious problems resulting in power outages with socioeconomical consequences. This situation is caused roughly by mechanical line failures or insulator flashovers, involving several complex phenomena.
Coating the surface of structures exposed to atmospheric icing with anti-icing materials can be an effective way to protect them against ice and snow adhesion and accretion. Coatings with water contact angle greater than 150° have been the subject of great interest during recent years. Such surfaces are called super-hydrophobic and are prepared by combining appropriate surface roughness with low surface energy.
In the present work, flat and micro-/nano-rough water-repellent coatings based on silicone rubber incorporated with nanopowders of carbon-black, titania and ceria as dopants have been prepared and investigated. Such water-repellent coatings are potential candidates for protecting high-voltage equipment such as conductors and insulators.
The water-repellent properties of the coatings were evaluated showing good incorporation of the dopant particles into silicone rubber. The anti-icing behaviour of the different coatings was studied under atmospheric icing conditions. Rough super-hydrophobic coatings prepared with TiO2 and CeO2 nanoparticles of different dielectric constants ( TiO2.* ~80, CeC^: —60) resulted in reducing the ice adhesion strength of at least ~ 7 times compared to a mirror-polished aluminum sample and ~ 9 times compared to an as-received aluminum sample.
Ill
Freezing behaviour of small water droplets was investigated on such nanostructured composite surfaces and compared with that on flat surfaces. At —15 °C, small water droplets were observed to freeze on polished Al after approximately 5 s, while their freezing was delayed to -12-13 min on super-hydrophobic nanocomposite surfaces. This is explained by the insulating properties of the rough surfaces which entrap a significant amount of air into their structure. Therefore, the coatings prepared show promise for industrial applications on high-voltage equipment, including insulators, since they can reduce ice accumulation, while also reducing the risk of flashover on overhead high-tension insulators.
IV
Résumé
Dans les pays à climat froid comme le Canada, la Norvège, la Russie, la Finlande, les États-Unis, la Chine et le Japon, l'accumulation de glace sur les équipements des réseaux électriques peut causer de sérieux problèmes résultant en des pannes d'électricité avec des conséquences socioéconomiques parfois désastreuses.
Le revêtement de la surface des structures exposées au givrage atmosphérique avec des matériaux antigivre peut être un moyen efficace de les protéger contre l'adhésion et l'accumulation de glace ou de neige. Les revêtements ayant un angle de contact de l'eau supérieur à 150° ont fait l'objet de nombreuses études au cours de ces dernières années. Ces surfaces sont appelées superhydrophobe et sont préparées en combinant une rugosité de surface appropriée avec une faible énergie de surface.
Dans ce travail de recherche, on a élaboré et étudié des revêtements hydrophobes plats et avec une micro-/nano-rugosité à base de caoutchouc de silicone où de la nanopoudre de noir de carbone, de dioxyde de titane et d'oxyde de cérium (« dopants ») avait été intégrée. Ces revêtements hydrophobes sont des candidats potentiels pour la protection d'équipements haute tension tels que les conducteurs et les isolants, contre les accumulations de glace ou de neige.
Les propriétés hydrophobes des revêtements ont été évaluées et montrent une bonne incorporation des particules ajoutées au caoutchouc de silicone. Le comportement antigivre des différents revêtements a été étudié dans des conditions de givrage atmosphérique. Les revêtements superhydrophobes préparés avec des nanoparticules de TiO2 et CeC>2 de constantes diélectriques différentes (TiCv ~80, CeC>2: —60) ont permis de réduire la force d'adhérence de la glace par au moins sept fois par rapport à un
échantillon d'aluminium poli miroir et environ neuf fois par rapport à un échantillon d'aluminium brut.
Le comportement de petites gouttelettes d'eau au cours de leur congélation a été étudié sur des surfaces nanostructurées composites et sur des surfaces planes. À environ -15 °C, de petites gouttelettes d'eau ont gelé sur de l'Ai poli après environ cinq secondes, ce qui a pris -12-13 minutes sur des surfaces nanocomposite superhydrophobes. Cela s'explique par les propriétés isolantes des surfaces rugueuses qui piègent une quantité importante d'air dans leur structure. Par conséquent, les revêtements ainsi préparés sont prometteurs pour des applications industrielles sur des équipements haute tension, y compris les isolateurs, car ils peuvent en réduire l'accumulation de glace tout en diminuant le risque de leur contournement électrique.
VI
Acknowledgments
This Masters' research was carried out within the framework of the Industrial Chair on Atmospheric Icing of Power Network Equipment (CIGELE) and the Canada Research Chair on Engineering of Power Network Atmospheric Icing (INGIVRE) at University of Quebec in Chicoutimi (UQAC).
I would like to use this window of occasion to thank those who helped me to complete this thesis. In the first place, I would like to thank wholeheartedly, my Director, Prof. M. Farzaneh, for his support, supervision, guidance, encouragement and patience, as well as deepest appreciation to Prof. Farzaneh's family for their warm welcome and kind hospitality in Chicoutimi. He behaved with me like father. It is an honor for me to earn my graduation under his supervision. Prof. Farzaneh is, without question, an expert in his field and his duty. I would also like to express my deepest gratitude to my co-director, Dr. Sergei Kulinich, for his excellent guidance and help during my project. Thank you to my colleagues, technicians and professionals, Pierre Camirand, Denis Masson and Xavier Bouchard, in CIGELE for their constant companionship and assistance.
I would like to express my warmest and deepest appreciation to my dear parents, sister and brothers who helped and encouraged me during in my studies, especially my father and my brother Dr. G. Aryanpour for teaching me determination. They have always stood by me and showed me how to reach my aims. I owe them everything. Last but not least, I would like to express my most profound gratitude to my
vu beloved husband, Shahram, for his true love and patience. His valuable and precious advice was most important to complete my thesis. I wish the best you and look forward to more great moments in the future with you.
vin
Table of Contents
Abstract.... ii Résumé iv Acknowledgments vi Table of Contents viii List of Figures xi List of Tables xiv List of Symbols and Abbreviations xv
CHAPTER 1 INTRODUCTION 1
1.1 The Problem of Icing 2 1.2 Current Solutions 3 1.3 Main Objectives 4 1.4 Methodology 6 1.5 Statement of Originality 8 1.6 The Outline of Thesis 9
CHAPTER 2 BACKGROUND AND LITERATURE REVIEW 12
2.1 Atmospheric Icing and Types of Ice 14 2.2 Ice Adhesion Mechanisms 19 2.3 Brief Review on Hydrophobic and Super-hydrophobic Properties 23
IX
2.3.1 Hydrophobicity and Contact Angle 23 2.3.2 Super-hydrophobicity and Roughness 26 2.4 Review of Nanoparticles incorporated in Silicone Rubber 34
CHAPTER 3 EXPERIMENTAL SETUP AND TEST PROCEDURES 39
3.1 Process of Coatings' Preparation 40 3.1.1 Substrate Cleaning 41 3.1.2 Producing Micro-/Nano-Rough Substrates 42 3.1.3 Preparation of Solution 43 3.1.4 Coating of the Samples 43 3.2 Sample Analysis and Characterization 45 3.2.1 Morphological Characterization 45 3.2.2 Wettability Tests 47 3.2.2.1 Contact Angle Measurement at Room Temperature 47 3.2.2.2 Contact Angle (CA) Measurement at Low Temperature 49 3.2.2.3 Ice Adhesion Test 50
CHAPTER 4 EXPERIMENTAL RESULTS AND DISCUSSION: HYDROPHOBIC AND SUPER-HYDROPHOBIC PROPERTIES OF FLAT AND ROUGH SAMPLES WITH COATINGS ALUMINUM SUBSTRATE 53
4.1 Water Droplet Contact Angle on Hat Al Substrates 54 4.1.1 Carbon-Black Nanoparticle-Incorporated RTV SR Coatings 54 4.1.2 TiO2 Nanoparticles-Incorporated RTV SR Coatings 57
4.2 Water Droplet Contact Angle on Rough Aluminum Substrates 58 4.2.1 TiO2 Nanoparticles-Incorporated RTV SR Coatings 59
4.2.2 Carbon-Black Nanoparticles-Incorporated RTV SR Coatings 61 4.2.3 TiO2 Nanoparticles-Incorporated RTV SR Coatings 63
4.3 Surface Characterization 67 4.3.1 Scanning Electron Microscopy (SEM) 67 4.4 Summary and Conclusions » 72
CHAPTER 5 EXPERIMENTAL RESULTS AND DISCUSSION: ICE ADHESION STRENGTH ON SAMPLE SURFACE 73
5.1 Ice Adhesion Strength of Rat Aluminum Substrate Coated with RTV SR Incorporated with Carbon-Black (CB) Nanoparticles 74 5.2 Ice Adhesion Strength on Rough Al Substrate Coated with RTV SR Incorporated with TiC>2 or CeÛ2 Nanoparticles 76 5.3 Adhesion Reduction Factor (ARF) Values of the Coated Samples 78 5.4 Contact Angle as a Function of Icing/de-icing Cycles 82
5.5 Summary and Conclusions 84
CHAPTER 6 EXPERIMENTAL RESULTS AND DISCUSSION: STABILITY OF SAMPLES IMMERSED IN DI- WATER AND FREEZING OF WATER DROPLETS ON SAMPLE SURFACES 86
6.1 Stability of Samples Immersed in DI Water 87 6.2 Freezing of Water Droplets on Sample Surfaces 90 6.3 Summary and Conclusions 95
CHAPTER 7 CONCLUSIONS AND RECOMMENDATION FOR FUTURE WORKS 97
7.1 Conclusions 98 7.2 Recommendations for Future Work 101
X I
List of Figures
Figure 2.1: (a) Soft rime, (b) hard rime ice on ridge-top vegetation, Sierra Nevada crest, (c)
glaze 17
Figure 2.2: Schematic of liquid droplet in contact with a smooth solid surface (contact
angle, Bo) 24
Figure 2.3: A schematic diagram of hydrophobic surface (left), and hydrophilic surface
(right) 26
Figure 2.4: Montage of some examples from nature: (a) Lotus effect [33], and (b) pond skater
walking on water [54] 27
Figure 2.5: SEM micrographs (shown at three magnifications) of Lotus (Nelumbo nucifera) leaf
surface which consists of microstructure formed by papillose epidermal cells covered with 3-D epicuticular wax tubules on surface, which create nanostructure [45] 28
Figure 2.6: Schematic and wetting of the four different surfaces. The largest contact area between
the droplet and the surface is given in flat and microstructured surfaces, but is reduced in JQ nanostructured surfaces and is minimized in hierarchical structured surfaces
Figure 2.7: (a) Contact angle for rough surface (9) (Wenzel regime) as a function of the
roughness factor (RJ) for various contact angles of the smooth surface (60), and (b) schematic of square-based hemispherically-topped pyramidal asperities with complete packing 31
Figure 2.8: Schematics of configurations described by the (a) Wenzel equation for the
homogeneous interface (Eq. (6)), (b) Cassie-Baxter equation for the composite interface with air pockets (Eq. (9)), and (c) the Cassie equation for the homogeneous interface (Eq. (10)) 33
Figure 3.1: (a) The spin-coater (model WS-400B-6NPP, Laurell Technologies Corporation), (b)
steps of coating preparation, (1) deposit solution, (2) spreading (low speed spin), (3) high speed spin
Figure 3.2: Scheme of preparation of nano-powder incorporated RTV SR coatings on
rough substrates ^5
Figure 3.3: KrussDSA 100 contact-angle goniometer 48 Figure 3.4: Measuring the advancing and receding contact angles on a sample with (a) a
low hysteresis (static CA), and (b) a high hysteresis (advancing ( 9 A) and receding (8R) CAs 48
Figure 3.5: Contact-angle goniometer and cooling unit for measuring CA at low
temperature (centre), enlarged Peltier device (left) and cooling/heating system (right) 49
Figure 3.6: (a) Centrifuge system, (b) sample with coating (1) in centrifuge set-up evaluating ice
adhesion strength. (1) sample, (2) aluminum beam, (3) counter-weight 51
Figure 3.7: (a) Top view of atmospheric icing wind tunnel used and (b) a view of ice
Xll
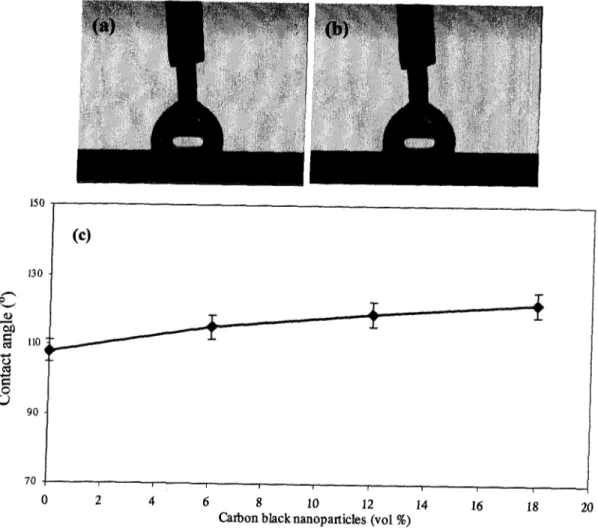
Figure 4.1: (a) Water drop on pure (non-doped) RTV SR coating, (b) water drop on RTV SR
coating with 6 vol. % of carbon-black nanoparticles incorporated, (c) contact angle vs. vol. % of carbon-black incorporated into coatings 55
Figure 4.2: AFM surface images of RTV SR coatings doped with 0 (a), 6 (b), 12 (c), and 18 vol.
% (d) of carbon-black. Root-mean-square roughness (Rq> values are 128.2 (a), 178.11 (b), 261.93 (c), and 295.81 nm(d) 56
Figure 4.3: Contact angle (white) and CAH (black) as a function of TiO2 concentration in
coatings prepared by spin-coathngs RTV SR/hexane ratio (1:3 v/v) suspension on flat aluminum 58
Figure 4.4: Contact angle of samples prepared by spin-coating RTV SR/hexane (1:1 v/v)
suspension with 2 wt. % of T1O2 nanoparticles incorporated as a function of etching time of the substrate used ^0
Figure 4.5: Contact angle hysteresis of coatings prepared (1:1 v/v) RTV SR/hexane
solution with 2 wt. % of TiÛ2 nanoparticles incorporated as a function of etching time of the substrate (Al alloy in diluted HC1) 60
Figure 4.6: (a) Water contact angle (CA) and (b) water contact angle hysteresis (CAH) of coating
prepared by spin-coating hexane dilution of RTV SR (1:4) with 3 wt. % carbon black nanoparticles incorporated, (c) contact angle (white) and CAH (black) as a function of different concentration of RTV SR with 3 wt.% of carbon black nanoparticles incorporated 61
Figure 4.7: (a) Water contact angle (CA) and (b) water contact angle hysteresis (CAH) of coating
spin-coated from hexane dilution of RTV SR (1:4) with 1.5 wt.% carbon black nanoparticles incorporated, (c) contact angle (white) and CAH (gray) as a function of hexane dilution of RTV SR with 1.5 wt.% of carbon black nanoparticles incorporated 62
Figure 4.8: (a) Water contact angle (CA) and (b) water contact angle hysteresis (CAH) of coating
prepared by spin-coating hexane dilution of RTV SR (1:4) with 1 wt.% TiC>2 nanoparticles incorporated, (c) contact angle (white) and CAH (gray) as a function of RTV SR/hexane ratio
with 1 wt. % of TiC>2 nanoparticles 63
Figure 4.9: Contact angle (white) and CAH (gray) as a function RTV SR/hexane volume ratio
with 2 wt. % of TiC>2 nanoparticles incorporated 64
Figure 4.10: (a) Water contact angle (CA) and (b) water contact angle hysteresis (CAH) of
coating prepared by spin-coating hexane-diluted RTV SR mixture (1:4) with 1 wt.% CeO2 nanoparticles incorporated, (c) contact angle (white) and CAH (black) as a function of RTV SR/hexane ratio with 1 wt.% of CeC>2 nanoparticles incorporated 65
Figure 4.11: Contact angle (white) and CAH (gray) as a function of RTV SR/hexane volume (-( -ratio with 2 wt. % CeC«2 nanoparticles incorporated
Figure 4.12: SEM surface image and EDS spectrum of etched Al sample 68 Figure 4.13: SEM surface image and EDS spectrum of Al sample coated with RTV (1:4
v/v) /CeO2 (2 wt. %) 68
Figure 4.14: SEM surface image and EDS spectrum of aluminum sample coated with
RTV (1:4 v/v) /TiO2 (2 wt.%) 6 9
Xlll
Figure 4.16: SEM surface image of etched Al sample coated with RTV (1:4 v/v) 71 Figure 4.17: SEM surface image of as-received Al sample 71 Figure 5.1: Shear stress of ice detachment (kPa) vs. vol % of carbon-black nanoparticles
incorporated in RTV SR coated samples. Dashed line presents shear stress on mirror-polished aluminum 75 Figure 5.2: Shear stress of ice detachment vs. icing/de-icing cycle number for coatings spin-coated from RTV SR/hexane solutions (1:4 v/v) with (1, 2 wt. %) TiO2 and (1, 2 wt. %) CeO2
nanoparticles incorporated, respectively 76
Figure S3: Shear stress of ice detachment vs. icing/de-icing cycle number for coatings
spin-coated from RTV SR/hexane solutions (1:4 v/v) with (1, 2 wt. %) TiO2 and (1, 2 wt. %) CeO2
nanoparticles incorporated, respectively 77
Figure 5.4: Ice adhesion reduction factor (ARF) as a function of icing/de-icing cycles on
mirror-polished Al and a coating prepared from RTV SR/hexane (1:4 v/v) solution with 1 wt. % of CeC>2 nanoparticle incorporated 79
Figure 5.5: Ice adhesion reduction factor (ARF) as a function of icing/de-icing cycles on
mirror-polished Al and a coating prepared from RTV SR/hexane solution (1:4 v/v) with 2 wt. % of CeO2
nanoparticle incorporated 80
Figure 5.6: Ice adhesion reduction factor (ARF) as a function of icing/de-icing cycles on
mirror-polished Al and RTV SR coating with 1 wt. % of TiO2 nanoparticles incorporated 81
Figure 5.7: Ice adhesion reduction factor (ARF) as a function of icing/de-icing cycles on
mirror-polished Al and RTV SR coating with 2 wt. % of TiO2 nanoparticles incorporated 81
Figure 5.8: Contact angle vs. icing/de-icing cycles number for RTV SR/TiO2 (1 and 2 wt. %)
coated Al samples 82
Figure 5.9: Contact angle vs. icing/de-icing cycles number for RTV/CeO2 (1 and 2 wt. %) coated
Al samples 83
Figure 6.1: Contact angle vs. immersion time in de-ionized water for RTV SR/CB (3 wt. % of
carbon-black) coating 88 Figure 6.2: Contact angle vs. immersion time in de-ionized water for Al sample coated with RTV
(l:4)/TiO2(2wt.%) 89
Figure 6.3: Contact angle vs. immersion time in de-ionized water for Al sample coated with RTV
(l:4)/CeO2(2wt.%) 90
Figure 6.4: Images of small water droplets on cold (-15 °C) surfaces: (a) flat Al, (b) rough
super-hydrophobic RTV/CeO2 surface 9 1
Figure 6.5: Water droplet freezing time versus contact angle hysteresis of coated samples. Data
for uncoated flat Al are also given. The lines are simply guide to the eye 92 Figure 6.6: Water drop on a super-hydrophobic surface. Heat transfer at surface/ water drop interface is shown by short arrows 94
XIV
List of Tables
Table 2.1. Summary of some field observations of natural icing 19
Table 6.1. CA, CAH and freezing times of different samples 93
XV
List of Symbols and Abbreviations
6A Advancing contact angle (°) 0, CA Contact angle on surfaces (°) p Density of drop (g .cm"2)
s Dielectric constant OR Receding contact angle (°)
(0 Rotation speed of the beam (angular acceleration, rad-s"1)
T Shear stress of ice (N.m"2)
y Surface tension of a liquid
Jsv Surface tension of solid-vapor interface (mN.ni"1)
JSL Surface tension of solid-liquid interface (mN.ni"1)
Jiv Surface tension of liquid-vapor interface (mN.ni"1)
A Apparent de-iced area of the sample surface (m2)
ASL Contact areas of liquid-solid interface (m2)
ALA Contact areas of liquid-air interface (m2)
Af Hat projected area (m2)
Etot Total surface free energy
F Adhesion force (N)
fu Area fraction of liquid-air interface fsL Area fraction of solid-liquid interface
/ Fraction of solid surface area wet by the liquid
m Mass of accumulated ice on Al surfaces (g) q Charge on ice surface (C)
q ' Induced image charge (C)
Rq Root-mean-square
XVI
r
WA ATH APTS AC AFM F ARF CB CAH DC EDS EG FTIR INAAT ODTS PMMA PVDF PEN PECVD QLL RTVSR SPAI SEM XPS Beam radius (m)Work of adhesion (mN.ni1)
Alumina tri-hydrate
3-amino-propyl-triethoxysilane Alternating current
Atomic force microscope Adhesion force (N)
Adhesion reduction factor Carbon black
Contact angle hysteresis (°) Direct current
Energy-Dispersive X-ray Spectroscopy Ethylene glycol
Fourier transform infrared spectroscopy
Isopropyl tris-(N-amino-ethyl aminoethyl) titanate Octadecyltrichlorosilane
Polymethyl methacrylate Polyvinylidene fluoride Polyarylene ether nitriles
Plasma-enhanced chemical vapor deposition Quasiliquid layer
Room-temperature vulcanized silicone rubber Siloxane-modified polyamideimide
Scanning electron microscope X-ray photoelectron spectroscopy
CHAPTER 1
CHAPTER 1
INTRODUCTION
1.1 The Problem of Icing
Atmospheric ice is formed on overhead transmission and distribution lines when they are exposed to supercooled water droplets or snow particles. This may lead to serious risk to the security of overhead networks [1-4]. Atmospheric icing occurs in different forms, including hoar frost which is caused by condensation of vapor, in-cloud icing involving the freezing of supercooled water droplets in clouds or fog, and finally, precipitation icing resulting from freezing rain, drizzle, wet snow or dry snow [1-4]. Hashover on ice-covered overhead insulators is another problem closely related to ice accretion, which causes damage to such insulators and reduces their life-time [4,5]. Ice accretion, together with superimposed contamination, is well-known to often cause a decrease in the flashover voltage of outdoor insulators, resulting in occasional outages [2].
Ice or wet-snow can cause severe trouble due to their high adherence to both metallic and insulating surfaces. Prevention of ice accretion on surfaces requires reduction of ice adhesion strength. Thus, various anti-icing and de-icing techniques, e.g. chemical, thermal or mechanical removal of ice build-ups, have been developed for decades. Although the majority of the techniques currently in use are called active
de-icing techniques, all of them are employed where ice accumulations are already considerable. Developing passive anti-icing or ice-phobic coatings is gaining in popularity. These kinds of coatings prevent or hinder ice and wet-snow accumulation on such surfaces and are believed to provide reduced ice adhesion [2]. Some of these coatings have been tested by several groups, which will be discussed in the next chapter.
1.2 Current Solutions
The need for reliable electrical transmission and distribution networks under the most severe icing conditions in cold climate regions highlights the importance of ice adhesion studies for reducing ice accretion. Currently, de-icing techniques such as chemical, thermal and mechanical and thermal de-icing are applied extensively. However, these methods are not always advantageous due to their reduced efficiency when it concerns time and cost as well as their limited application which is not general. All these de-icing techniques are used where ice is already accreted and a critical thickness has been reached. Moreover, mechanical de-icing methods using scraping or vibration can damage the target equipment, and sometimes result in gradual degradation of the system itself. An alternative way to prevent ice accretion on the surface of high-voltage equipment would be to apply coatings with reduced ice adhesion properties [3,7, 8]. Recently, several coatings for ice-phobic application have been tested and reported but the best results belonged to greases and lubricants and not to solid coatings [9]. These ice-phobic coatings must necessarily fulfill both of the
following requirements for a true solution: first, they must efficiently reduce snow or ice adhesion, and second, they must have a reasonably long service-life or durability. In this regards, polymers with low critical surface tension such as organopolysiloxane and tetrafluoroethylene (Teflon®) were examined. Those coatings exhibited satisfactory traction on wet roads; they produced very low run off water contamination and thus demonstrated a significant reduction in ice adhesion [10]. An additional series of investigation revealed that fluorinated and polysiloxane coated surfaces had the poorest wetting by water and are good candidates for ice-phobic coatings [10]. Although de-icing fluids can be applied to ice-covered structures to eliminate such ice build-ups, these substances can have significant negative environmental impacts and thus can only be used as impermanent solutions [11]. In fact, the protection time of anti-icing fluids depends on precipitation conditions and on properties of the fluids. In addition, it should be considered that they need frequent applications in large quantities, which makes them time-consuming and expensive methods. Heating the surface (Joule effect or high frequency current) to melt the ice is another effective method which unfortunately requires a large supply of energy. Electrolysis is another approach found to be effective for removing ice from certain surfaces; however, it is not still a practical method [12].
1.3 Main Objectives
This research work was primarily motivated by: (i) increasing use of silicone rubber-based coatings with the aim to improve the existing high-voltage insulators, (ti)
extensive research on nanopowder-incorporated polymer (and silicone rubber) coatings and their potential need for wide industrial applications (including those on various high-voltage equipment), (iii) lack of knowledge in the literature on how such doped silicone-rubber coatings interact with water and, in particular, behave at subzero temperatures.
The main goal of this research work is to study the possibility of preventing or reducing ice accretion on the surface of high-voltage equipment, particularly insulators, by applying super-hydrophobic coatings for reducing ice and snow accumulation. For this purpose, the project is focused on preparation of thin films of appropriate materials with such properties. More specifically, the objectives of this research are the following:
(i) Preparation of nanocomposite coatings based on silicone rubber incorporated with carbon black and certain oxide nanopowders with different dielectric constants.
(ii) Study of hydrophobic and ice-repellent behaviour of the prepared coatings as a function of the added nanopowder (dopant) nature and concentration; comparison with non-doped coatings, as well as study of the effect, if any, of different dopant (with different electrical properties) incorporated into the coatings on their wetting and/or ice-releasing properties.
(iii) Preparation of rough super-hydrophobic coatings, study of their hydrophobic properties and ice-releasing performance; comparison with flat surfaces. Comparative study of water freezing behaviour on different samples.
(iv) Study of stability of the coatings in water and during icing/de-icing cycles, as well as their surface topography, their structural, chemical properties, in order to determine their potential for applications to high-voltage equipment (such as conductors and insulators).
1.4 Methodology
Regarding the above objectives, the following experimental methodology has been used on aluminum alloy surfaces. After the aluminum samples were cleaned and then (if necessary) polished or etched, they were coated with silicone rubber with different dopants, while applying a variety of experimental parameters or different pre/post treatments as summarized below:
(i) As-received carbon-black nanoparticles (from Columbian Chemicals, specification Conductex 7055 Ultra, with the average size of 42 nm and the surface area of 55 m2.g"]) were used as dopant. A commercial-grade alumina- filled room
temperature vulcanized silicone rubber (RTV SR) purchased from Dow Corning (DOW CORNING® HVIC 1547) was used as a hydrophobic material. According to the manufacturer, it consists of alumina hydrate, hydrotreated light petroleum, stoddard solvent, methyl tri (ethylmethylketoxime)silane, di (ethylmethylketoxime)methoxymethylsilane, and xylene. Carbon-black nanoparticles were mixed in different volume ratios with the RTV silicone rubber in a beaker under vigorous magnetic stirring. Similarly, TiO2 and CeO2 nanopowders (from
Sigma-Aldrich, particle size below 100 and 25 nm, respectively) were also used as dopants in RTV SR coatings. Such mixed solutions (particle suspension in liquid) were used to prepare nanocomposite coatings on aluminum substrates for wetting and structural characterizations. It should be noted that the RTV SR product (used as-supplied from the manufacturer) had alumina micro- particles (average size ~ 3 um) as a filler improving its mechanical properties. However, since the concentration of such alumina particles was constant, their contribution to the properties of the tested samples was same for both non-doped and doped (with CB, TiO2 or CeC>2 powders) coatings. Therefore, adding different amounts of the above dopant nanopowders allowed us to elucidate their effect on the hydrophobic and ice-releasing properties of doped coatings in comparison with their non-doped counterparts. The coatings were prepared using a spin-coater from Laurel (WS-400B-6NPP) followed by curing in a conventional oven in air. The choice of metal substrates was mainly dictated by the necessity to use some samples for icing/de-icing experiments in a centrifuge. Aluminum alloy (AA6061) was used as substrate. The influence of different parameters on the formation and properties of such layers has been analyzed in order to optimize the coating process.
(ii) The wetting behaviour of the coatings, sessile water contact angle and wetting hysteresis was evaluated on a Kruss DSA100 goniometer. The ice adhesion strength was evaluated in a house-made centrifuge apparatus (centrifuge adhesion testing machine) placed in a cold room at subzero temperature. The type of ice used was glaze, prepared by spraying supercooled micrometer-sized water droplets (—80 um) in a wind tunnel at -10 C, wind speed 11 m.s" and water feed rate of 2.5 g.m .
(iii) Both flat and rough coatings were prepared on flat as well as rough substrates by means of spin-coating. Their wetting behaviour at room temperature, low temperature as well as their ice-releasing properties was compared with those on flat samples. Ice adhesion experiments were carried out on such coatings in order to find out what parameters govern this property of the coating.
(iv) Scanning Electron Microscopy (SEM) and Atomic Force Microscopy (AFM) were used for surface imaging.
(v) Chemical analysis of prepared coated surfaces was carried out using energy-dispersive X-ray spectroscopy (EDS) during SEM.
1.5 Statement of Originality
As will be expressed broadly in Chapter 2, the previous efforts were mostly concentrated on the electrical and mechanical properties of nanoparticle-incorporated RTV SR coatings. However, information on their water-repellent and ice-releasing properties is scarce. In this research work, thus, we considered the behaviour of RTV SR coatings incorporated with nanoparticles at subzero temperatures (-10 to -15 °C), and the opportunity of preparing super-hydrophobic coatings to reduce ice accumulation. Such coatings could further decrease ice and wet-snow accumulation and adhesion on the surface of exposed equipment. Freezing of water droplets on various coated surfaces was also studied as compared with that of flat coated and uncoated aluminum surfaces, behaviour at subzero temperatures. Evaluating ice adhesion strength
considering the effect of all possible conditions on coating properties were investigated by means of the facilities provided at the CIGELE (the Industrial Chair on Atmospheric Icing of Power Network Equipment) and INGIVRE (the Canada Research Chair on Engineering of Power Network Atmospheric Icing) laboratories at UQAC.
1.6 The Outline of Thesis
The thesis is organized in the seven chapters as follows:
• Chapter 1 presents a summary of icing related issues, a short introduction to the current solutions as well as a general introduction of this research work including the research objectives, methodology, motivation for this work, the thesis organization, etc.
• Chapter 2 provides a review of the available literature and background studies on hydrophobicity, super-hydrophobicity, icephobicity and nanoparticles. The concepts and explanations provided in this chapter make it possible to understand the principles of the tests and the reasons for choosing the coatings used in this research. This chapter also summarizes previous studies and results obtained related to the topic which should be of help to the reader.
• Chapter 3 explains the experimental procedures for preparing the nanoparticle-silicone rubber suspensions, coating preparations and characterization methods. It also provides a description of the facilities and techniques used for characterizing the prepared coatings, e.g. Contact Angle Goniometer, Spin-Coater, Atomic Force Microscope (AFM), Cold Climatic Chamber (cold room), wind tunnel, Centrifuge Adhesion Test Machine, Scanning Electron Microscope (SEM), Energy-Dispersive X-ray Spectroscopy (EDS), etc.
• Chapter 4 presents the results of the water-droplet behaviour study for the nanoparticle-incorporated RTV SR coatings on flat or rough aluminum substrate.
• Chapter 5 provides the experimental results obtained on the prepared coatings in terms of hydrophobic and super-hydrophobic properties, ice-phobicity and surface characterizations, e.g. morphological and chemical analyses. The obtained ice adhesion test results as well as the contact angle values as function of icing/de-icing number after each icing/de-icing cycle on the coated samples are also discussed in detail in this chapter. These sets of experiments were conducted to trace any possible effect of ice detachment on the coating performance during icing/de-icing events.
• Chapter 6 describes the results obtained concerning the freezing of water droplets on coated and non-coated sample surfaces and the stability of prepared coated samples immersed in de-ionized (DI) water.
• Chapter 7 includes general conclusions and recommendations for future studies based on this research work including the obtained results and their discussion.
Finally, the references which were cited in this thesis are presented at the end of this thesis.
An exhaustive survey of the literature related to the concept of wettability, hydrophobicity and super-hydrophobicity, nanoparticles and ice-phobic properties is presented in the following chapter.
CHAPTER 2
CHAPTER 2
BACKGROUND AND LITERATURE REVIEW
Superstructure icing from atmospheric icing on the equipments may impact their operations and can reduce their safety, operational tempo, and productivity. A number of new technologies and modern versions of old technologies used successfully in aviation, the electric power industry, and ground transportation systems. Making a surface where ice would not stick to it would be an ideal and economical solution to eliminate application of de-icing techniques. Such a surface is defined as "ice-phobic" surface. Creating an ice-phobic surface is possible through knowledge of the physics of ice and ice accretion processes and methods for prediction of icing events. These ice-repellent surfaces can be created by applying an appropriate morphological surface modification followed by the use of a coating. This coating should have chemical components with a weak chemical interaction with ice or snow.
In this chapter, we will briefly review atmospheric icing followed by a brief review of the mechanisms of ice adhesion and a discussion of hydrophobicity and superhydrophobicity.
2.1 Atmospheric Icing and Types of Ice
Atmospheric icing occurs when water droplets in the atmosphere freeze on objects they contact. Water drops can be cooled down much below bulk water freezing point (0 °C) on which tiny water drops may remain in liquid state below freezing point. For a supercooled droplet, the liquid state is thermodynamically unstable and indeed the most stable state for supercooled droplet is the solid state. This is very dangerous on aircrafts. For power transmission lines going through mountains, for instance, the built-up ice changes the aerodynamics of the flight surfaces, which can increase the risk of a subsequent stalling of the airfoil, mechanical and electrical damages of the power transmission lines or flashover on the insulators. Atmospheric icing combined with wind is a main factor for power line design and reliability. The freezing process of water droplet may be accelerated by presence of any substance that can act as a freezing nucleus, which makes possible the growth of an ice crystal on itself.
Ice accretion can be defined as any process of ice build-up and snow accretion on the surface of an object exposed to the atmosphere. Types of accreted ice depend on wind speed, supercooled water droplet size, compressive strength, air temperature and properties of the objects being hit by droplets [13]. However, two sources of atmospheric ice accretion are recognized regarding to their methods of deposition and characteristics of deposits:
(1) In-cloud icing happens where supercooled water droplets are sufficiently small to remain suspended and contact with surface results from air movement. This category generally includes hard rime, soft rime, but sometimes glaze. In-cloud icing
usually happens in the aircraft flying through clouds or on the equipment installed in high altitude [14]. When the flux of water droplets towards an object is less than the freezing rate, each droplet freezes before the next droplet impinges on the same spot. Such kind of ice growth is called dry icing. When the water flux increases, the droplets do not have the required time to freeze before the next impinges, hence the ice growth will tend to be wet. Dry icing usually results in different types of rime containing air bubbles, while wet icing always forms glaze ice which is solid and clear. In fact, the physical properties and the appearance of the accreted ice vary widely according to the variations of the meteorological conditions during the ice growth. The maximum amount of accreted ice on an object depends on several factors. The most important factors are air temperature, relative humidity, and the duration of ice accretion. However, a major precondition for significant ice accretion is the dimensions of the object exposed and its orientation to the direction of the icing wind.
(2) Precipitation icing occurs when the droplets are massive enough to fall from the atmosphere onto an accreting surface. In other words, precipitation icing may happen when a warm layer of air with the temperature of > 0 °C is trapped between two layers of cold air with the temperature of < 0 °C) during freezing rain. Precipitation icing can occur everywhere regardless of altitude. This type includes freezing precipitation and wet snow. Precipitational icing generally gives rise to glaze ice accumulations.
Glaze ice forms when droplets striking a surface have sufficient time prior to
freezing to flow in a continuous film (Fig. 2.1c). Glaze is caused by freezing rain, freezing drizzle or wet in-cloud icing and usually causes smooth evenly distributed ice
accretion. The accretion rate mainly varies with the rate of precipitation, wind speed and also air temperature. This condition is most common when air temperatures are just below freezing and rain is the dominant precipitation form. Glaze often forms a hard, nearly homogeneous ice layer having the highest density approaching 0.917 g cm"3, that
of bubble-free ice [15]. Glaze can also result in formation of icicles with the more asymmetric shape [16,17,18]. The surface temperature of accreted ice is near freezing point, and thus water may flow around the object and freeze on the leeward side. As mentioned, glaze ice is denser and applies larger static or dynamic forces to the instruments. In addition, it conducts the electricity easier, and therefore is more risky for the performance of the electric networks.
Rime forms tiny coatings on snow crystals or enormous accumulations up to
several meters thick on terrestrial objects and is the most common type of in-cloud icing. When supercooled water droplets hit a dry cold surface, they freeze as soon as the latent heat of fusion is dissipated and rime ice accumulates. Lower temperatures usually create hard rime or soft rime that will be explained later (Fig. 2.1). Depending on meteorological conditions, rime accretions can be dense, compact masses, feathery surfaces, or slender, needle-like spikes. Close examination often reveals a fine grained, granular structure without any recognizable crystalline pattern. Rime grows into the prevailing wind and is a reliable indicator of wind direction during icing events [19]. The liquid water content of the air becomes so small at temperatures below ~ - 20 °C that practically no in-cloud icing occurs. It results in an ice accretion more or less cylindrical around the objects. The most severe rime icing occurs on freely exposed mountains, coastal or inland, or where mountain valleys force moist air to pass around,
as a result, both lifts the air and increases wind speed over the pass. The accretion rate for rime varies on dimensions of the exposed object, wind speed, liquid water content in the air, water drop size and air temperature.
Soft rime forms when the supercooled droplets freeze quickly upon deposition (Fig. 2.1a). The dissipation of latent heat is rapid; no flow occurs and large amounts of air are entrapped. The deposit often has an opaque-white, porous, and fluffy appearance. Soft rime has a density of less than 0.6 g cm'3 [20].
Fig. 2.1. (a) Soft rime, (b) hard rime ice on ridge-top vegetation, Sierra Nevada crest, (c), glaze ice.
"Hard" rime forms when the rate of latent heat loss is relatively low, allowing "wet growth" whereby some flow of the droplets occurs before complete freezing (Fig.
2.1b). Hard rime is generally milky or translucent in appearance, depending upon the amount of air trapped within the ice structure. Its density ranges from 0.6 to 0.9 g cm"3.
The third condition is known as "frost" [20]. Frost or "hoarfrost" forms under still air conditions by deposition of water directly from the vapour phase to a cold surface. Since water vapour amounts are minimal at subfreezing temperatures, and still air conditions are infrequent at mountainous sites, at high elevations frost is much less frequent than other types of ice accretions [21].
Although meteorological conditions associated with the formation of glaze and rime have been investigated, due to the complexity of the phenomenon, geographic differences and monitoring disparities, a wide range in conditions has been reported (Table 2.1). This is particularly the case in field situations due to the complexity of mountain weather. In general, soft rime, at one end of the spectrum, is favoured by conditions that promote a high degree of droplet super-cooling and rapid dissipation of the latent heat of fusion (low air temperatures and low wind speeds). At the other end of the spectrum, glaze is formed under the opposite of these conditions. Hard rime is an inter-mediate form of these two extremes.
Many combinations of droplet size, liquid water content, air temperature, wind speed, etc., are capable of producing the thermo-dynamics necessary such that an individual parameter may fall outside of its generally stated range. The most dangerous ice accretions are glaze, hard rime, wet snow and mixtures.
Table 2.1. Summary of some field observations of natural icing [22,26].
Meteorological variable and/or range
Air temperature - 5 to -14 °C Air temperature 0 to - 4 °C
Air temperature blow 1°C with low wind Air temperature < 5°C and wind 56 ms"1
Wind speed and event duration Air temperature - 2 to - 3 °C Air temperature -14 to -15 °C Air temperature 0 to - 6 °C Air temperature - 2 to - 3 °C Air temperature - 3 to - 6 °C Wind speed
Wind speed 1 to 10 ms"1 and air temperature - 1 to 10 °C
Wind speed 3 to 15 ms"1, air temperature -2 to - 8 °C
Wind speed 2 to 20 ms"1, air temperature 0 to-3°C
I=productof wind speed (ms1) and the constant 0.011
Ice condition
Rime most frequent
Observer-reported icing most frequent Hard rime common
Soft rime common
Positively correlated with amount of ice
Optimum for hard rime Optimum for soft rime Accretion rates greatest Intensity of Accretion greatest Frequency of rime events greatest Rime growth intensity increases with
wind velocity Soft rime
Hard rime Glaze
Rime formation rate, I (g cm" h" )
2.2 Ice Adhesion Mechanisms
As previously discussed in chapter 1, ice and snow adhesion and accumulation bring dangerous and costly problems into our everyday lives. Ice is responsible for significant and serious problems on different structures. Generally, atmospheric icing is
the deposition of frozen water on surfaces at or below freezing which may result of rain, freezing rain, wet snow, fog, supercooled clouds or vapour, or from spray or splashing water. Ice adhesion produces numerous troubles in many areas of human activity such as transportation, power transmission and distribution, aircraft, wind turbine blades, ships, and bridges [27]. Icing of power transmission lines during winter storms is a persistent problem that causes outages and costs millions of dollars in repair expenses [28]. Control of icing by physical removal such as applying heating or chemicals may be possible but is costly and not generally practicable. The development of materials with low adhesion to ice is a very important problem [29].
Its solution requires a fundamental understanding of the physical mechanisms of bonding between ice and other solids. In particular, it needs to know the nature and strength of molecular bonding between ice and various solids. Why does ice adhere to any solid, even to hydrophobic materials? What changes occur over time in ice adhesion? Fundamental and theoretical studies are needed, for the first step, to provide answers to these questions which will be explained in details as objectives of this chapter.
The required force to ice detachment from the surface is typically termed as ice adhesion force. Many parameters can influence the adhesion of ice to a surface, e.g. substrate surface properties, conditions of ice formation, air temperature, freezing rate, water contact area, droplet momentum and etc. Though, the fundamental physics of ice adhesion is not well-known up to now [30], three major components of ice adhesion to surface of materials are involved: hydrogen bonds, dispersion or Lifshitz-van der Waals forces, and electrostatic interactions contribute to ice/solid interfacial energy. Their
relative importance depends on the nature of the material to which ice adheres. Adhesion of ice to a particular substrate is also affected by a quasiliquid layer (QLL) on the interface and by the substrate surface roughness [31]. Adhesion of ice is usually a property of the ice/solid interface that can act via strong interaction between ice molecules and solid surface. In ideal case, all three types of interaction must be eliminated to have zero or reduced ice adhesion. Chemical bonding involves a chemical reaction between the molecules on opposite sides of the interface and will be specific to the nature of the materials concerned.
The role of chemical bonding in ice adhesion has not been sufficiently studied yet. Van Oss et. al. determined the surface energy of ice within the context of modern surface chemistry. They separated the surface free energies of ice into Lifshitz-van der Waals and Lewis acid-base components, using measurements of the contact angles of various liquids on ice and experiments to observe the exclusion or incorporation of various colloidal particles in an advancing freezing interface. They finally concluded that at 0 °C only 26.9 mJ m"2 of the total surface energy of 69.2 mJ m"2 arises from the
Lifshitzvan der Waals interaction [32]. Van der Waals forces are of longer range than hydrogen bonding and are always present at the interface. The Lifshitz-van der Waals forces between ice and several metals and insulators were calculated by Wilen et al. who concluded that these are not the dominant source of ice adhesion. They also concluded that electrostatic interaction may play a more important role in ice adhesion rather than Lifshitz-van der Waals forces [32].
Electrostatic interactions occur between non-compensated spatial distributions of charge on opposite sides of the interface at greater than intermolecular distances and
contribute significantly to ice adhesion with interaction energy of up to 500 mJ m"2
[29]. So the electrostatic forces of attraction between charges on ice and induced image charges are considered to play a significant role in ice adhesion, although the fundamental physics of ice adhesion is yet to be fully explored. However, it is a well-known fact that ice adheres to any surface. Exerting an external force on the ice-solid interface can lead to cohesive rupture (breaks that happen within the ice) or adhesive rupture (breaks that happen at the ice-solid interface and occur when the strength of adhesion is lower than the strength of ice) [33]. The electrostatic interaction energy between ice and metals has been found to be significantly higher than the hydrogen bonding and Van der Waals forces at greater than intermolecular distances [29]. Charges on ice induce smaller charges on dielectrics, the reduction being related to the dielectric constant by the equation (1):
s + 1
Where q' is the image charge produced by a charge q on the ice surface and s is the dielectric constant of the insulating substrate. According to the above equation, materials with a very low dielectric constant would significantly reduce the adhesion of
ice by reducing the electrostatic interaction (whose force Foe ^—, where r is the
r
distance between q and q ').
It should be noted that experimental conditions to measure ice adhesion must be carefully defined; otherwise it is difficult to correlate basic or experimental adhesion with practical adhesion because of:
i) An adhesive layer will rupture in the bulk adhesive rather than at the interface and thus it can affect on the reproducibility of the experimental results.
ii) Difficulty to measure and quantify intermolecular forces, presence or absence weak boundary layers, the mode of applying stress, intrinsic stresses and the failure mode on adhesion of ice [34].
2.3 Brief Review on Hydrophobic and
Super-hydrophobic Properties
2.3.1 Hydrophobicity and Contact Angle
Hydrophobicity of any material is its resistance to flow of water on its surface. A surface is termed as highly hydrophobic if it resists to flowing water dropped on it and is least hydrophobic surface if water droplets flow in form of tracks on its surface. The hydrophobic surface is water repellent, in contrast with a hydrophilic surface that is easily wetted. From the point of insulators, hydrophobicity is treated as a resistance to the formation of conducting water tracks that increase leakage current, chances of flashover, and other deterioration effects [35]. Coating any surface with anti-icing materials can be an effective way of reducing/preventing ice accretion. For ice to adhere to a surface, it is necessary for water to "wef the surface which means replacing the substrate-air interface with a substrate/water interface. This tendency to wet the surface can be determined by measuring the angle the surface of a liquid drop makes with the solid surface [36]. Young and Laplace found out that each surface has a
specific energy because the surface atoms or molecules of liquids or solids have fewer bonds with neighbouring atoms, and therefore, they have higher energy than similar atoms and molecules in the interior. This additional energy is characterized quantitatively by the surface tension or free surface energy Y, which is equal to the work that is required to create a unit area of the surface at a constant pressure and temperature. The unit of Y is J m"2 or N m"1 and it can be interpreted either as energy
per unit surface area or as tension force per unit length of a line at the surface. When a solid is in contact with a liquid, the molecular attraction will reduces the energy of the system below that for the two separated surfaces. This is expressed by the Dupré equation:
Where WSL is the work of adhesion per unit area, Y SA and Y SL are the surface energies of the solid against air and liquid, and Y LA is the surface energy of liquid against air [37, 39]. If a liquid droplet is placed on a solid surface, the liquid and solid surfaces come together under equilibrium at a characteristic angle called the static contact angle eo(Fig.2.2).
Smooth surfece
/ tJL / /
This contact angle can be determined by minimizing the net surface free energy of the system [37,39]. The total energy EM is given by [40,41].
£t ot = / LA (ALA + Ast) - WSL ASL (2)
Where ASL and ALA are the contact areas of the liquid with the solid and air, respectively. It is assumed that the droplet of density p is smaller than the capillary length, (yiA/pg)112, so that the gravitational potential energy can be neglected. It is also assumed that the volume and pressure are constant, so that the volumetric energy does not change. At the equilibrium dEtat =0, which yields:
Y LA (dAu + dASI) - WSLd ASL = o (3)
For a droplet of constant volume, it is easy to show using geometrical considerations, that:
dALA/dASL = cos 0o (4)
Combining Eqs. (1), (3), and (4), the well-known Young equation for the contact angle is obtained:
cos0o = a SA-YSI)/YLA (5)
The contact angle (CA, do) is the macroscopic indicator of the surface energy balance and the equilibrium of surface energy can determine the entire shape of a droplet on a solid, provided that the drop is small enough. Wetting phenomenon is
o
o
hydrophobic surface; 60 < 9 0 as hydrophilic surface (Fig. 2.3). The greater contact
o
angle, preferably >150 , the better water-repellency and self-cleaning abilities can be achieved [42]. The maximum CA that already obtained on a flat surface with regularly aligned closest-hexagonal-packed CF3 groups equals about 120° with extreme value of surface energy [43].
Fig. 2.3. A schematic diagram of hydrophobic surface (left), and hydrophilic surface (right).
2.3.2 Super-hydrophobicity and Roughness
A) Super-hydrophobicity in Nature
There are a large number of objects, including bacteria, plants, land and aquatic animals, and seashells, with properties of commercial interest. Fig. 2.4 shows a montage of some examples from nature [44]. Some leaves of water-repellent plants, such as Nelumbo nucifera (Lotus), are known to be super-hydrophobic and self-cleaning due to hierarchical roughness (microbumps superimposed with a nanostmcture) and the presence of a hydrophobic wax coating (Fig. 2.5). Static contact
angle of a Lotus leaf are about 164° [45,46]. The water droplets on the leaves remove any contaminant particles from their surfaces when they roll off, leading to self-cleaning [44, 47-53]. Water droplets on these surfaces readily sit on the apex of nanostmctures because air bubbles fill in the valleys of the structure under the droplet. Therefore, these leaves exhibit considerable super-hydrophobicity (Fig. 2.4a).
Pond skaters (Gerris remigis) have the ability to stand and walk upon a water surface without getting wet (Fig. 2.4b). Even the impact of rain droplets with a size greater than the pond skater's size does not make it immerse in the water.
***%
(a) (b)
Fig. 2.4. Montage of some examples from nature: (a) Lotus effect [33], and (b) pond skater walking on water [54].
Gao and Jiang [54] showed that the special hierarchical structure of the pond skater's legs, which are covered by large numbers of oriented tiny hairs (micro setae) with fine nanogrooves and covered with cuticle wax, makes the leg surfaces super-hydrophobic, is responsible for the water resistance, and enables them to stand and walk quickly on the water surface. Research on super-hydrophobic surfaces has limited attention before the mid-1990s. In fact, all studies were focused to find out the relation between contact angles and surface geometry of super-hydrophobic phenomena observed on the "triticum aestivum" plant leaves and insect cuticles [55-57]. It was mentioned that previous studies approved that the combination of suitable surface roughness and low-surface-energy materials is responsible for super-hydrophobicity. This line of research becomes reactivated because Neinhuis and Barthlott explained the origin and universal principle of the "lotus effect" in nature in 1997 (Fig. 2.5).
Lotus leaf (Nelumbo nucifem)
Fig. 2.5. SEM micrographs (shown at three magnifications) of Lotus (Nelumbo nucifera) leaf surface which consists of microstructure formed by papillose epidermal cells covered with 3-D epicuticular wax tubules on surface, which create nanostructure [45].
They have shown that lotus effect is due to the presence of a rough micro-nanostructure surface covered with epicuticular wax crystalloids that result in a surface with water contact angle greater than 150° [58]. This special surface roughness along
with covering by low-surface-energy materials is responsible for their self-cleaning properties. Surfaces with a contact angle of less than 10° are called super-hydrophilic, while surfaces with a contact angle between 150° and 180° are called super-hydrophobic surfaces. The schematic illustration and wetting behaviour of four different surfaces is presented in Fig. 2.6. As it is evident in this figure, the largest contact area between the droplet and the surface is related to the flat and microstructured surfaces; however the contact area is reduced in nanostructured surfaces and is minimized in hierarchical structured surfaces.
Wetting of four different surfaces
^ÊÊÊÊÊÊÊ^
mu
Nanostructure Microstructure Hierarchical structure
Fig. 2.6 Schematic and wetting of the four different surfaces. The largest contact area between the droplet and the surface is given in flat and microstructured surfaces, but is reduced in nanostructured surfaces and is minimized in hierarchical structured surfaces.
B) Roughness-Induced Super-Hydrophobicity,
Self-Cleaning and Low Adhesion
One of the ways to increase the hydrophobic or hydrophilic properties of a surface is to increase surface roughness, so roughness-induced hydrophobicity or
hydrophilicity has become the subject of extensive investigations. Wenzel [59] suggested a simple model predicting that the contact angle of a liquid with a rough surface is different from that with a smooth surface. Cassie and Baxter [60] showed that a gaseous phase including water vapour, commonly referred to as "air" in the literature, may be trapped in the cavities of a rough surface, resulting in a composite solid-liquid-air interface, as opposed to the homogeneous solid-liquid interface. These two models describe two possible wetting regimes or states on rough surfaces: the homogeneous (Wenzel) and the composite (Cassie-Baxter) regimes. Johnson and Dettre [61] showed that the homogeneous and composite interfaces correspond to the two equilibrium states of a droplet.
In this section, numerical models which provide relationships between roughness and contact angle and contact angle hysteresis, as well as the Cassie-Baxter and Wenzel regime transition, are discussed. A water droplet on a rough surface with a homogeneous interface, the interface area increases with respect to that for a smooth surface. Using the surface force balance and empirical considerations, the contact angle of a water droplet upon a rough solid surface, 6, is related to that upon a smooth surface, do for a homogeneous interface (Fig. 2.7a), through the non-dimensional surface roughness factor, Rf > 1, equal to the ratio of the surface area, A$u to its flat projected area, AF [59].
cos 6 = (dA
LA)/(dA
F) = (A
SI/A
F)x (dA^/Asù^ R/Cos B
o(6)
Where,
This is called the Wenzel equation. The dependence of the contact angle on the
roughness factor is presented in Fig. 2.8a for different values of 60. The Wenzel model
predicts that a hydrophobic surface (60 >90°) becomes more hydrophobic with an
increase in Rf, while a hydrophilic surface (00 <90°) becomes more hydrophilic with an
increase in Rf [40,62].
Liquid »
Wenzel Interface
Air
7A
Solid
T7 n
(a)Cassie-Baxter Interface
* i • •
J- \ Air
* Liquid
/Solid Air pockets
Cassie Interface
/7 7/
Solid
7f
(c)
T 7f
Fig. 2.7. Schematics of configurations described by the (a) Wenzel equation for the homogeneous interface (Eq. (6)), (b) Cassie-Baxter equation for the composite interface with air pockets (Eq. (9)), and (c) the Cassie equation for the homogeneous interface (Eq. (10)) [63].
As an example, Fig. 2.8b shows geometry with square-based hemispherically-topped pyramidal asperities with a rounded top, which has complete packing. The size and shape of the asperities can be optimized for a desired roughness factor. In a similar manner, for a surface composed of two fractions, one with the fractional area// and the contact angle 0/ and the other with^ and 62, respectively (so that// +f2 = l).
cos 6 =fj cos &i +f2 cos 62 (8)
For the case of a composite interface (see Fig. 2.7b), consisting of a solid-liquid fraction (/} =fSL, 0, =60) and liquid-air fraction (f2 =fu. = 1 -/SL, cos 62 =-1),
combining Eqs. (7) and (8) yields the Cassie-Baxter equation [60]:
COS 6 = RffsL COS 0o - 1+fsL
cos
6 = R
fcos Oo
-f
LA(R
fcos 0
0+ 1) (9)
The opposite limiting case of cos 62 = 1 (62 =0° corresponds to the water-on-water
contact) yields the Cassie equation [41,63]:
cos
6
= 1
+fa
(cos
G
o-
1)
(10)
Eq. (10) is used sometimes for the homogeneous interface instead of Eq. (6), if the rough surface is covered by holes filled with water [64] (Fig. 2.7c).
Two situations in wetting of a rough surface should be distinguished: the homogeneous interface without any air pockets was shown in Fig. 2.7a (called the Wenzel interface, since the contact angle is given by the Wenzel equation or Eq. (6)),
and the composite interface with air pockets trapped between through details as shown in Fig. 2.7b (called the Cassie or Cassie-Baxter interface, since the contact angle is given by Eq. (9)).
Effect o f roughness
6» =90*
Hemisphericalîy topped pyramidal asperities
\
Fig. 2.8. (a) Contact angle for rough surface (0) (Wenzel regime) as a function of the roughness factor (Rf) for various contact angles of the smooth surface (60), and (b)
schematic of square-based hemispherically-topped pyramidal asperities with complete packing [40].
Numerous super-hydrophobic materials have been produced using a range of chemical and physical methods on rough surfaces, e.g. CA of 174° using n-alkylketene dimer [65], CA of 160° using PECVD of fluoroalkylsilanes on aluminum surface [66] and CA of 162° and CAH less than 2° after being modified with octadecyltrichlorosilane (ODTS) [67]. Quéré states that a water drop can slide off a surface even if the CA is very low, say less than 20°, provided that the CAH is less than 4-5°. CAH is defined as the difference between the advancing and receding CAs of water obtained on a surface during the motion of a water drop in one direction [42].
2.4 Review of Nanoparticles incorporated in
Silicone Rubber
Silicone rubber high-voltage insulators are superior materials compared to conventional porcelain-based insulators because of their surface hydrophobic properties, light weight and easy handling. That is why they are good candidates to be used under pollution conditions [68] because of their hydrophobic properties which prevent formation of a continuous water film. In the recent years, nanoparticles incorporated polymer nanocomposites have been widely studied for their potential applications in improving the electrical performance of outdoor insulators [68-73]. Silicone rubber has good water repellence characteristics, so insulators made from silicone rubber are able to suppress leakage current. Therefore they have high flashover voltage.
Fillers have gained considerable importance in the polymer industry. They are used to achieve requirements such as higher temperature, and reduced cost. In outdoor insulation applications, fillers such as fumed silica and quartz are used to give silicone rubber good mechanical properties (elasticity, tensile strength, tear strength). Alumina tri-hydrate (ATH) fillers are mainly used to impart the tracking and erosion resistance of silicone rubber [74]. The advantages of nanoparticles incorporation into polymer coatings are obtaining controlled structural properties, increased dielectric constant and improved mechanical properties. Several studies on the structural properties of nanoparticles-incorporated polymers for different applications were reported in the literature [75, 76]. Previous studies indicated that gold nanoparticles incorporated in polymethyl methacrylate (PMMA) can improve the conductivity of the polymer [69]. Similarly, silver nanoparticles along with carbon nanotubes have been added in the polymer to study the effective conductivities of those systems [70]. On the other hand, several other studies are reported in the literature on the dielectric fillers-incorported polymers [71-73].
One of the commonly used dielectric fillers is barium titanate (BaTiOs). Choi et
al. [71] mixed BaTiO3 nanoparticles (70 nm) in polyimide polymer using two coupling
agents between BaTiO3 nanoparticles and the polyimide, namely, INAAT (isopropyl tris-(N-amino-ethyl aminoethyl) titanate, KR 44) and APTS (3-amino-propyl-triethoxysilane). The authors have shown that the dielectric constant of the BaTiO3 nanoparticles-polyimide systems increased from 6 to 14 with the increase of BaTiO3 nanoparticles from 10 to 50 (vol. %) using APTS as a coupling agent. With similar variation of volume proportion of the BaTiO3 nanoparticles, an increase in dielectric
constant from 7 to 19 has been demonstrated when INAAT was used as a coupling agent. Scanning electron microscopy (SEM) analysis revealed that the distribution of the nanoparticles was uniform when INAAT was used, which was considered as the cause of the increased dielectric constant compared to APTS coupling agent. Similarly, Kobayashi et al. [72] have prepared dielectric thin films of polymer-based materials by incorporating nanometer-sized BaTiC>3 particles in polyvinylidene fluoride (PVDF) and siloxane-modified polyamideimide (SPAI). They found that BaTiO3 nanoparticles were dispersed more homogeneously in the PVDF film than in the SPAI film. An increase in the BaTiÛ3 nanoparticle size from 10.5 to 34.6 nm in the PVDF film at a particle volume fraction of 30 % increased the dielectric constant of the film from 20.1 to 31.8. In their study, the authors reported that the BaTiÛ3-PVDF composite film attained high dielectric constant that had more than twice the dielectric constant of the BaTiC>3-SPAI composite film [72]. More work was reported in the literature on controlling the electrical properties of the nanocomposites based on TiCh nanoparticles. As an example, Li et al. [74] prepared TiOî nanoparticles-incorporated polyarylene ether nitriles (PEN) nanodielectric and found that the dielectric constant (at 1 kHz) of the composite films increased from 4 to 6. However, the electrical breakdown field (Eb) was reduced from 2160 to 1700 kV.cm"1 with the increase of TiÛ2 content from 5 wt. %
to 20 wt. %. These authors also used FTIR, XRD, XPS, SEM, and other techniques for the structural and chemical characterization of their coatings.
In light of heavy industrial application of nanodielectrics on high-voltage electrical insulators, silicone rubber coatings doped with such powders as carbon black, titania and ceria look very attractive. Silicone rubber based high-voltage insulators are


![Figure 3.7 shows the samples during ice accumulation in a wind tunnel. The distance between the nozzles and the samples was chosen long enough to reach thermodynamic equilibrium for all sprayed droplets in the wind tunnel [82-84]](https://thumb-eu.123doks.com/thumbv2/123doknet/7719369.248209/68.918.166.782.702.944/figure-samples-accumulation-distance-nozzles-thermodynamic-equilibrium-droplets.webp)