Vous avez des questions? Nous pouvons vous aider. Pour communiquer directement avec un auteur, consultez la
première page de la revue dans laquelle son article a été publié afin de trouver ses coordonnées. Si vous n’arrivez pas à les repérer, communiquez avec nous à [email protected].
Questions? Contact the NRC Publications Archive team at
[email protected]. If you wish to email the authors directly, please see the first page of the publication for their contact information.
https://publications-cnrc.canada.ca/fra/droits
L’accès à ce site Web et l’utilisation de son contenu sont assujettis aux conditions présentées dans le site LISEZ CES CONDITIONS ATTENTIVEMENT AVANT D’UTILISER CE SITE WEB.
READ THESE TERMS AND CONDITIONS CAREFULLY BEFORE USING THIS WEBSITE. https://nrc-publications.canada.ca/eng/copyright
NRC Publications Archive Record / Notice des Archives des publications du CNRC : https://nrc-publications.canada.ca/eng/view/object/?id=c7efe1ec-f05f-4ee6-a321-8008707633a3 https://publications-cnrc.canada.ca/fra/voir/objet/?id=c7efe1ec-f05f-4ee6-a321-8008707633a3
NRC Publications Archive
Archives des publications du CNRC
Access and use of this website and the material on it are subject to the Terms and Conditions set forth at
Polymeric nanocomposites: flow and technology
POLYMERIC
NANOCOMPOSITES
:
Flow and Technology
L. A. Utracki
NRCC/IMI, 75 de Mortagne, Boucherville, QC, Canada
2
Outline
#1. Thermodynamics
Clay surface energy – adsorption & brushes
Free volume calculations from PVT data
Free volume – a measure of clay dispersion
Introduction to the molten PNC structure
Global conclusions
#2. Rheology of PNC
Flow of PNC based on PA-6, PP+PP-MA and PS
Liquid-crystal flow model
Fourier transform rheology
#3. Mathematical modeling PNC
Self-consistent field (SCF) model
PNC Definitions
Polymeric nanocomposites (PNC) = polymeric matrix + dispersed in it
nanometer-size particles.
Nano-filler of industrial interest is clay, in particular natural montmorillonite, MMT, with the platelet size: 1x100x300 nm.
Two stages of clay dispersion are: Intercalation and Exfoliation.
Exfoliated clay − individual platelets dispersed in a matrix polymer with the
distance d001 > 8.8 nm. The platelets can be oriented, forming Short stacks
or Tactoids or they can be randomly dispersed in the medium.
Intercalated clay − having molecules inserted between Platelets, thus
increasing the interlayer spacing between them to at least 1.5 nm.
Intercalant − material sorbed between Platelets that binds with their surfaces
to form an Intercalate.
Interlayer spacing or d-spacing, d001, is the thickness of the repeating layers
as seen by the XRD.
Compatibilizer − material grafted to the clay surface, miscible with the
4
Methods of PNC preparation
The three principal
methods for PNC
preparation are:
1. REACTIVE (in situ
polymerization)
2. SOLUTION (dispersing
organoclay in polymer
solution)
Cell unit MW (g/mol.) 540.46 Density (g/mL) 2.3 to 3.0 Mohs Hardness @20°C 1.5- 2.0
Cleavage Perfect in one direction, lamellar Characteristic Expands up to 30 times in volume
in H2O
Appearance Light yellow with dull luster Field Indicators Softness, and soapy feel
Montmorillonite (MMT)
At T < 500°C smectites have 4 layers:
Outer layer with H2O and Na+, K+, Ca++, Mg++ ions.
3-layer sandwich: octahedral central between two tetrahedral: SiO2-(Al/Mg)-SiO2; 0.956 nm thick. MMT: monoclinic, contains ca.:
(Na,Ca)(Al,Mg)6(Si4010)3(OH)6-nH20], has:
Al = 10, Si = 21, H = 4, and O = 65 (wt%); aspect
ratio: p ≅ 100 to 300; sp. surface area,
Asp ≅ 750 to 800 m2/g; Cation exchange capacity:
CEC ≅ 1.0 ± 0.2 meq/g.
Reactive sites: anions and –OH groups on the surface; and cations and –OH groups at the rim.
0.96 nm
6
Commercial intercalated clays contain quarternary amines (Southern Clay Products, 2000). The cation exchange capacity of MMT: CEC = 100 ± 20 meq/100 g.
Equilibrium of NaMMT reaction with ammonium salt is shifted left, hence excess of onium salt is often used, i.e., 0.9 to 1.4 meq/g or 23 to 40 % of the organic modifier.
Intercalated clay contains 2 to 4 % water and up to 40 wt% of organic compounds.
Intercalation increases the cost of clay from US$2,000 to US$7,000/ton.
Organoclays
Clay surface energy
The surface energy,
σ
s=
ν
1
A, depends on the
nature and structure
of material.
Polymer surface tension coefficients at 20°C:
ν
1 = 10 to 49 mN/m The surface tension coefficient of crystalline solid:ν
1 = 1-8 N/mThe high surface energy causes molecular adsorption
ν1 of freshly cleaved mica is 4,500 that exposed to air is 375 mN/m.
(
)
211
/ 2
11/
N
R
R
ε
== ×
ν π
∝
ν
Molecular adsorption causes
solidification
of organic molecules
on the clay surface.
The solid layer is ca. 6 nm thick, thus it increases clay platelet thickness from 1 to about 13 nm (see next slide).
Molecular mobility is retarded up to ca. 100 nm from the clay surface.
Another consequence of high surface energy is the
aggregation
of
solid powders.
According to Johnson et al. [1971], the force between two interacting spheres of radius R is:
8
Adsorption on solids
Owing to high surface energy of crystals (100 x of liquids) the
macromolecules are readily adsorbed
[Israelachvili, 1991].2
6 / H / o
G ≡ πR D F = D η
1/η
oThe surface force analyzer (SFA) measured the mobility profile of adsorbed PS from a good solvent (toluene) – bulk mobility at D/2 > 110 nm!
The amount of adsorbed polymer depends on PS molecular weight and χ
Gnomix
®
PVT
instrument
10
Example of PVT data
S-S theory provides good description of the observed
PVT dependencies for
PA
as well as for its
PNC
.
0.94 0.98 1.02 1.06 480 520 560 600 experimental computed from S-S S pe c if ic v ol u m e, V (m L/ g ) T (K) P = 0.1 - 200 MPa Ube PNC 0.95 1 1.05 1.1 480 520 560 600 Ube PA-6 experimental computed from S-S S pe c if ic v ol u m e, V (m L/ g ) T (K) P = 0.1 - 200 MPa V (mL/g)
Fitting the PVT data to the theoretical equations
provides two main sets of information:
The free volume (hole) fraction, h = h(P, T),
and
The reducing parameters: P*, V* and T*, from which the
bulk-average interaction parameters, <
ε
*> and <v*>, may be
computed.
PVT of PNC 1
The temperature and pressure dependent free volume
function h was shown to correlate with the degree of
exfoliation, d
001.
The concentration dependent interaction parameters
have been used to examine the PNC structure on the
molecular level.
Comparing the theoretical models with the bulk-average
interaction parameters, <
ε
*> and <v*>, indicates which one of
them is the closest to reality.
The selected model yields the numerical values of the
individual binary parameters,
ε
ij*, and v
ij*.
12
S-S Quasi-lattice
Hole fraction: h = 1 – y(V, T) is a measure of disorder.
Occupied sites Hole
(
)
(
)
V,T TF
F V, T; y(V, T); c / s
Minimization :
F / y
0
Equation of state : P
F / V
=
∂ ∂
=
= − ∂ ∂
Free energy
For s-mer:
Scaling parameters: P* = qzε
*/sv*; V* = v*/Mo; T* = qzε
*/cR → (P*V*/T*)Mo = Rc/sv*: segmental repulsion volume
ε
*: segmental attraction energy3c/s: number of external modes (volume-dependent degrees of freedom) per segment:
Ideal flexible linear chain: 3c/s → 1 Rigid chain: 3c/s → 0
S-S lattice-hole theory
The S-S theory describes the thermodynamic properties
of liquids, explicitly providing information how the hole
fraction (h = 1 - y) changes with independent variables.
(
)
(
)
(
)
(
)
(
) (
)
(
)
(
)
(
)
( )
1 2 2 2 2 1 1 6 1 31
2
0
3
1 3
1
3
2
6
1
1
0
1 011
1 2045
2
T V ,T / /P
F / V
PV / T
yG
AQ
B / T
F / y
c
/
/
yQ
AQ
B / T
s
s ln
y / y
where :
A
.
; B
.
;
yQ
; Q
yV
∂
∂
η
η
η
η
− − −≡ −
⇒
= −
+
−
∂
∂
=
⇒
−
−
−
−
+ − −
−
=
=
=
=
=
From the Helmholtz free energy, F, using standard
definition of P and thermodynamic equilibrium condition
a coupled equation of states (eos) was derived:
14
Assuming random mixing in binary mixtures, Jain & Simha (1979)
expressed the Helmholtz free energy in terms of averages, <>:
The two cross-interaction parameters are expressed as:
Fm / RT = x1 ln x1 + x2 ln x2 + (< s > /y)(1 − y)ln(1 − y) − (< s > −1)ln[(z − 1) / e] − < c > {ln[< v* > (1 − η)3 / Q] − (yQ2 / 2 ˜ T )(AQ2 − 2B)} − (3 / 2){x1c1 ln[ 2π < Mo1 > RT(NAh)−2]+ x2c2ln[2π < Mo2 > RT(NAh)−2]} < s >= x1s1 + x2s2 ; < c >= x1c1 + x2c2 ; < Mo >= (x1s1Mo1 + x2s2Mo2)/ < s > < ε* >< v* >k= X 1 2ε 11 * v11*k + X22ε22* v22*k + 2X1X2ε12* v12*k ; k = 2,4 where X1 = 1 − X2 = x1[s1(z − 2) + 2]/ < qz >
Binary mixtures
With definitions:
(
)
* * * 12 11 22 v 3 * *1/ 3 *1/ 3 12 v 11 22Interaction energy :
;
1
Re pulsion volume: v
v
v
/ 8
ε εε = δ ε ε
δ ≅ δ ≅
= δ
+
PVT of PA-6/clay PNC 1
In binary mixtures the interaction parameters are
molar averages.
Polymeric Nano-Composites (PNC) are mixtures of two
components: flexible PA-6 and rigid “particles” of clay.
The idealized clay particle is 100 nm in diameter and 1 nm in
thickness, hence its “molecular mass” and “molecular volume” is:
M = N
Aρ
πd
2h/4 = 10,443 (kg/mol),
and
V
plat=
π(d/2)
2h = 4.73
×10
6(mL/mol).
The lattice-hole theory assumes that the hard core volumes of the
constituents do not differ too much, usually equal.
For the inherent to the theory 6-12 potential the factor 2
1/2relates
the positions of potential minimum and onset of repulsion, thus for
PA-6:
v*
hard= M
sV*/2
1/2= 17.60 (mL/mol)
also adopted for the clay “segment”.
Ref.: R. Simha, L. A. Utracki and A. Garcia-Rejon, “Pressure-Volume-Temperature Relations of a Poly-ε-caprolactam and its Nanocomposite”, Composite Interfaces, 8, 345-353 (2001); L. A. Utracki, R. Simha, and A. Garcia-Rejon, “Pressure-Volume-Temperature Relations in Nanocomposite”,
16
PVT of PA-6/clay PNC 2
To directly compare the specific volume and the hole fraction
variations with T and P for PA and PNC, the ratios V(PA)/V(PNC)
and h(PA)/h(PNC) at identical T and P for each point are shown.
1 1.05 1.1 1.15 1.2 500 520 540 560 580 600 T (K) 0.1 50 110 150 190 P (MPa) 190 150 110 50 0.1 V(PA)/V(PNC) h(PA)/h(PNC)
Theoretical V-ratio for
PNC with 0.64 vol%
clay is:
V(PA)/V(PNC) =
1.0088.
The experimental
ratio:
V(PA)/V(PNC) =
1.008 to 1.018.
The holes ratio:
h(PA)/h(PNC) =
PVT of PP-based PNC 1
Computed values of the characteristic reducing parameters, as well as assessment of the goodness of fit are presented above.
For the sake of comparison the data published by Zoller are also shown.
To develop a model, first only the samples: A, B, 1, and 5 were used.
Ref.: L. A. Utracki, and R. Simha, “Pressure-Volume-Temperature Dependence of Polypropylene/
Organoclay Nanocomposite”, Macromolecules, 37, XXX (2004).
Computed S-S eos parameters for PP and PP-PNC
# Code Sci# C15A Mo P* (bar) 10000V* T* (K) r2 σ
IPP Zoller ppz 0 40.853 6043 ± 79 1,1827 ± 24 10535 ± 56 0.999997 0.002045 0 PP 2845 0 50.459 4973 ± 113 1,1932± 42 10804 ± 117 0.999998 0.001706 A PP256 256 0 43.115 5727 ± 68 1,1728 ± 22 10449 ± 57 0.999998 0.001647 1 E0-2100 2867 2 48.364 5169 ± 103 1,1874 ± 37 10712 ± 98 0.999998 0.001916 B PP256 pnc 3 46.720 5457 ± 55 1,1712 ± 18 10775 ± 49 0.999998 0.001845 2 E1-2-E43 3578 2 49.432 5230 ± 117 1,2060 ± 42 11251 ± 120 0.999996 0.002505 3 E1-2-3150 3045 2 51.585 4923 ± 99 1,1971 ± 37 10970 ± 101 0.999996 0.002482 4 E2-2GMA 2923 2 47.774 5247 ± 95 1,1993 ± 34 10848 ± 90 0.999997 0.002261 5 E0-3200 2989 4 50,748 5028 ± 93 1,1857 ± 34 10917 ± 92 0.999997 0.002274 6a E1-E43 3069 0 49.194 5111 ± 95 1,1926 ± 34 10820 ± 91 0.999997 0.002350 6b E1-4-E43 367 4 45.611 5625 ± 146 1,1731 ± 48 10860 ± 132 0.999996 0.002421 7 E1-4-3150 3450 4 48.490 5266 ± 93 1,1931 ± 33 10993 ± 91 0.999996 0.002554 8 E2-4GMA 3151 4 49.412 5203 ± 96 1,1807 ± 34 10952 ± 94 0.999997 0.002272 9 M1 3167 2 52.238 4924 ± 90 1,2000 ± 34 11138 ± 95 0.999997 0.002256 10 M2 3224 2 46.893 5483 ± 105 1,1784 ± 36 10933 ± 100 0.999997 0.002251
18
PVT of PP-based PNC 2
Basics:
The “molecular mass” of clay platelet 100 nm diameter and 1 nm thick: M = NA ρπd2h/4 = 10,878 (kg/mol).
The “molecular volume” of clay platelet:
Vplat = M/
ρ
= NAπ
(d/2)2h = 4.73 106 (mL/mol).The lattice is built of cells of constant volume, accommodating one hard core statistical segment of clay or one hard core statistical segment of PP with the molecular volume of:
v*hard = 28.9/21/2 = 20.4 (mL/mol).
Thus, the number of segments for PP (s1) and clay (s2) are:
s1(PP) = 4871, and
s2 = Vplat/v*hard, = 2.6873 105
The site fractions are defined as:
X1 = 1 = X2 = x1zq1/( x1zq1 + x2zq2)
where x1 + x2 = 1 are molar fractions, e.g.:
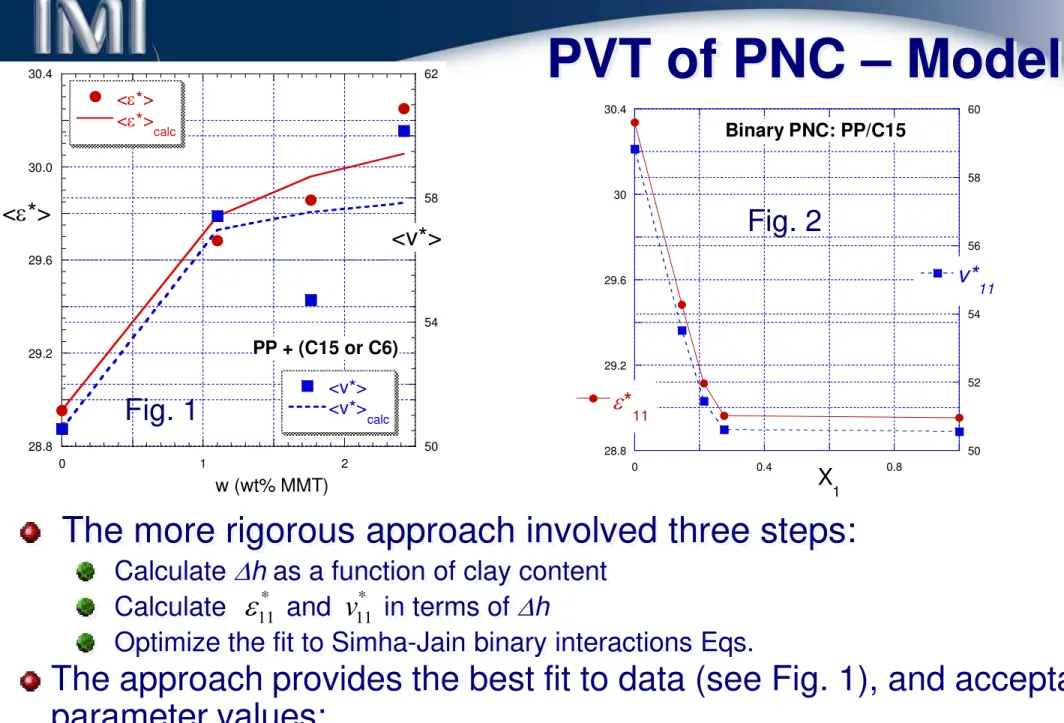
PVT of PNC – Model 1
The input data are:
PP + C15A
There are two possibilities of interpretation:
Assume that organoclay platelets
are dispersed in PP matrix as short
stacks – no good (see Figure
⇒).
28.5 29.5 30.5 31.5 50 54 58 62 0 1 2 3
PP with Cloisite 15A EAV EAV calc VAV VAVcalc <ε*> <v*> Clay content, w (wt%)
Assume
inorganic
platelets
are
coated with 6 nm thick solidified PP
and dispersed in PP matrix with
properties changing with the distance
from the clay platelet.
Depending on the assumption the
side fractions, X
, will vary.
20 The second assumption implies that the solid components are 13 nm
thick, and only ≥100 nm away from the clay surface bulk PP properties are to be found.
PVT of PNC – Model 2
In Fig. 1 the average thickness of molten PP above clay platelet is shown as a function of clay concentration.
100 1000
0 1 2 3 4 5
Condition for absence of concentration-independent molten polymer: x 1 = X1 = 0 T hi c k ne s s of a ds o rb ed po ly m er , ∆ h (n m) Clay content, w (wt%) Fig. 1 Fig. 2 0 40 80 0 40 80 5 4 3 2 1.5 M a tr ix inte ra cti on pa ram et e rs , ε 11 * or v 11 * z (nm) n ( )
{
0[ ]}
0 0 0 o y y y( z ) ; z z z y y y exp n ( z z ) /( z z ) ∞ ∞ ∞ ∞ = ≤ < − − − −In Fig. 2 assumed profile of property vs. distance from clay platelet surface,
∆
h, is shown. The curves were computed from:PVT of PNC – Model 3
Figure 2 illustrates the predicted variation of matrix properties.
Fig. 2 28.8 29.2 29.6 30 30.4 50 52 54 56 58 60 0 0.4 0.8 Binary PNC: PP/C15 ε* 11 v* 11 X 1 28.8 29.2 29.6 30.0 30.4 50 54 58 62 0 1 2 PP + (C15 or C6) <ε*> <ε*> calc <v*> <v*> calc <ε*> <v*> w (wt% MMT) * * * * * * 22 30.3 1.0; 22 / 10 1.047; v22 58.6± 1.0; v / v22 10 1.158 ε = ± ε ε = = =
The approach provides the best fit to data (see Fig. 1), and acceptable
parameter values:
Fig. 1
The more rigorous approach involved three steps:
Calculate ∆h as a function of clay content
Calculate and in terms of ∆h
Optimize the fit to Simha-Jain binary interactions Eqs.
11 * v 11 * ε
22
Next, the variation of hole
fraction with composition was
examined by computing the
relative rations of the specific
volume and the hole fraction:
Vr
≡
V(PNC)/V(PP) hr≡
h(PNC)/h(PP).The Figure for PP/C15A series
shows that addition of
organoclay (no compatibilizer)
has very little effect on sample
density, but it reduces the free
volume (at P = 10 MPa):
At 2 wt% C15A by ca. 4.7% At 4 wt% C15A by ca. 8.0%
PVT of PP-based PNC 3
0.9 0.94 0.98 1.02 440 480 520 560PP with 2 or 4 wt% C15A at P = 10 MPa
V r (2%) V r (4%) h r (2%) h r (4%) h r = h (P NC )/ h (PP) ; V r = V( PN C) /V( PP) T (K)
Owing to lower compressibility
of PNC than that of a polymer
the magnitude of h
rincreases
with P.
From the PVT fit the reducing parameters and then the average values of the interaction parameters were calculated:
P* = zq<ε*>/(s<v*>); T* = zq<ε*>/Rc; V* = <v*>/Ms
The minimum in the hole fraction (at ca. 2 wt% C10A) corresponds to maximum clay platelets dispersion.
There is a simple relation between the free volume and the average
interaction parameter, <ε*>.
The two average interactions parameters are proportional to each other.
0.93 0.95 0.97 0.99 1.01 0 10 20
PS1301 with Cloisite 10A; P = 10 bar
T = 360 K T = 460 K T = 560 K R e la tiv e h o le fr a c ti o n , h (PN C )/ h (PS) Organoclay content, w (wt%) 1.00 32.4 32.8 33.2 43.0 43.4 43.8 44.2 44.6 0 10 20
PS1301 with Cloisite 10A
<ε ij> <v* ij> < ε ij > (k J /m o l) <v * ij > ( m L /m o l) Cloisite 10A (wt%) 0.93 0.95 0.97 0.99 1.01 32.4 32.8 33.2 h r(360) = 3.4589 - 0.075686ε* ; r 2 = 0.99992 h r(460) = 2.9245 - 0.059237ε*; r 2 = 0.99992 h r(560) = 2.6834 - 0.051815ε*; r 2 = 0.99994 h r = h (PN C )/ h (P S) <ε*> w = 0 w = 1 .4 w = 2 .8 w = 5 .7 w = 1 0 .6 w = 17. 1
PVT of PS-based PNC
24
The Figure shows interlayer
spacing,
d
001, for PNC samples
containing 2-wt% organoclay.
Several compositions were
measured using different specimens
– the standard deviation of the data
was established as ± 0.15 nm.
The Figure illustrates the correlation
between d
001, and computed from
the PVT data reduction of h (at 100
MPa; 500 K).
PVT of PNC 2
2 6 10 14 0 4 8 12 16Correlation for 2 wt% organoclay
PNC without compatibilizer: ∆h = 2.50 + 0.833d011; r = 1 PP-PNC with compatibilizer: ∆h = -21.73 + 9.38d001; r = 0.927 ∆ h ( % )= 10 0[ 1 h( P N C )/ h( pol y )] d 001 (nm) PA-6 PP PS
Two dependencies are seen:
For a two component PNC (polymer/organoclay)
For three component: PP/organoclay/compatibilizer systems.
The compatibilizers (PP grafted with MAH or GMA) dramatically
reduced h with only a small effect on d
001(immiscibility)
.
Summary of Part #1:
Thermodynamics
Clay platelets, with 40% atoms on the surface, have high
surface energy, and are poly-ionic (hydrophilic).
To extract meaningful binary parameters from the bulk-averaged
ones, a “hairy-clay platelet” (HCP) model was postulated:
The model assumes presence of:
Solid particles of clay enrobed with 6 nm thick layer of organic solids
A matrix composed of non-solidified melt (intercalant, polymer, and compatibilizer) – at a distance of 6 to 100 nm the matrix properties vary.
The loss of the matrix free volume linearly depends on d001: ∆h = ∆h(d001). The loss of free volume is expected from the reduction of mobility.
The Simha-Somcynsky eos well describes the PVT, yielding:
The bulk-averaged (Lennard-Jones type) interaction parameters The free volume parameter, h = h(V, T).
Molecular adsorption causes formation of two layers:
6 nm thick solidified inner layer
26
Rheology of PNC
Thermodynamics suggest the hairy-clay platelet (HCP)
model for PNC.
PA-6 and PA-6-based PNC from Ube were dried and then
compounded
in a TSE with: 0; 25; 50; 75; and 100% of PNC.
The rheological tests were carried out at 240°C under blanket
of dry N
2 [Utracki & Lyngaae-Jørgensen, Rheologica Acta, 41, 394 (2002)].During the time sweep the storage (G’) and loss (G”) shear
moduli increased with time, due to polycondensation &
exfoliation.
The rates of these two processes differently depended on the
intercalated clay content.
All raw data were corrected for the polycondensation effects
by extrapolating the measured signal to t = 0.
Time-sweep of PA-6 with
2-wt% Cloisite
®
15A
T = 240oC γo = 0.10 ω = 6.28 rad/s dried for 48h at 80°C Time (s) 0 2000 4000 6000 8000 η ' (Pa .s ) 200 400 600 800 1000 1200 UBE1015C2 TSE TSE+GP Gap = 1000 µm Gap = 60 µm Gap = 30 µm Gap = 5 µm T = 240oC γo = 0.10 ω = 6.28 rad/s dried for 48h at 80°C Time (s) 0 2000 4000 6000 8000 G ' ( P a ) 0 500 1000 1500 UBE1015C2 TSE TSE+GP Gap = 1000 µm Gap = 60 µm Gap = 30 µm Gap = 5 µmThe dynamic viscosity (left Figure) and the storage modulus (right Figure) are presented [M. Sepehr, 2004].
The polycondensation rate decreases with the increasing degree of clay dispersion.
28
Frequency sweep
at T = 240°C,
γ
= 10 & 40%
The data were fitted to the
relation, where:
η
o= zero-shear viscosity,
τ
= the prime relaxation time,
n = the power-law exponent.
2 1 1 2
"/
1 (
)
1
m m oG
n
m m
ω η
=
+
ωτ
−= −
2.4 2.5 2.6 2.7 2.8 -1 0 1 2Summary of dynamic viscosity data
PA 25% PNC 50% PNC 75% PNC 100% PNC lo g η ' log ω T = 240oC; γ = 40%
Next, from ηo the relative viscosity vs. clay volume fraction was calculated:
The intrinsic viscosity, [
η
], is related to the aspect ratio, p: [η
] = 2.5 - a(1-pb).The calculated value p = 287 ± 9 agrees well with p = 286 determined from the oxygen permeability data.
(
)
2 ' ' ,/
1 [ ]
[ ]
r o o PAk
η η η
≡
= +
η φ
+
η φ
LCP model
Flow of PA-6/PNC follows the LCP behavior
The flow of liquid crystal polymers (LCP) is
characterized
by the
presence of three regions [Onogi & Asada, 1980]:
I – The poly-domain structure is gradually destroyed by shear.
II – The nematic domains rotate in a mono-domain continuous matrix. III –The tumbling flow of II is gradually replaced by flow alignment.
0.1 1 10
-3 -2 -1 0 1 2 3
Three regions of flow of nematic LCP
(after Onogi & Asada, 1980)
lo g (n em at ic v is co si ty )
log (rate of shear)
Region I Region II Region III
200 400 600 800
0.01 0.1 1 10
Steady-state shearing of PNC with ∆t (s) between data points (T = 240oC)
540 360 180 90 0 S he ar vi sc osi ty , η ( P as) Rate of shear (1/s) ∆t (s)
30
Stress overshoot
The magnitude of the stress overshoot depends on the rest time
at 240
oC (see
Fig.
B
).
It takes about 1 hr for the platelets to return to the pre-shear
random orientation.
0 100 200 0 1000 2000 3000 4000 experimental computed ∆ η ( P as ) Rest time, t(s) ∆η = a exp{-b/t} a = 212.6 ± 7.4 b = 290.4 ± 28.9 r2 = 0.9967 BOrientation of clay platelets leads to a strong stress overshoot effect
when the direction of shearing is reversed (see
Fig.
A
).
500 600 700 800 900 1000 0 1000 2000 3000 4000 5000
Flow reversal for PNC at T = 240oC
Rest time = 500 s Rest time = 2000 s Rest time = 4000 s V is co si ty , η ( Pa s) Time, t(s)
Base line (polycondensation)
FTR of PA-6 PNC
The Fourier-transform rheology (FTR) is a new method for quantifying the non-linear viscoelastic behavior of matter.
Left Figure shows the raw data: input peak and 3rd harmonic.
Right Figure show the relative intensity of the 3rd harmonic – a measure of
non-linearity as a function of frequency, strain and shearing time.
PNC: time sweep at T = 240°C, ν = 10 Hz Frequency (Hz) 0 10 20 30 40 Int ens it y 0 600 800 1000 0 1 2 0 400 800 1200
Fourier transform rheology for PNC
ν = 1 Hz; γ = 20% ν = 1 Hz; γ = 30% ν = 1 Hz; γ = 60% ν = 1 Hz; γ = 70% ν = 10 Hz; γ = 70% Rel at ive in tens ity , R 3 = 1 00 (I 3 /I 1 ) Shearing time, t(s) ν = 10 Hz ν = 1 Hz
32
Rheology of PS PNC
PS-based PNC were
prepared in solution and by melt compounding
PS with 0 to 10-wt% Cloisite
®10A (C10A) in a CORI.
C10A = MMT pre-intercalated with di-methyl benzyl hydrogenated
tallow ammonium chloride.
Owing to
thermo-oxidative degradation
of C10A the degree of
dispersion was poor, viz. the aspect ratio:
p = 16 – to be compared
with p = 269
determined for the solution-prepared PNC.
Flow properties were determined in dynamic and steady state shear
as well as under extensional flow conditions.
The Fourier-transform rheology (FTR) indicated strong dependence
on strain but weak on time.
The time-temperature superposition held in the full range of
variables.
Strain hardening in extensional flow of the PNC (with 0 to 10 wt%
C10A) was virtually concentration-independent.
33
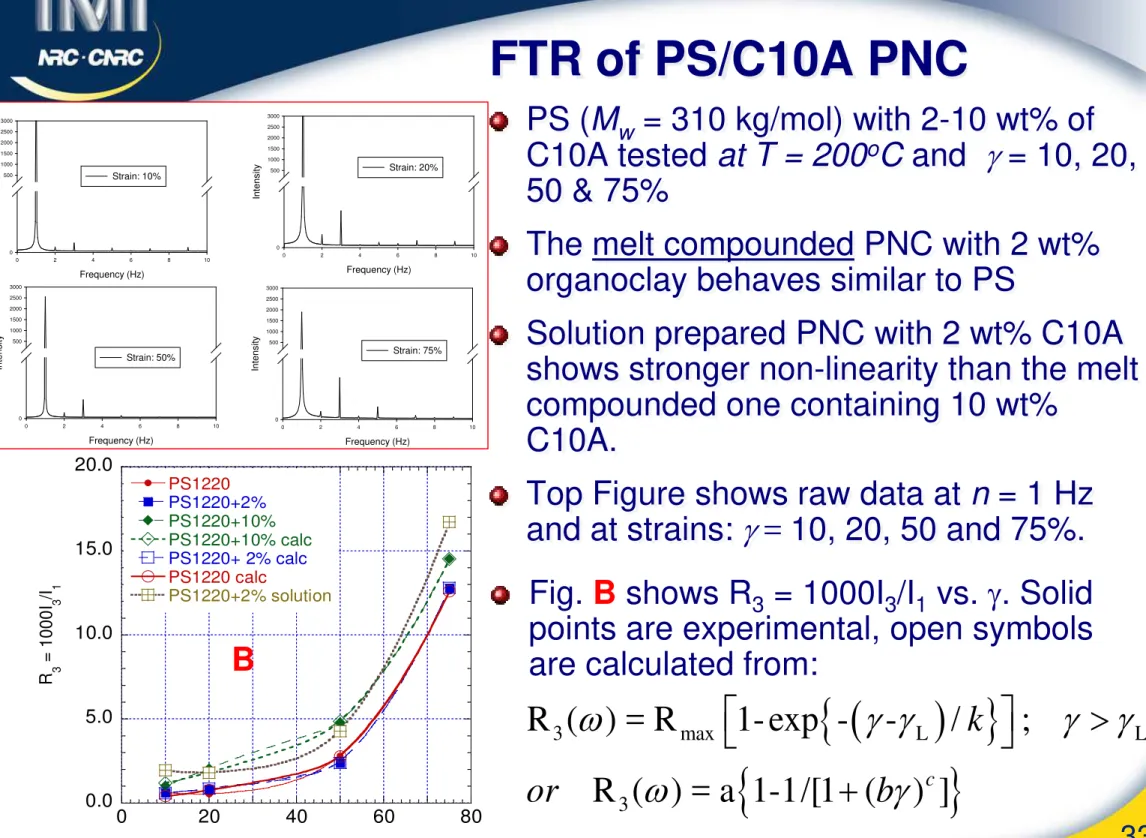
FTR of PS/C10A PNC
PS (Mw = 310 kg/mol) with 2-10 wt% of C10A tested at T = 200oC and
γ
= 10, 20,50 & 75%
The melt compounded PNC with 2 wt% organoclay behaves similar to PS
Solution prepared PNC with 2 wt% C10A shows stronger non-linearity than the melt compounded one containing 10 wt%
C10A.
Top Figure shows raw data at n = 1 Hz and at strains:
γ
= 10, 20, 50 and 75%.Frequency (Hz) 0 2 4 6 8 10 In te n s ity 0 500 1000 1500 2000 2500 3000 Strain: 10% Frequency (Hz) 0 2 4 6 8 10 In te n s ity 0 500 1000 1500 2000 2500 3000 Strain: 20% Frequency (Hz) 0 2 4 6 8 10 In te n s ity 0 500 1000 1500 2000 2500 3000 Strain: 50% Frequency (Hz) 0 2 4 6 8 10 In te n s ity 0 500 1000 1500 2000 2500 3000 Strain: 75%
(
)
{
}
{
}
3 max L L 3R ( ) = R
1- exp -
-
/
;
R ( ) = a 1-1/[1 (
) ]
ck
or
b
ω
γ γ
γ γ
ω
γ
>
+
0.0 5.0 10.0 15.0 20.0 0 20 40 60 80 PS1220 PS1220+2% PS1220+10% PS1220+10% calc PS1220+ 2% calc PS1220 calc PS1220+2% solution R 3 = 1000 I 3 /I 1 BFig. B shows R3 = 1000I3/I1 vs. γ. Solid points are experimental, open symbols are calculated from:
34
Summary of Part #2:
Rheology of PNC
The characteristic feature of the PNC flow is the presence an
yield-like behavior at low deformation rates, i.e., the viscoelastic
non-linearity (VNL).
The better dispersed is the system, the higher is the VNL.
The flow of exfoliated PNC resembles that of lamellar LCP with very
large mesogens (relaxation time of ca. 60 min).
Fourier-transform rheology (FTR) is a useful tool for
characterization of VNL hence the degree of dispersion.
To interpret the PNC flow behavior the hairy-clay platelet (HCP)
model was used:
The clay are enrobed in solidified organic phase, from which emanate long, able to entangle macromolecules
Consequently, for well dispersed PNC the VNL behavior is observed at
concentration below that calculated from the encompassed volume principle. Owing to large aspect ratio (p ≤ 300) there is a strong orientational effect
Grafted clay platelets
Properties of end-grafted polymers on solid surface have been studied for
nearly 30 years.
In melt of polymer P clay grafted with chemically identical, end-terminated polymer N is dispersed; N ≤ P.
For low
σ
, the phase diagram show swollen (S) and ideal (I) mushrooms(M), at higher S-, and I-stretched brush, as well as non-stretched brush (NSB); for high
σ
> N-½, and high P > N the brush is non-penetrating – the grafted clay phase separates from the melt [Gay, 1997].Immiscible
mushrooms
36
Aggregation of grafted clay
Consider two clay platelets grafted at the grafting density
σ
with chains of length L.
The energy of interaction free energy between such two
platelets at a separation H is F = F(H).
Computations [
Ferreira et al., 1998; Wang et al., 2003] indicate
repulsion for low
σ
and L, but
aggregation
at higher values
of these variables.
Numerical model for CPNC
macromolecules
Physical Chain model
Statistical Representation
Clay platelet (s): No conformational energy
Host polymer (h): Conformational and mixing energy
Compatibilizer (g): Strong bonding to the surface
Organic modifier (o): Strong bonding to clay surface
Kuhn Segment MW ≅ 260
z
x
Strong bonding of s with o & g38
Vaia’s model
Vaia’s thesis
of 1995 provided the first thermodynamic
description of PNC as a function of distance (h) between
platelets (r
iis radius of interacting segment).
Intercalant entropy gain only up to full stretch (Dolan-Edward).
Macromolecule entropy loss within the sandwich (Huggins-Flory).
Enthalpy taken from van Opstal et al. (1991);
ε
ho≈ 0:
-4 -2 0 2 0 1 2 3 ∆S A /R (1 0 6 /m 2 ) h - h o (nm) Intercalant Polymer Total
∆G = ∆H –T∆S
-10 -5 0 5 10 0 1 2 3 ∆ F A ( mJ /m 2 ) h - h o (nm) ε sh, so = 0 ε sh, so = - 4 ε sh, so = - 8 ε sh, so = - 10(
)
[
]
1 2 , 2 1 2 2 1 2 1 ˆ ˆ 2 / / ˆ ˆ ˆ 1 1 ( / ) ( / ) sh so o ho v o h r e r r r h ϕ ϕ ε ε ϕ ϕ ε ϕ + ∆ = ∆ = − − −Only
intercalation
Balazs et al. contribution 1
The 1D SCF lattice model [Balazs et al., 1998] considers two, parallel, infinitelylarge clay platelets in molten polymer bath. The properties change with the
short range interactions, ε, and the distance from clay surface, ho < z < h :
Free energy per unit area as a function of surface separation for five different values of the polymer-intercalant interaction parameter, χho. Other parameters are: N = 100; Ni = 25 and
χsh = χso = 0. In the LHS and the RHS Figures the grafting density: ρ = 0.04 and 0.12,
respectively. The cartoons, left and center, show the initial and final state, respectively,
where the surfaces are separated by macromolecules.
( ) i( ) ln i( ) (1/ 2) ij ( ') ( ) ( ')i j '
i ij
40 -0.8 -0.4 0 0 10 20 0% 5% 10% 30% 70% ∆F/ A h
after: Balazs et al., 1998
0 4 8 0 10 20 N p = 50, 100 N p = 10 N p = 1 Θ (h ) h
Free energy vs. gallery
height for
clay-polymer-”sticker” system (its
content is indicated).
Thus, 5 wt% of “sticker”
is sufficient for
exfoliation.
The amount of adsorbed “sticker”
polymer with N
gr= 75 and
concentration φ = 0.05 for four
chain lengths of the
non-functionalized polymer, N = 1, 10,
50 and 100
[Balazs et al., 1998].∆F/A
5% is sufficient
Θ
Phase structures for CPNC:
(a) isotropic, (b) nematic, (c) smectic, (d) columnar, (e) plastic solid (house of cards), and (f) crystal. The nematic director is in the Z direction, platelets
in X-Y [Ginzburg et al., 2000].
Computed phase diagrams of
polymer-clay mixtures: (a) ρ = 0.04,
Ni = 50, and (b) ρ = 0.02, Ni = 100.
42
Fundamentals 1
Excess free energy
Conformational Entropy:
Number of ways to occupy free lattice site
Mixing Enthalpy:
Huggins-Flory short-range
parameters
solid-liquid :χ
hs,χ
hs ,χ
osLong-range interactions for
solid-solid:
Van der Waals force between clay plates
with Hamaker constant, A:
liquid-liquid :
χ
hg,χ
hg,χ
ho d s 212
A s
F
d
π
−
=
Fundamentals 2
Equilibrium Thermodynamics.
∆F
o h 1 2 3 1 Immiscible ( ∆F > 0 ) 2 Intercalated (minimum on ∆F ) 3 Exfoliated [∆F (h→∞) < 0]Solid inorganic clay Macromolecules
44
Fundamentals 3
Enthalpy
Solid energy
Entropy
Low area-lattice ratio Poor solubility
Short chain Thin gap
High area-lattice ratio
Unfavorable
∆
F
→(+)
* Area-lattice ratio of solid (bare) surface:
ε
= s / aFavorable
∆
F
→(−)
Long chain
Thick gap Good solubility
d
s
(a) Kim et al. (2004)
Self-consistent field (SCF)
1
For 1D the influence of statistical chain length on the
excess free energy (N
h= 100, N
g∈[25,100],
ρ
g= 0.04,
χ
gh= 0)
Ref.: K. Kim, L. A. Utracki and M. R. Kamal, “Numerical Simulation of Polymer Nanocomposites using Self-Consistent Mean Field Model”, J. Chem. Phys., accepted (2004)
46
The system: clay +
compatibilizer, N
g= 100, +
polymer N
h= 100; grafting
density:
ρ
g= 0.04
1D computational model
Computed effects of the
binary intercalation parameter
on the chemical composition
of the lattice layers, z = 1 – 20.
Results:
For χhg > 0 compatibilizer is
immiscible with h-polymer
For χhg = 0 the system is miscible.
The miscibility increases with χhg
and Ngr .
Data: K. Kim & LAU, 2003
Self-consistent field (SCF)
2
Compatibilizer content
Fig. 1;
χ
hg= 0.02
Fig. 2;
χ
hg= 0.00
Fig. 3;
χ
hg= -0.02
Optimization of compatibilizer content
The 1D free energy (h → ∞) for homopolymer with N
h= 200
depends on:
Compatibilizer N
g∈ [25, 200],
ρ
g∈ [0.02, 1],
Binary interaction parameter:
χhg∈ [−0.02, 0.02].
Following Balazs et al. publications, the 1D model assumes
clay platelet enrobed by intercalant.
48
The binary interactions are taken for the PNC with PP as the
matrix, i.e., for PP/compatibilizer/intercalant/clay.
1D result for 4-components 1
The influence of the solid area-lattice ratio (ε) and binary
interaction (χ
hg) on the excess free energy
Statistical chain lengths:
Ng = 200, Nh = 400, No = 10
Surface grafting density:
ρ
g = 0∼20%,ρ
o = 70%,ρ
v = 2∼5%Solid-solid interactions:
A = 20(kBT),
ε
∈ [0,50]Binary interaction parameters:
χ
hg = 0,χ
ho = 0,χ
go = 0,χ
hs = 0.01,Comparing with the preceding graph one may conclude that
doubling the void fraction significantly improved miscibility (
∆
F <0).1D result for 4-components 2
The influence of the solid area-lattice ratio (ε) and binary
interaction (χ
hg) on the excess free energy (higher vacancy
fraction)
Statistical chain lengths:
Ng = 200, Nh = 400, No = 10
Surface grafting density:
ρ
g = 0∼20%,ρ
o = 70%,ρ
v = 5∼10%Solid-solid interactions:
A = 20(kBT),
ε
∈ [0,50]Binary interaction parameters:
χ
hg = 0.0,χ
ho = 0,χ
go = 0,50
Favorable polymer/compatibilizer interactions, along with favorable solid grafting interactions and high vacancy fraction are expected to lead to easy exfoliation.
1D result for 4-components 3
Statistical chain lengths:
Ng = 200, Nh = 400, No = 10
Surface grafting density:
ρ
g = 0∼20%,ρ
o = 70%,ρ
v = 5∼10%Solid-solid interactions:
A = 20(kBT),
ε
∈ [0,50]Binary interaction parameters:
χ
hg = -0.02,χ
ho = 0,χ
go = 0,Unfavorable (repulsive) interactions between polymer and
compatibilizer have a dramatic effect on system miscibility, in spite of favorable solid grafting interactions and high vacancy fraction.
1D result for 4-components 4
Statistical chain lengths:
Ng = 200, Nh = 400, No = 10
Surface grafting density:
ρ
g = 0∼20%,ρ
o = 70%,ρ
v = 5∼10%Solid-solid interactions:
A = 20(kBT),
ε
∈ [0,50]Binary interaction parameters:
χ
hg = +0.02,χ
ho = 0,χ
go = 0,χ
hs = 0.01,χ
gs =−
0.01,χ
os =−
0.0252
1D vs. 2D or 3D models
In principle, the lattice model of PNC is 3D
In 1D simulations it is assumed that
properties of any lattice cell on a
X-Y plane are identical, varying only
with platelet separation in Z.
In 2D simulation it is assumed that
properties depends on X and Z.
In 3D simulation variation of properties in all three dimensions
is computed.
The computed differences between 1D, 2D and 3D originate
from the different probability for segment placement
(center-edge) hence the configurational entropy and enthalpy
(where pertinent).
x
z
o
Lattice
Clay
x
y
z
o
Lattice
Clay
-0.006 -0.004 -0.002 0 0 10 20 z=2 z=3 z=4 z=6 z=8 z=10 ∆ F M x 1D
Results for 1D & 2D
The 2D model assumes finite size of clay platelets in the x-direction, and
invariance in the y-direction; the variation with respect to the lateral dimension,
y, is averaged,
The Figure displays variation of the excess free energy with the number of cells in x-direction. The data are computed at different distance from the clay surface z = 2 to 10 for: Ng= 25, Nh= 100, ρg= 0.04, and χhg= 0
The 1D prediction is indicated by a horizontal red line.
The 1D model assumes presence of two parallel platelets immersed in a molten polymeric matrix.
In this model the platelets are infinitely large, thus only in the
vertical z-direction the properties may change.
The 1D data of Kim et al. (2004) reproduced results by Balazs et al. (1998).
54
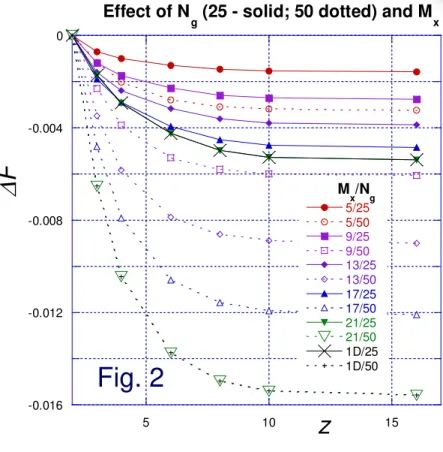
Results for 1D & 2D
Fig. 2 -0.016 -0.012 -0.008 -0.004 0 5 10 15 Effect of N
g (25 - solid; 50 dotted) and Mx
5/25 5/50 9/25 9/50 13/25 13/50 17/25 17/50 21/25 21/50 1D/25 1D/50 ∆ F z M x/Ng
Fig. 2 shows total
∆
F for number of cells M
x= 3 to 21 and for
the 1D case; the 1D results are recovered for M
x= 21.
-0.012 -0.008 -0.004 0
4 6 8 10
Contribution of the compatibilizer and host polymer to the free energy of mixing in 1 and in 2D models
11 co 11 ho 13co 13ho 15co 15ho 17co 17ho 19co 19ho 21co 21ho ∆ F z C o m p a tib iliz e r ( c o ) H o s t p o ly m er (h o) Fig. 1
Fig. 1 illustrates contributions originating from the end-terminated
compatibilizer (co), and that from the host polymer (ho).
Variation of
∆
F with z and M
xwere computed for: N
g= 25 or 50,
2D result for 4-components 1
x z0.0,
0.01,
0.01,
0.02
hg hs gs osχ
=
χ =
χ = −
χ = −
Influence of the binary interaction parameters on the
concentration profiles for:
A = 20(kBT),
N
h= 400, N
g= 200,
No = 100,56
The influence of the bare-solid
area-lattice ratio (
ε
) and grafting
density (
ρ
g,
ρ
o) on the excess free
energy (h= z → ∞).
Statistical chain length
Ng = 200, Nh = 400, No = 10
Surface properties
ρ
g ∈ [0, 0.2];ρ
o ∈ [0.5, 0.9]; andρ
v ∈ [0.02, 0.05]Influence of solid-solid
interactions
A = 20(kBT),ε
∈ [0, 20]Binary interaction parameters
χ
hg = 0,χ
ho = 0,χ
go = 0,χ
hs = 0.01,χ
gs =−
0.01,χ
os =−
0.02Effect of
intercalant degradation
on the concentration
profiles in 2D lattice with:
N
g= 200, N
h= 400, N
o= 100
,ρ
g = 15%,ρ
o = 80%,ρ
v = 2∼5%, A = 20(kBT),χ
hg = 0,χ
ho = 0,χ
go = 0,χ
hs = 0.01,χ
= −0.01,χ
= −0.02.Degradation (%)
γ
g= 0.0 %
γ
g= 100 %
x zDegradation effect 1
58
Statistical chain length
Ng = 200, Nh = 400, No = 10
Surface property
ρ
g = 0∼20%,ρ
o = 70%,ρ
v = 2∼5%Solid influence
A = 20(kBT),
ε
= 10,γ
o ∈[0.2,1.0]Binary Interaction parameter
χ
hg = 0,χ
ho = 0,χ
go = 0,χ
hs = 0.01,χ
gs =−
0.01,χ
os =−
0.02Degradation of intercalant can readily be compensated by incorporation of compatibilizer, capable of forming stable bonds with clay surface.
Grafting density of ca. 6% would compensate for the degradation.
Problem Suggested solution
The absence of specific interaction between host and grafted polymer
(χhg = 0)
Higher grafting density, and/or higher MW of compatibilizer and organic modifier
(ρo, ρg, No and Ng) Increased bare surface area
(unfavorable solid-solid interactions)
Higher favorable interactions between clay and compatibilizer or intercalant
(stronger negative values for χgsand χos) Thermal degradation of organic modifier
(increasing γo)
- Better attraction between compatibilizer and solid surface and bigger ρg
- Less unfavorable interaction between host polymer and solid
Unfavorable host polymer-solid interaction (χhs > 0)
Decrease ρv
as well as
saturate the clay surface with compatibilizer and organic modifier, both miscible with polymerSolutions of practical
problems
60
Summary of Part #3:
Mathematical modeling
To reduce surface energy crystalline solids adsorb molecules.
For optimum dispersion of solid there is MW-dependent grafting
density – above it the grafted particles aggregates (immiscibility).
The Kim et al. SCF model reproduces previous 1D results.
2D computations predict lower miscibility than 1D.
To achieve exfoliation in 4-component system:
Clay: Intercalated (φo ≈ 70-80 %), but with surface partially bare for interacting with a compatibilizer (functionalized polymer)
Stable intercalant – no thermal degradation or extraction by melt
Bare clay surface, caused by inadequate intercalation or degradation can be compensated by compatibilization
Compatibilizer (φg ≈ 6 vol%)
Strongly interacting with clay surface High molecular weight (N ≤ P)
With non-positive ∆F of mixing with host polymer
Global conclusions
The clay platelets have high surface energy that results in solidification
of molecules – the effect is felt up to 100 nm away from the surface.
In the pre-intercalated organoclay (with paraffin chain up to C
18) the
intercalant is mostly solidified (stretched chain length is ca. 2.22 nm),
and the system has reduced free volume.
Exfoliated platelets are large, anisometric and sluggish.
In the PP-based PNC, where the binary liquid-liquid type interactions
are neutral (
χ
ij= 0) the successful exfoliation depends on the
end-functionalized polymer, a compatibilizer:
The compatibilizer must strongly interact with clay, and have MW comparable to that of the host polymer.
For the compatibilizer to react with organoclay the intercalant grafting should be reduced.
The intercalant and compatibilizer bonding must be thermo-mechanically stable (within the range of compounding & processing conditions).