arXiv:hep-ex/0605011v1 4 May 2006
EUROPEAN ORGANISATION FOR NUCLEAR RESEARCH (CERN)
CERN-PH-EP/2006-004 25 April 2006 Journal Version
Measurement of the W boson Mass and Width
in e
+e
−Collisions at LEP
The ALEPH Collaboration
∗)Abstract
The mass of the W boson is determined from the direct reconstruction of W decays in WW → q¯qq¯q and WW → ℓνq¯q events in e+e−
collisions at LEP. The data sample corresponds to an integrated luminosity of 683 pb−1
collected with the ALEPH detector at centre-of-mass energies up to 209 GeV. To minimise any effect from colour reconnection a new procedure is adopted in which low energy particles are not considered in the mass determination from the q¯qq¯q channel. The combined result from all channels is
mW = 80.440 ± 0.043(stat.) ± 0.024(syst.) ± 0.009(FSI) ± 0.009(LEP) GeV/c2,
where FSI represents the possible effects of final state interactions in the q¯qq¯q channel and LEP indicates the uncertainty in the beam energy. From two-parameter fits to the W mass and width, the W width is found to be
ΓW = 2.14 ± 0.09(stat.) ± 0.04(syst.) ± 0.05(FSI) ± 0.01(LEP) GeV.
To be published in Eur. Phys. J. C
——————————————–
∗
The ALEPH Collaboration
S. Schael,
Physikalisches Institut das RWTH-Aachen, D-52056 Aachen, Germany
R. Barate, R. Bruneli`ere, I. De Bonis, D. Decamp, C. Goy, S. J´ez´equel, J.-P. Lees, F. Martin, E. Merle, M.-N. Minard, B. Pietrzyk, B. Trocm´e
Laboratoire de Physique des Particules (LAPP), IN2P3-CNRS, F-74019 Annecy-le-Vieux Cedex,
France
S. Bravo, M.P. Casado, M. Chmeissani, J.M. Crespo, E. Fernandez, M. Fernandez-Bosman, Ll. Garrido,15
M. Martinez, A. Pacheco, H. Ruiz
Institut de F´isica d’Altes Energies, Universitat Aut`onoma de Barcelona, E-08193 Bellaterra (Barcelona), Spain7
A. Colaleo, D. Creanza, N. De Filippis, M. de Palma, G. Iaselli, G. Maggi, M. Maggi, S. Nuzzo, A. Ranieri, G. Raso,24 F. Ruggieri, G. Selvaggi, L. Silvestris, P. Tempesta, A. Tricomi,3 G. Zito
Dipartimento di Fisica, INFN Sezione di Bari, I-70126 Bari, Italy
X. Huang, J. Lin, Q. Ouyang, T. Wang, Y. Xie, R. Xu, S. Xue, J. Zhang, L. Zhang, W. Zhao Institute of High Energy Physics, Academia Sinica, Beijing, The People’s Republic of China8
D. Abbaneo, T. Barklow,27O. Buchm¨uller,27M. Cattaneo, B. Clerbaux,23 H. Drevermann, R.W. Forty,
M. Frank, F. Gianotti, J.B. Hansen, J. Harvey, D.E. Hutchcroft,31, P. Janot, B. Jost, M. Kado,2P. Mato,
A. Moutoussi, F. Ranjard, L. Rolandi, D. Schlatter, F. Teubert, A. Valassi, I. Videau European Laboratory for Particle Physics (CERN), CH-1211 Geneva 23, Switzerland
F. Badaud, S. Dessagne, A. Falvard,20 D. Fayolle, P. Gay, J. Jousset, B. Michel, S. Monteil, D. Pallin,
J.M. Pascolo, P. Perret
Laboratoire de Physique Corpusculaire, Universit´e Blaise Pascal, IN2P3-CNRS, Clermont-Ferrand,
F-63177 Aubi`ere, France
J.D. Hansen, J.R. Hansen, P.H. Hansen, A.C. Kraan, B.S. Nilsson Niels Bohr Institute, 2100 Copenhagen, DK-Denmark9
A. Kyriakis, C. Markou, E. Simopoulou, A. Vayaki, K. Zachariadou Nuclear Research Center Demokritos (NRCD), GR-15310 Attiki, Greece A. Blondel,12 J.-C. Brient, F. Machefert, A. Roug´e, H. Videau
Laoratoire Leprince-Ringuet, Ecole Polytechnique, IN2P3-CNRS, F-91128 Palaiseau Cedex, France
V. Ciulli, E. Focardi, G. Parrini
Dipartimento di Fisica, Universit`a di Firenze, INFN Sezione di Firenze, I-50125 Firenze, Italy
A. Antonelli, M. Antonelli, G. Bencivenni, F. Bossi, G. Capon, F. Cerutti, V. Chiarella, P. Laurelli, G. Mannocchi,5 G.P. Murtas, L. Passalacqua
Laboratori Nazionali dell’INFN (LNF-INFN), I-00044 Frascati, Italy J. Kennedy, J.G. Lynch, P. Negus, V. O’Shea, A.S. Thompson
Department of Physics and Astronomy, University of Glasgow, Glasgow G12 8QQ,United Kingdom10
S. Wasserbaech
Utah Valley State College, Orem, UT 84058, U.S.A.
R. Cavanaugh,4S. Dhamotharan,21C. Geweniger, P. Hanke, V. Hepp, E.E. Kluge, A. Putzer, H. Stenzel,
K. Tittel, M. Wunsch19
R. Beuselinck, W. Cameron, G. Davies, P.J. Dornan, M. Girone,1N. Marinelli, J. Nowell, S.A. Rutherford,
J.K. Sedgbeer, J.C. Thompson,14 R. White
Department of Physics, Imperial College, London SW7 2BZ, United Kingdom10
V.M. Ghete, P. Girtler, E. Kneringer, D. Kuhn, G. Rudolph
Institut f¨ur Experimentalphysik, Universit¨at Innsbruck, A-6020 Innsbruck, Austria18
E. Bouhova-Thacker, C.K. Bowdery, D.P. Clarke, G. Ellis, A.J. Finch, F. Foster, G. Hughes, R.W.L. Jones, M.R. Pearson, N.A. Robertson, T. Sloan, M. Smizanska
Department of Physics, University of Lancaster, Lancaster LA1 4YB, United Kingdom10
O. van der Aa, C. Delaere,29G.Leibenguth,32 V. Lemaitre30
Institut de Physique Nucl´eaire, D´epartement de Physique, Universit´e Catholique de Louvain, 1348 Louvain-la-Neuve, Belgium
U. Blumenschein, F. H¨olldorfer, K. Jakobs, F. Kayser, A.-S. M¨uller, B. Renk, H.-G. Sander, S. Schmeling, H. Wachsmuth, C. Zeitnitz, T. Ziegler
Institut f¨ur Physik, Universit¨at Mainz, D-55099 Mainz, Germany16
A. Bonissent, P. Coyle, C. Curtil, A. Ealet, D. Fouchez, P. Payre, A. Tilquin
Centre de Physique des Particules de Marseille, Univ M´editerran´ee, IN2P3-CNRS, F-13288 Marseille,
France F. Ragusa
Dipartimento di Fisica, Universit`a di Milano e INFN Sezione di Milano, I-20133 Milano, Italy.
A. David, H. Dietl,33 G. Ganis,28 K. H¨uttmann, G. L¨utjens, W. M¨anner33, H.-G. Moser, R. Settles,
M. Villegas, G. Wolf
Max-Planck-Institut f¨ur Physik, Werner-Heisenberg-Institut, D-80805 M¨unchen, Germany16
J. Boucrot, O. Callot, M. Davier, L. Duflot, J.-F. Grivaz, Ph. Heusse, A. Jacholkowska,6 L. Serin,
J.-J. Veillet
Laboratoire de l’Acc´el´erateur Lin´eaire, Universit´e de Paris-Sud, IN2P3-CNRS, F-91898 Orsay Cedex,
France
P. Azzurri, G. Bagliesi, T. Boccali, L. Fo`a, A. Giammanco, A. Giassi, F. Ligabue, A. Messineo, F. Palla, G. Sanguinetti, A. Sciab`a, G. Sguazzoni, P. Spagnolo, R. Tenchini, A. Venturi, P.G. Verdini
Dipartimento di Fisica dell’Universit`a, INFN Sezione di Pisa, e Scuola Normale Superiore, I-56010 Pisa, Italy
O. Awunor, G.A. Blair, G. Cowan, A. Garcia-Bellido, M.G. Green, T. Medcalf,25A. Misiejuk, J.A. Strong,
P. Teixeira-Dias
Department of Physics, Royal Holloway & Bedford New College, University of London, Egham, Surrey TW20 OEX, United Kingdom10
R.W. Clifft, T.R. Edgecock, P.R. Norton, I.R. Tomalin, J.J. Ward
Particle Physics Dept., Rutherford Appleton Laboratory, Chilton, Didcot, Oxon OX11 OQX, United Kingdom10
B. Bloch-Devaux, D. Boumediene, P. Colas, B. Fabbro, E. Lan¸con, M.-C. Lemaire, E. Locci, P. Perez, J. Rander, A. Trabelsi,25 B. Tuchming, B. Vallage
CEA, DAPNIA/Service de Physique des Particules, CE-Saclay, F-91191 Gif-sur-Yvette Cedex, France17
A.M. Litke, G. Taylor
Institute for Particle Physics, University of California at Santa Cruz, Santa Cruz, CA 95064, USA22
C.N. Booth, S. Cartwright, F. Combley,26 P.N. Hodgson, M. Lehto, L.F. Thompson
Department of Physics, University of Sheffield, Sheffield S3 7RH, United Kingdom10
A. B¨ohrer, S. Brandt, C. Grupen, J. Hess, A. Ngac, G. Prange Fachbereich Physik, Universit¨at Siegen, D-57068 Siegen, Germany16
C. Borean, G. Giannini
Dipartimento di Fisica, Universit`a di Trieste e INFN Sezione di Trieste, I-34127 Trieste, Italy H. He, J. Putz, J. Rothberg
Experimental Elementary Particle Physics, University of Washington, Seattle, WA 98195 U.S.A. S.R. Armstrong, K. Berkelman, K. Cranmer, D.P.S. Ferguson, Y. Gao,13 S. Gonz´alez, O.J. Hayes,
H. Hu, S. Jin, J. Kile, P.A. McNamara III, J. Nielsen, Y.B. Pan, J.H. von Wimmersperg-Toeller, W. Wiedenmann, J. Wu, Sau Lan Wu, X. Wu, G. Zobernig
Department of Physics, University of Wisconsin, Madison, WI 53706, USA11
G. Dissertori
Institute for Particle Physics, ETH H¨onggerberg, 8093 Z¨urich, Switzerland.
1Also at CERN, 1211 Geneva 23, Switzerland.
2Now at Fermilab, PO Box 500, MS 352, Batavia, IL 60510, USA
3Also at Dipartimento di Fisica di Catania and INFN Sezione di Catania, 95129 Catania, Italy. 4Now at University of Florida, Department of Physics, Gainesville, Florida 32611-8440, USA 5Also IFSI sezione di Torino, INAF, Italy.
6Also at Groupe d’Astroparticules de Montpellier, Universit´e de Montpellier II, 34095, Montpellier,
France.
7Supported by CICYT, Spain.
8Supported by the National Science Foundation of China. 9Supported by the Danish Natural Science Research Council.
10Supported by the UK Particle Physics and Astronomy Research Council. 11Supported by the US Department of Energy, grant DE-FG0295-ER40896.
12Now at Departement de Physique Corpusculaire, Universit´e de Gen`eve, 1211 Gen`eve 4, Switzerland. 13Also at Department of Physics, Tsinghua University, Beijing, The People’s Republic of China. 14Supported by the Leverhulme Trust.
15Permanent address: Universitat de Barcelona, 08208 Barcelona, Spain. 16Supported by Bundesministerium f¨ur Bildung und Forschung, Germany. 17Supported by the Direction des Sciences de la Mati`ere, C.E.A.
18Supported by the Austrian Ministry for Science and Transport. 19Now at SAP AG, 69185 Walldorf, Germany
20Now at Groupe d’ Astroparticules de Montpellier, Universit´e de Montpellier II, 34095 Montpellier,
France.
21Now at BNP Paribas, 60325 Frankfurt am Mainz, Germany
22Supported by the US Department of Energy, grant DE-FG03-92ER40689.
23Now at Institut Inter-universitaire des hautes Energies (IIHE), CP 230, Universit´e Libre de Bruxelles,
1050 Bruxelles, Belgique
24Now at Dipartimento di Fisica e Tecnologie Relative, Universit`a di Palermo, Palermo, Italy. 25Now at Facult des Sciences de Tunis, 2092, Campus Universitaire, Tunisia.
26Deceased.
27Now at SLAC, Stanford, CA 94309, U.S.A 28Now at CERN, 1211 Geneva 23, Switzerland 29Research Fellow of the Belgium FNRS 30Research Associate of the Belgium FNRS
31Now at Liverpool University, Liverpool L69 7ZE, United Kingdom
32Supported by the Federal Office for Scientific, Technical and Cultural Affairs through the
1
Introduction
The electroweak Standard Model (SM) successfully describes all interactions of quarks and leptons at the Z resonance provided that quantum radiative corrections are included [1]. In this model, the mass of the W boson (mW) can be calculated as follows:
mW2(1 − mW2 mZ2 ) = √πα 2Gµ (1 + ∆r)
where mZ (Z mass), Gµ (Fermi coupling constant) and α (fine structure constant) are
measured with high precision. In this equation, ∆r parametrises the loop corrections which lead to a quadratic dependence on the top quark mass, (mtop), and a weaker
logarithmic dependence on the Higgs boson mass. A global fit of electroweak observables measured at the Z resonance together with the measured mtop [2] yields a W mass of
80.373 ± 0.023 GeV/c2 [1] in the SM.
The comparison of a direct measurement of mW with this prediction was a primary
goal of LEP, enabling a stringent test of the Standard Model to be made. This paper describes the final measurement of the W mass and width (ΓW) from ALEPH. They are
determined from the direct reconstruction of the invariant mass of its decay products in both the WW → q¯qq¯q hadronic and WW → ℓ(ℓ = e, µ, τ)νq¯q semileptonic channels. Measurements were published previously using the data collected at centre-of-mass (CM) energies of 172, 183 and 189 GeV [3, 4, 5]. The most recent ALEPH publication included a weighted average result obtained from the combination of all these measurements as well as those obtained earlier from the total W pair cross sections at 161 and 172 GeV [6, 7]. The statistical precision for the mass was 61 MeV/c2 with a systematic uncertainty of 47
MeV/c2. In the last two years up to the closure of LEP in 2000, more data were collected
at CM energies up to 209 GeV increasing the total sample by a factor of three.
All these data, except for the small sample at 172 GeV, are included in the analysis corresponding to an integrated luminosity of 683 pb−1. The data were sub-divided into eight samples labelled as 183, 189, 192, 196, 200, 202, 205 and 207 GeV according to their CM energies. This sub-division is the same as that used in the measurement of the WW cross section [8].
A constrained kinematic fit conserving energy and momentum is applied to each selected event in data and Monte Carlo (MC) simulation. As in previous analyses, the simulated mass spectra are fitted to the data using a reweighting technique to extract the W mass and width. Very large MC productions (> 106 signal events per CM energy)
enable multi-dimensional fits to be used with significant gains in precision. The signal events are weighted to account for the effect of O(α) corrections [9] in mW and ΓW.
Since the statistical error on mW is now comparable with the previously published
systematic uncertainties, a more detailed evaluation of all important uncertainties has been performed. In the previous analysis [5], the dominant systematic uncertainty in the q¯qq¯q channel was due to colour reconnection (CR). This affects the topological distribution of lower energy particles in an event. Two new analysis procedures have been adopted. In one of these, PCUT, low energy particles are not considered in the reconstruction of jets, whilst in the other, CONE, only particles close to the jet axes are used. These significantly reduce the difficult-to-estimate CR uncertainty at the expense of some statistical power in this channel. The effect of these modified reconstructions
has been checked using di-jets in the ℓνq¯q channels, where no final state interactions are present between the W’s.
The paper is organised as follows. In Section 2, the important properties of the ALEPH detector are described. In Section 3, the event reconstruction procedures and calibrations are recalled and detailed studies of the detector simulation reported. Section 4 contains a full description of the event samples generated for the signal and background processes involved. Section 5 describes the event selection and kinematic reconstruction procedures in the different channels highlighting, where appropriate, the modifications and improvements applied since the earlier analyses at 183 and 189 GeV [4, 5]. Section 6 describes the extraction of mW and ΓW. Section 7 describes the specific studies made to
set a limit on colour reconnection from the data using event reconstructions where low momentum particles or particles between jets are excluded. Section 8 describes all studies of systematic uncertainties. The analysis of radiative returns to the Z peak is reported in Section 9, providing a cross check on the W mass measurement. The measurements in all channels are combined in Section 10, taking into account common sources of systematic uncertainties. The W masses measured in the purely hadronic and combined semileptonic channels are compared in this section. Final conclusions are given in Section 11.
2
The ALEPH detector
A detailed description of the ALEPH detector can be found in Ref. [10] and of its performance in Ref. [11]. The tracking detectors include a silicon vertex detector (VDET), a cylindrical drift chamber and a large time projection chamber (TPC) which measures up to 31 coordinates along the charged particle trajectories. A 1.5 T axial magnetic field, provided by a superconducting solenoidal coil, yields a resolution of δpT/pT = 6 × 10
−4
pT ⊕ 0.005 (pT in GeV/c). Charged particle tracks reconstructed
with at least four hits in the TPC and originating from within a cylinder of 2 cm radius and 20 cm length, centred on the nominal interaction point and parallel to the beam axis, are called good tracks. In addition to its rˆole as a tracking device, the TPC also measures the specific energy loss by ionisation dE/dx.
Electrons and photons are identified in the electromagnetic calorimeter (ECAL) by their characteristic longitudinal and transverse shower development. The calorimeter is a lead/wire-plane sampling detector with fine readout segmentation. Each tower element is projective, subtending an angle of ∼ 1◦
in both θ and φ, and segmented longitudinally into three stacks. It provides a relative energy resolution of 0.180/√E + 0.009 (E in GeV) for isolated electrons and photons. The three-dimensional fine segmentation allows a good spatial resolution to be achieved for photons and π0’s in jets. Such deposits are
separately identified and their energies evaluated by a fine clustering algorithm [11]. Muons are identified by their penetration pattern in the hadron calorimeter (HCAL), a 1.2 m thick iron yoke instrumented with 23 layers of streamer tubes, together with two surrounding double layers of muon chambers. The hadron calorimeter also provides a measurement of the energies of charged and neutral hadrons with a relative resolution of 0.85/√E (E in GeV). At low polar angles, electromagnetic energy deposits are detected in the luminosity calorimeters (LCAL and SiCAL [11]) down to 34 mrad with respect to the beam axis.
3
Event Reconstruction
3.1
Simulation of electromagnetic deposits
Aiming for a precise measurement of mWto 1 part in 2000 imposes a level of understanding
of this detector and its simulation not required in previous analyses of ALEPH data. The fine granularity and longitudinal segmentation of the ECAL detector elements [10] allow nearby energy deposits to be identified. The treatment of these deposits has been revised following a detailed simulation.
The normal simulation of the lateral and longitudinal development of electromagnetic energy deposits in the ECAL tower elements is based upon a parametrisation of showers measured in a test beam. This parametrisation was employed in the generation of all reference events used in the analysis (∼ 108 events). It provides a good description
of the individual shower cores but fails to simulate the correlated fluctuations in their development through the sampling layers of ECAL, which can lead to the production of objects separate from the main deposit, called satellites. Mostly below 1 GeV and confined to one stack, the observed rate of such objects significantly exceeds expectation. To understand the origin of this discrepancy, a more complete simulation (FULLSIM) of the response of ECAL to electromagnetic showers was developed using GEANT3 [12]. The effect of correlated fluctuations is included. As expected, there is better agreement in the reproduction of low energy satellites. However, since FULLSIM was restricted to an average medium for the ECAL sampling layers, it does not describe the lateral shower shape as well as the parametrisation. Consequently, its use was confined to the study of calorimeter systematic effects for which samples of ∼ 106 events were generated.
Specific studies with 45 GeV Bhabha electrons show an excess in the data of objects formed entirely from connected elements from within the same stack. Similar effects are seen in the close neighbourhood of particles in jets. Not identified as electromagnetic, all single stack objects are removed from both data and simulated events unless related to a good track or a HCAL energy deposit. After this ECAL ‘cleaning’ process, the multiplicity of single stack objects in ECAL matches the prediction from FULLSIM. The multiplicity of identified photons is unaffected by this procedure. The ECAL cleaning removes ∼3% from the total energy of a hadronic jet both in the data and FULLSIM.
3.2
Energy flow
The total visible energy and momentum per event and thus the missing energy and momentum, are evaluated by an energy flow reconstruction algorithm [11] which combines all measurements from calorimeters and tracking devices. The algorithm also provides a list of charged and neutral reconstructed particles, called energy flow objects, from which jets are reconstructed. The momentum of a jet is defined as the sum of the four-momenta of all particles in the jet, assuming the pion mass for all charged hadrons. The typical jet angular resolution is 30 mrad in space. The jet energy resolution is approximately σEjet = (0.6
q
Ejet+ 0.6) GeV where Ejet (in GeV) is the jet energy.
In order to bring better agreement between data and simulation, all energy flow objects in data and simulated events found to subtend angles less than 15◦
to the beams are rejected. All photonic and hadronic objects identified only in the ECAL are rejected if their energies are less than 1.5 GeV. Hadronic objects identified in the third stack of the
ECAL combined spatially with an HCAL deposit are rejected if their energies are less than 2 GeV. Objects with energies below these thresholds are not perfectly described by the simulation of the detectors.
3.3
Calibrations
Large samples of Z decays were collected at 91.2 GeV CM energy at the start and end of LEP2 running each year. Di-lepton and di-jet events were used to monitor the performance of the detector and to compare reconstructed particle and jet four-momenta with the predictions of the simulation. The following subsections describe the corrections applied where significant discrepancies between data and simulation were found.
3.3.1 Charged particles
For charged particles, small sagitta corrections are applied in data as determined using di-muons. They are proportional to momentum and opposite in sign for positively and negatively charged particles reaching a relative difference of 2% for 45.6 GeV/c tracks at the smallest polar angles.
3.3.2 Momentum of isolated leptons in e,µνq¯q events
Electron candidates from semileptonic W decays are corrected for energy losses due to bremsstrahlung in the detector material by combining their four-momenta with those of any detected photons that are consistent with this hypothesis. These photons can appear either as an excess of energy in the ECAL electron cluster or as a separate deposit topologically consistent with bremsstrahlung. This correction is not applied when the electron is accompanied by other charged particles with summed momenta greater than 5 GeV/c within 6◦
of the electron track. In addition, for muon and electron candidates, a search is made for isolated final state (FSR) photons associated with the lepton. Such a photon must be closer to the good lepton track than to any other object or the beam axis and at least 40◦
away from any other good track. Their four-momenta are then combined. In addition to the treatment of sagitta distortion described in subsection 3.3.1, the simulation of electrons from Bhabha events at 91.2, 130-136 and 183-209 GeV was compared with data. Small systematic biases as a function of polar angle θ and electron energy Ee were found arising from an imperfect simulation of saturation and leakage
effects in ECAL. The main effect is a global relative shift of 0.45% parametrised as ∆Ee/Ee(%) = 0.45(0.04) − 4(8) · 10
−4
[Ee − 45.6 GeV] (errors in brackets). This is
applied as a correction to the simulated electrons to match the data. A similar study for muons yields a small miscalibration of the momentum at 45 GeV (0.08±0.03%) with no significant dependence on momentum or polar angle. In this case, no corrections are applied.
3.3.3 Identified photons
Using the energy flow algorithm, photons are identified in ECAL both in isolation and from within clusters of overlapping objects. Any bias in the photon energies from the simulated events relative to data was investigated by comparing π0 mass distributions
events were compared event-by-event with the corresponding kinematically reconstructed values. Small biases are corrected to match the data, parametrised separately for the barrel, endcaps and the ‘overlap’ region in between.
3.3.4 Jets
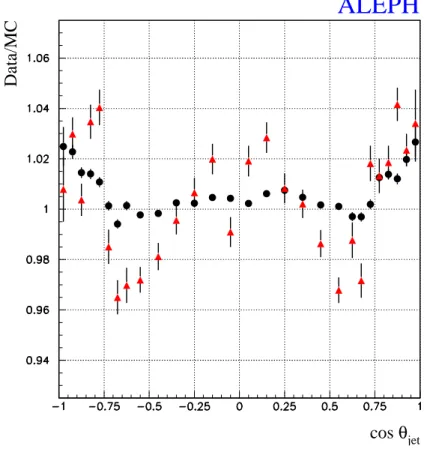
Following these corrections to the charged hadrons and photons within jets, simulated hadronic events at the Z with energies of 45 GeV were compared with the data. The hadrons are clustered into two jets using the DURHAM-PE algorithm [13]. Only q¯q events with thrust values in the range 0.8 to 0.9925 are used, to suppress three-jet configurations and tau pairs. Using all Z calibration data collected during the LEP2 data taking periods, a statistical precision of about 0.2% on jet energies is obtained. Figure 1 shows the ratio of jet energies in data to simulation, determined from the mean values in each bin, as a function of jet polar angle cos θjet. The relative biases in the barrel region do not exceed
0.5% and reach a maximum of 2.5% for | cos θjet| > 0.95. The Monte Carlo reconstructed
jet energies are corrected bin-by-bin for these biases as a function of cos θjet before event
kinematic fits are applied. Figure 1 also shows the relative jet energy resolutions as determined from the RMS values of the distributions in each cos θjet bin. The simulation
agrees with the data to within 1% for the barrel and 4% for the endcaps; no correction is applied.
ALEPH
cos θjet
Data/MC
Figure 1: The ratios of jet energies (circles) and resolutions (triangles) at the Z peak between data taken at the Z and corresponding simulation as a function of cos θjet.
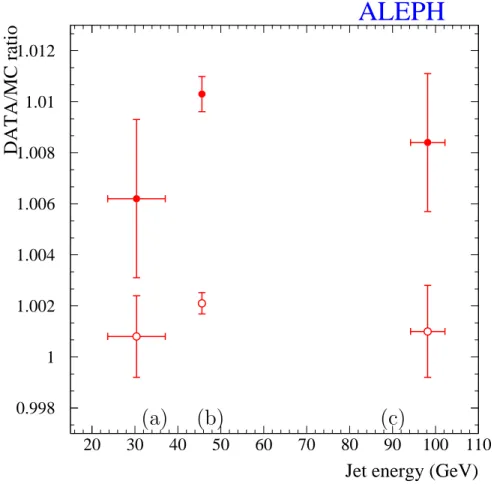
GeV by comparing di-jet event samples from data and simulation at CM energies from 130 to 209 GeV. Below 45 GeV, a large sample of jets with energies centred at 30±7 GeV were obtained from three-jet events at the Z peak. In this way, the full range of jet energies from WW decays is covered. Figure 2 shows the average ratios of measured jet energies in data to simulation for the barrel and endcap regions separately for three values of jet energies from 30 to 98 GeV. No significant deviations are observed from the ratios found for 45 GeV jets.
Jet energy (GeV)
DATA/MC ratio
ALEPH
0.998 1 1.002 1.004 1.006 1.008 1.01 1.012 20 30 40 50 60 70 80 90 100 110Figure 2: Data/MC ratio of average Ejet/Ebeam for Ejet energies of (a) 3-jet events at the Z, (b)
di-jet events at the Z and (c) high energy di-jet events. Closed points: | cos θjet| > 0.7, open points:
| cos θjet| < 0.7.
(a)
(b)
(c)
4
Simulation of Physics Processes
The KORALW event generator, version 1.51 [14], is used to produce W pair events. These events are weighted by the O(α) correction to the doubly resonant W-pair process using the YFSWW3 program version 1.16 [9]. Within KORALW all four-fermion (4f) diagrams producing WW-like final states are computed, including Cabbibo suppressed decay modes, using the fixed-width scheme for W and Z propagators. The JETSET 7.4 [15] or PYTHIA 6.1 [16] packages are used for the hadronisation of quarks in the final states. Their
parameters are tuned at the Z from a selection of q¯q events with anti-b tagging. Colour reconnection and Bose-Einstein final state interactions are not included. A sample of 106
4f events was generated with KORALW at each of eight CM energies ranging from 182.7 to 206.5 GeV [8]. The W mass was set to 80.35 GeV/c2 and the width taken from Standard
Model (SM) predictions to be 2.094 GeV. These samples are used as reference samples for fitting to the data in the reweighting procedure (Sec. 6), as well as for the study of detector systematic errors. Additional samples of 200k events were generated with W masses up to 0.5 GeV/c2 and W widths up to 0.6 GeV different from the reference
sample, for checking the stability of the results. Also, an independent sample of 500k W pair events was generated at each CM energy with KORALW restricted to the doubly resonant CC03 diagrams [8]. This sample is used to train neural networks and parametrise the corrections used in the kinematic fitting.
For studies of the systematic errors from fragmentation in W decays, 106 W pair
events generated with KORALW were hadronised using JETSET, HERWIG 6.2 [17] and ARIADNE 4.10[18] and processed through the detector simulation. To suppress statistical fluctuations in the comparison between these models, the same events at the parton level were used. Similarly, simulated samples of 100k to 500k events, generated with KORALW, were hadronised with modified versions of JETSET [19, 20], HERWIG and ARIADNE [21] containing various implementations of colour reconnection, to assess the influence of final state interactions between W decay products on the mass and width. The KORALW events were also hadronised with a version of JETSET that includes Bose Einstein correlations [22, 23], to determine their influence on the W mass and width measurements. Simulated samples of events of at least hundred times the data luminosity were generated for all background processes at each CM energy. The e+e−
→ q¯q(γ) events were generated with KK version 4.14 [24] with hadronisation performed by PYTHIA and including final state photon radiation (FSR) in the parton shower step. Interference between initial and final state was not taken into account. Events from ZZ-like final states were generated using PYTHIA (NC08 diagrams), but particular care was taken to avoid double counting of ZZ events already included in the signal generation as WW-like events (i.e. u¯ud¯d, µ+µ−
ν ¯ν,..). The same applies to Zee final states, generated with a 12 GeV/c2 minimum mass for the Z system, for what concerns double counting of e+e−
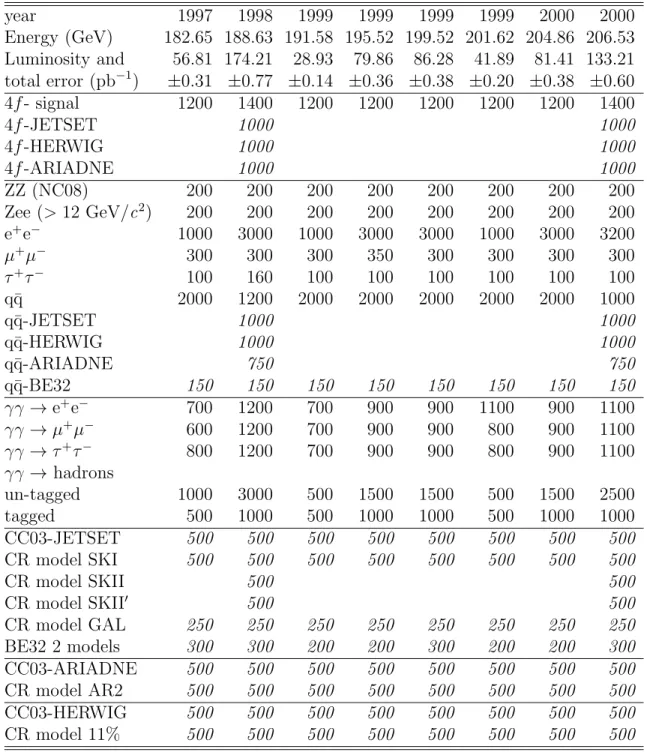
ν ¯ν events. Two-photon (γγ) reactions into leptons and hadrons were simulated with the PHOT02 [25], PYTHIA and HERWIG generators but no events survived the selection cuts in the q¯qq¯q and ℓνq¯q channels. Di-lepton final states were simulated using KK for τ τ (γ) and µµ(γ) and BHWIDE 1.01 [26] for ee(γ) events. Table 1 lists the number of simulated events passed through GEANT, generated for each process at each CM energy with corresponding integrated luminosities for the data.
5
Event selections and kinematic reconstruction
In the following subsections, the event selections and kinematic reconstruction procedures for the mass extraction are described for the following four classes of WW events q¯qq¯q, eνq¯q, µνq¯q and τ νq¯q. The selections are those required for the WW cross section measurement [8]. For the q¯qq¯q, eνq¯q, and µνq¯q channels, the cuts developed earlier at 189 GeV [5] for the leptons and jets are used followed by re-optimised neural networks for the higher CM energies. A new selection has been developed for the τ νq¯q channel.
Table 1: Overview of the numbers of simulated events generated (in units of 1000 events) for each process type at eight average centre-of-mass energies and corresponding data integrated luminosities. Events generated from the same 4f (2f) samples are shown in italics.
year 1997 1998 1999 1999 1999 1999 2000 2000 Energy (GeV) 182.65 188.63 191.58 195.52 199.52 201.62 204.86 206.53 Luminosity and 56.81 174.21 28.93 79.86 86.28 41.89 81.41 133.21 total error (pb−1) ±0.31 ±0.77 ±0.14 ±0.36 ±0.38 ±0.20 ±0.38 ±0.60 4f - signal 1200 1400 1200 1200 1200 1200 1200 1400 4f -JETSET 1000 1000 4f -HERWIG 1000 1000 4f -ARIADNE 1000 1000 ZZ (NC08) 200 200 200 200 200 200 200 200 Zee (> 12 GeV/c2) 200 200 200 200 200 200 200 200 e+e− 1000 3000 1000 3000 3000 1000 3000 3200 µ+µ− 300 300 300 350 300 300 300 300 τ+τ− 100 160 100 100 100 100 100 100 q¯q 2000 1200 2000 2000 2000 2000 2000 1000 q¯q-JETSET 1000 1000 q¯q-HERWIG 1000 1000 q¯q-ARIADNE 750 750 q¯q-BE32 150 150 150 150 150 150 150 150 γγ → e+e− 700 1200 700 900 900 1100 900 1100 γγ → µ+µ− 600 1200 700 900 900 800 900 1100 γγ → τ+τ− 800 1200 700 900 900 800 900 1100 γγ → hadrons un-tagged 1000 3000 500 1500 1500 500 1500 2500 tagged 500 1000 500 1000 1000 500 1000 1000 CC03-JETSET 500 500 500 500 500 500 500 500 CR model SKI 500 500 500 500 500 500 500 500 CR model SKII 500 500 CR model SKII′ 500 500 CR model GAL 250 250 250 250 250 250 250 250 BE32 2 models 300 300 200 200 300 200 200 300 CC03-ARIADNE 500 500 500 500 500 500 500 500 CR model AR2 500 500 500 500 500 500 500 500 CC03-HERWIG 500 500 500 500 500 500 500 500 CR model 11% 500 500 500 500 500 500 500 500
All selections are mutually exclusive.
5.1
WW → q¯
qq¯
q selection
A first preselection step aims at removing events with an energetic undetected initial state radiation (ISR) photon from radiative returns to the Z by requiring that the absolute value
of the total longitudinal momentum be less than 1.5(Mvis−MZ) where Mvis is the observed
visible mass. All accepted particles are then forced to form four jets using the DURHAM-PE algorithm [13]. Only events where the jet resolution parameter, y34, is larger than 0.001
are kept. To reject q¯q events with a visible ISR photon, none of the four jets can have more than 95% of electromagnetic energy in a 1◦
cone around any particle included in the jet. Four-fermion final states in which one of the fermions is a charged lepton are rejected by requiring that the leading charged particle of each jet carries less than 90% of the jet energy.
The same neural network (NN) as in Ref. [8], trained at five CM energies (189, 196, 200, 205 and 207 GeV) on Monte Carlo CC03 and background events, is used to tag the preselected events. There are 14 input variables based on global event properties, heavy quark flavour tagging, reconstructed jet properties and WW kinematics. The signal is well separated from the q¯q(γ) background with 90% efficiency and 80% purity by requiring a NN output in excess of 0.3 [8].
According to the simulation, a significant fraction (∼6%) of the accepted events are accompanied by an ISR photon that can be detected in the calorimeters separately from the hadronic jets. Such photons can be removed from the jet clustering process, thus improving the invariant mass resolution for W pairs. Studies at 189 GeV show that such photons with energies above 3 GeV are identified in SiCAL or LCAL and above 5 GeV in ECAL with an overall efficiency of 63% and purity of 72% if an isolation criterion based on a minimum angular separation from the closest energy flow object is applied. The minimum separation applied is 8◦
in SiCAL or LCAL and 18◦
in ECAL for all CM energies. These events are treated differently in the subsequent kinematic fit.
5.2
WW →
ℓνq¯
q selection
A preselection common to the three lepton topologies requires at least seven tracks in the event. Background from q¯q events is reduced by requiring the estimated sum of missing energy and missing momentum to be greater than 35 GeV. The Zγ events in which the photon is undetected are rejected by requiring the missing longitudinal momentum to be smaller than Max((s − M2 Z)/2 √ s − 27.5 GeV, (√s − M2 Z/ √ s −q6E2 − 6pT2− 6 GeV)
where 6pT is the transverse missing momentum and 6E is the missing energy.
Following the identification of the lepton and associated objects, the remaining particles are clustered into two jets using the DURHAM-PE algorithm as in the q¯qq¯q channel. 5.2.1 eνq¯q and µνq¯q selection
In addition to the common preselection, a tighter cut is used on the total visible energy and visible longitudinal momentum to further reject Zγ events:
Evis
(s − M2
Z)/(s + MZ2) − Pzvis > 5 GeV
where Evis and Pvis
z are the visible energy and longitudinal momentum, respectively.
The lepton candidate is chosen as the good track with the largest P sin (θlj/2) where
from the remaining tracks using the DURHAM-PE algorithm (ycut = 0.0003). Events are
further considered if this lepton candidate satisfies the electron or muon criteria defined in Ref. [8] and if the sum of the lepton and missing energies is greater than 30 GeV.
Two different NN’s have been trained to select and classify eνq¯q and µνq¯q signal events [8]. Both use three discriminant variables, the event transverse momentum, the lepton energy and the lepton isolation. The event is classified as eνq¯q or µνq¯q if the corresponding NN output value is larger than 0.6 [8]. The efficiency and purity of the eνq¯q selection are 82% and 93% respectively. The corresponding values for the µνq¯q channel are 89% and 98%.
Detailed studies of neutral objects not already classified as bremsstrahlung within 2.5◦
of the electron track impact point on ECAL show a higher multiplicity than expected even after the removal of single stack objects (Sec. 3.1). The reference simulation fails to reproduce the data for angles up to 8◦
. Further studies show that a smaller but still significant excess of charged objects are present in the data for both eνq¯q and µνq¯q events. Although the summed energy of these objects near the isolated lepton is small, their impact on the closest jet is significant, especially for the eνq¯q channel. Therefore, all these objects up to 8◦
from the lepton are removed from the jet reconstruction. Also, they are not included in the calculation of the lepton four-momentum.
5.2.2 τ νq¯q selection
A new selection has been designed [8], based on an improved tau reconstruction [27]. Leptonic tau decays are searched for by examining those events with e or µ candidates which fail the eνq¯q or µνq¯q selection. These events are subjected to a similar three variable NN but trained on leptonic tau decays. Events with the NN output greater than 0.4 are kept [8].
After removing the events which have satisfied any of the three variable NN selections for eνq¯q, µνq¯q or τ νq¯q, the remaining events are further examined for additional τ νq¯q final states. Use is made of the fact that one-prong tau decays are characterised by a low visible mass with a mean about 0.75 GeV/c2. The first step is to perform a jet clustering
using the JADE algorithm [28] with a low ycut = (0.75/Evis)2 (Evis in GeV). The tau
candidate is defined as the jet which maximises pj (1 − cos θj), where θj is the smallest
angle with respect to other jets and pj is the jet momentum. The event is then subjected
to additional cuts, in particular the invariant mass of the hadronic recoil system to the tau candidate must be in the range 60 to 105 GeV/c2. For those events which fail, the
procedure is repeated with increasingly higher values of ycut. When this exceeds (5.0/Evis)2
the iterations are stopped and the event is kept requiring only that the recoiling invariant mass is larger than 20 GeV/c2 [8].
If a τ -jet candidate is found, the event is subjected to further cuts to remove the main backgrounds. Most of the γγ interactions are rejected by requiring the visible mass of the event to be larger than 50 GeV/c2 and the missing transverse momentum greater
than 10 GeV/c. The event is divided into two hemispheres with respect to a plane perpendicular to the thrust axis. The acollinearity angle between the two hemispheres is required to be less than 175◦
to reject most of the q¯q background. About 80% of the events with a tau candidate satisfy these cuts but significant background remains, mainly from q¯q events. These events are then subjected to a 15 variable neural network. The event is selected if the result is greater than 0.4. The efficiency and purity of the τ νq¯q
selection are 65% and 86% respectively [8].
5.3
Kinematic fit
The biases and resolutions used in the kinematic fits for the jet energies and directions are determined from an independent CC03 simulated sample. The distributions of the differences between the reconstructed jet energies and angles and those of the jets built directly from the generated particles are binned in jet energy and polar angle. Each of these distributions is fitted to a Gaussian and the mean values and sigmas are fed to the fitting algorithms.
Except for the τ νq¯q channel, W pair events are treated as four body final states with either four jets or two jets, a charged lepton and neutrino to which the measured missing momentum is assigned. For each selected event, two invariant masses are computed from the W decay products. In order to improve resolution, kinematic fits are made with the constraint of event four momentum conservation and fixing the velocities (p/E) of the jets to their measured values. Imposing energy and momentum conservation alone corresponds to a four-constraint (4C) fit in the case of fully hadronic events, and a one-constraint (1C) fit in the case of semileptonic events, giving two different fitted masses per event. An equal mass constraint for the two bosons corresponds, respectively, to a five (5C) or two-constraint (2C) fit. In the τ νq¯q channel, since the tau energy is largely unknown due to neutrinos in the tau decay, only the hadronic side of the event is used with the sole constraint of the beam energy.
The average raw resolution of 12% on the total jet momentum improves by a factor 2 and by a factor up to 5 for polar angles down to 20 degrees, due largely to the kinematic fitting.
For all classes of events the fits converge successfully producing flat χ2 probability
distributions for P (χ2) > 0.05. The peak below P (χ2) = 0.05 is populated by events that
do not fully satisfy the fitting hypothesis. Monte Carlo studies show that approximately half of these events have ISR energies greater than 0.5 GeV, leading to a significant positive bias in the reconstructed di-jet masses. However, these events are not removed since the simulation adequately describes the observed χ2 probability distributions in all
channels.
In the q¯qq¯q channel for those events with an identified ISR photon in the detector, the procedure of event clustering and fitting is modified [5]. In this case, the energy flow objects from which the ISR photon has been removed are forced into four jets. The fit is performed taking into account the modified constraints
" 4 X i=1 (Ei, ~pi) = (√s,~0) # → " 4 X i=1 (Ei, ~pi) = (√s−Eγ, −~pγ) # .
Of the 4861 data events selected after all cuts, 220 are treated in this way. Monte Carlo studies at 189 GeV show that the invariant mass resolution for these events improves from 4.1 to 2.9 GeV/c2 and the mean displacement of the masses from their true values
is zero within error. The improvement in the expected error on mW for all selected events
Jet pairing in the q¯qq¯q channel
At most one of the three possible jet pairings is chosen, based on the the CC03 matrix element |M(pf1, pf¯2, pf3, pf¯4, m
ref
W)|2, where the pfj’s denote the kinematically fitted
four-momenta of the respective jets and mref
W the reference W mass, taken to be 80.35 GeV/c2.
The combination with the largest value of |M|2 is in general selected (in 90% of the cases),
provided that (a) it does not have the smallest sum of jet-jet angles and (b) both fitted masses lie in the [60,110] GeV/c2 window. Otherwise (in 10% of the cases) if it satisfies
the same criteria, the combination with the next-to-largest value of |M|2 is chosen. If the
pairings with the two largest values of |M|2 are not accepted, the event is rejected. At
189 GeV [5] for example, the fraction of kinematically fitted signal events surviving these criteria is 80%. Of these events, 90% are found to have the correct combination of di-jets when comparing their directions to those of the original W → q¯q decays. The bias from the choice of reference mass is found to be negligible. In addition, the combinatorial and physical backgrounds do not show particular structure in the defined mass window.
6
Extraction of the W mass and width
The W boson mass and width are extracted by fitting simulated invariant mass spectra to the observed distributions. As in previous analyses [3, 4, 5] an unbinned maximum likelihood procedure is employed to find the best fits, using probability density functions obtained from the binned distributions of reference event samples, reweighting the Monte Carlo signal events with the CC03 matrix elements corresponding to various values of mW and ΓW. Two types of fits are performed for all four channels individually. In the
first, a one-parameter fit for mW is made, where ΓW varies with mW according to the
Standard Model as ΓW = 2.094 GeV × (mW/(80.35 GeV/c2))3. These results provide
the most precise value of mW. In the second, two-parameter fits are performed allowing
mW and ΓW to vary as two independent parameters. Although the shape of the invariant
mass spectra are dominated by experimental resolutions, these fits are used to test the validity of the SM prediction for ΓW and check for any correlation between the two fitted
parameters. Technically, the matrix element calculation assumes the Standard Model value for ΓW at a given W mass, for the coupling of electrons and their neutrinos to W
bosons and allows the width to vary freely only in the W propagator.
At LEP1, the Z mass was defined using a running-width scheme in the Breit-Wigner propagator. However, a fixed-width scheme has been employed in generating all WW events with KORALW. As a result, to make both mass measurements consistent with each other, a positive shift of 27 MeV/c2 is applied to the extracted W mass [29]. The
corresponding shift to the fitted width of 0.7 MeV is not significant.
The statistical error on mWand ΓWis computed from the fits to the data distributions.
Also, a large number of subsamples are studied, each with the same number of events observed in the data, to evaluate the expected errors.
The selection efficiency is found to be independent of the W mass. The variation of the total signal cross section with mW affects the purity of the selected events and is taken
into account, whereas its dependence on ΓW is assumed to be negligible.
The reweighting procedure was tested at 189 and 207 GeV by comparing the fitted with the input mass in each channel individually for four independent 4f Monte Carlo samples generated with mW values of 79.850, 80.100, 80.600 and 80.850 GeV/c2. The relationship
between the fitted and true masses was found to be linear for all channels over this range. The best straight line fits through the points are consistent with calibration curves of unit slope and zero bias, within the statistical precision of the test. Small deviations are observed in the eνq¯q channel from which a systematic uncertainty is derived (Sec. 8.4).
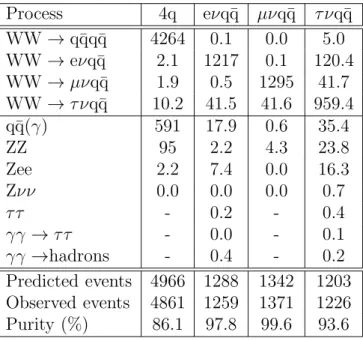
Table 2 gives the expected and observed numbers of events from all contributing processes for each channel which satisfy the kinematic fitting criteria after all window cuts are applied. The numbers of expected WW events are calculated with O(α) corrections using the standard 4f reference samples generated at mW = 80.35 GeV/c2.
Table 2: Expected numbers of events corresponding to the whole data sample (183-209 GeV) for signal and background processes after all selection, quality and window cuts for the four categories of events used in the extraction of mW and ΓW. All WW events are regarded as signal in the calculation of
the quoted purities per channel. The signal cross sections are determined with mW=80.35 GeV/c2 and
ΓW=2.094 GeV and the O(α) correction is applied.
Process 4q eνq¯q µνq¯q τ νq¯q WW → q¯qq¯q 4264 0.1 0.0 5.0 WW → eνq¯q 2.1 1217 0.1 120.4 WW → µνq¯q 1.9 0.5 1295 41.7 WW → τνq¯q 10.2 41.5 41.6 959.4 q¯q(γ) 591 17.9 0.6 35.4 ZZ 95 2.2 4.3 23.8 Zee 2.2 7.4 0.0 16.3 Zνν 0.0 0.0 0.0 0.7 τ τ - 0.2 - 0.4 γγ → ττ - 0.0 - 0.1 γγ →hadrons - 0.4 - 0.2 Predicted events 4966 1288 1342 1203 Observed events 4861 1259 1371 1226 Purity (%) 86.1 97.8 99.6 93.6
6.1
The q¯
qq¯
q channel
The two-dimensional reweighting fits used in the previously published analyses at 183 and 189 GeV [4, 5] are replaced by three-dimensional (3-D) fits which better exploit the available information from each event. The following three estimators were selected: (i) the 5C fitted mass, M5C, (ii) a random choice of one of the 4C di-jet unrescaled
masses, M4C and (iii) the kinematic fit error on the 5C mass, σM5C. Using a binned
3-D probability density function, a maximum likelihood fit is performed to the data within the following acceptance windows: 70 < M5C < 90 GeV/c2, 0 < σM5C < 4
GeV/c2 and 60 < M
4C < 110 GeV/c2 for both the one and two-parameter fits. The
allowed fit range for ΓW is loosely constrained to 1.1 < ΓW < 4.1 GeV. Bin sizes
in the probability density distribution of the 5C and 4C masses are chosen for signal and summed backgrounds separately such that the number of events of each type per bin is approximately constant. The third dimension is subdivided into four bins chosen
dynamically to equalise the number of signal events in each bin. This binning is kept for the summed background. The fitted mass is extracted in each of these bins in the third dimension and the likelihoods combined to determine the final mass and error. To avoid any bias, the minimum number of signal Monte Carlo events per 3-D bin is 200.
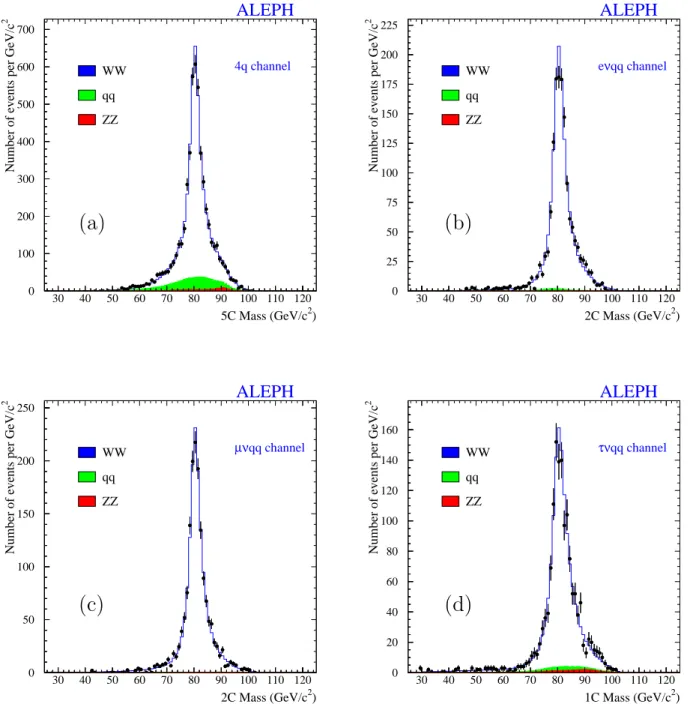
Fig. 3(a) shows the mass distribution from the 5C kinematic fits to the data before the window cuts between 70 and 90 GeV/c2are applied. For comparison the mass distribution
predicted from the simulation, reweighted to the fitted W mass in data, is superimposed.
6.2
The eνq¯
q and
µνq¯
q channels
The following variables are used to form a three-dimensional (3-D) probability density function: the 2C mass, M2C, where the leptonic and hadronic masses are constrained
to be equal, the kinematic fit uncertainty on the 2C mass, σM2C and the 1C hadronic
mass, M1Cq¯q. The event-by-event correlation between M q¯q
1C and M2C was found to be
43% at 189 GeV. By construction, the 3-D probability density function from the simulation takes into account all correlations amongst the three variables and leads to an improvement in statistical precision compared with a 1-D fit. Using a binned 3-D probability density function, a maximum likelihood fit is performed to the data within the following acceptance windows: 70 < M2C < 90 GeV/c2, 0 < σM2C < 10
GeV/c2, 60 < Mq¯q
1C < 110 GeV/c2 and with the fitted ΓW being constrained in the
range 1.1 < ΓW < 4.1 GeV. The bin sizes for the Monte Carlo events are chosen using
the same criteria as for the q¯qq¯q channel. The binning of the 3-D probability density function has 3 intervals along the event-by-event error axis. A stable mass value and statistical error are obtained when the minimum number of Monte Carlo events in any bin is 200 or greater.
Figs. 3(b) and (c) display the mass distributions for data resulting from the 2C kinematic fits to these semileptonic final states together with the predictions from the simulation.
6.3
The
τ νq¯
q channel
For τ νq¯q candidates, a 2-D reweighting fit uses the 1-C hadronic mass, M1Cq¯q and its uncertainty, σMq¯q
1C, from the kinematic fit. The events must be within the following mass
and error acceptance windows: 70 < M1Cq¯q < 90 GeV/c2 and 0 < σM1Cq¯q < 10 GeV/c 2.
In this channel, the allowed fit range for ΓW is 0.9 < ΓW < 4.3 GeV. The binning of
the 2-D probability density function has four intervals along the event-by-event error axis and 60 intervals of varying size along the 1C mass axis.
Figs. 3(d) displays the mass distribution resulting from the 1C kinematic fits to the data events together with the prediction from the simulation.
0 100 200 300 400 500 600 700 30 40 50 60 70 80 90 100 110 120 WW qq ZZ 5C Mass (GeV/c2)
Number of events per GeV/c
2 ALEPH 4q channel 0 25 50 75 100 125 150 175 200 225 30 40 50 60 70 80 90 100 110 120 WW qq ZZ 2C Mass (GeV/c2)
Number of events per GeV/c
2 ALEPH eνqq channel
(a)
(b)
0 50 100 150 200 250 30 40 50 60 70 80 90 100 110 120 WW qq ZZ 2C Mass (GeV/c2)Number of events per GeV/c
2 ALEPH µνqq channel 0 20 40 60 80 100 120 140 160 30 40 50 60 70 80 90 100 110 120 WW qq ZZ 1C Mass (GeV/c2)
Number of events per GeV/c
2 ALEPH
τνqq channel
(c)
(d)
Figure 3: Mass distributions in the: (a) 4q, (b) eνq¯q, (c) µνq¯q and (d) τ νq¯q channels for data (points with error bars), non-WW background (shaded area) and signal+background Monte Carlo with mW
values set to those fitted from each individual channel (solid line histogram). For the 4q channel, the distribution shows the 5C kinematically fitted dijet masses before window cuts are applied. For the ℓνq¯q channels, the distributions show the 2C (or 1C) kinematic fits before window cuts.
7
Studies on colour reconnection
The W bosons decay at a short distance from each other (1/Γ ≈ 0.1 fm), so that in the q¯qq¯q channel their decay products hadronise closely in space time at the typical hadronic scale of ≈ 1 fm. An interaction between the partons from different W decays may then occur.
At the perturbative level, the shift in the reconstructed W mass due to single gluon exchange is suppressed by the square of the number of colours and by an additional factor of ΓW/mW. The mass shift is of the order of a few MeV/c2 [19]. However, when the scale
of gluon exchange is not large compared with ΓW, non-perturbative colour reconnections
(CR) in the parton cascades may lead to much larger mW shifts.
At energies well above the pair production threshold, as in the present data set, the final state QED interconnection between the W’s induces a shift in mWof order αemΓW/π,
which is a few MeV/c2 [30] and insignificant compared with the uncertainties from
non-perturbative QCD.
7.1
Monte Carlo models
At the non-perturbative level, all phenomenological implementations of CR within existing hadronisation models predict that the particle flow distributions per event are modified with the low momentum particles in the inter-jet regions being most affected. Any effect on high momentum particles would occur only when a jet from a W−
is aligned with another from a W+. Such a topology would not survive the 4-jet selection. The effect
of CR on the fitted mW is studied using the following variants of the parton evolution
schemes:
(a) SKI, SKII, SKII′
[19] and GAL [20] in JETSET, (b) 2-step variants AR2 and AR20 [21] in ARIADNE and (c) HWCR in HERWIG [17].
As formulated, the SK versions in JETSET predict no effect at the Z and therefore, unlike the other variants, cannot be calibrated with Z data. The probability of an event to be reconnected depends on the string overlap between partons from the two W decays. In SKI, this is governed by a freely adjustable ‘string’ overlap parameter, ki, whereas
the predictions of the SKII and SKII′
variants are fixed once the string parameters are fitted in JETSET. When ki is set to 0.65, the fraction of reconnected events is similar to
SKII (29.2%) and SKII′
(26.7%). However, SKI(ki=0.65) predicts a larger shift in mW
than the other SK versions. The authors state that all SK models are equally valid [31]. The GAL implementation within JETSET allows string rearrangements to occur by colour exchange with the probability for reconnection depending upon the reduction in total string area between the old and new configurations. After tuning at the Z on global event properties, the fitted value of a non-perturbative free ‘strength’ parameter, R0, is
found to be 0.04 correlated with the shower cut-off, Q0, of 1.57 GeV/c. The author
recommends a larger value for R0 of 0.1 from fits to deep-inelastic scattering data which
would lead to a correspondingly larger mW shift (∼100 MeV/c2).
For AR2, both intra-W and inter-W reconnections are allowed between all dipoles with the same colour indices formed from emitted gluons with energy Eg. The parton
cascade is performed in two steps (i) allowing only intra-W reconnections with Eg > ΓW
applied either between or within the W’s. In principle, the predicted net shift in mW due
to inter-W reconnections is determined from the difference found between AR2 and the corresponding variant, AR21, where only intra-W reconnections are allowed. However, in practice it is found that the difference between AR20 and AR21 when tuned at the Z is not significant. Thus, the mW shift is taken from the comparison of AR2 and AR20 fitted
events.
In HWCR, the criterion for allowing colour reconnections is based on the reduction in space-time distances within the colour singlet clusters at the end of the parton shower. The reconnection probability is set to 1/9 for allowed re-arrangements. The parameter VMIN2, the minimum squared virtuality of partons, is set to 0.1 (GeV/c2)2.
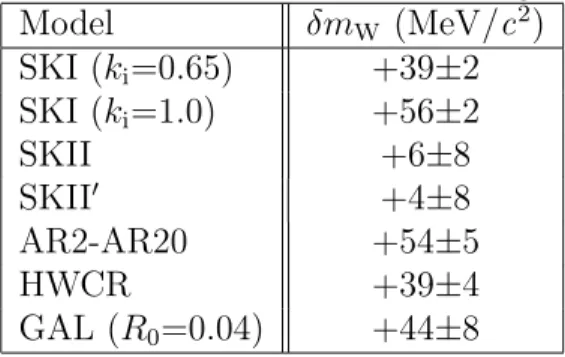
Table 3 gives the predicted mass shifts δmW = mW(CR) − mW(noCR) from these
models averaged over CM energies from 183 to 209 GeV. Details of the parameter settings used in the models are given in Appendix A.
Table 3: Predicted W mass shifts from various models averaged over all CM energies.
Model δmW (MeV/c2) SKI (ki=0.65) +39±2 SKI (ki=1.0) +56±2 SKII +6±8 SKII′ +4±8 AR2-AR20 +54±5 HWCR +39±4 GAL (R0=0.04) +44±8
The predicted mass shifts from the models tunable at the Z: GAL, AR2 and HWCR, range from 40 to 55 MeV/c2, suggesting for consistency that the value of k
i in the SKI
model should be of order 0.8.
To examine the validity of some of the tunable models of CR at the Z, the particle distributions in selected three-jet events were compared specifically with the predictions of AR2 and GAL [32]. If it can be assumed that the behaviour of colour rearrangements in the parton cascades of Z decays is the same as for WW, these observations suggest that the two models overestimate the effects on mW from CR.
7.2
Data Analysis
Keeping the originally reconstructed jets in each selected event, the W mass analysis is repeated twice, either removing all low momentum particles (PCUT analysis) [27], or rejecting particles outside cones directed along the four jet axes (CONE analysis) [33]. The difference from the mass measured without these additional cuts, called the standard analysis, is a sensitive observable of the CR effect according to all the above models.
For each of five values of the particle momentum cut off from 1 to 3 GeV/c in the PCUT analysis, each jet energy and angle is recomputed. In the CONE analysis, each jet energy is kept unchanged, whilst its three-momentum is recomputed from the vector sum of its remaining participating particles, rescaled by the ratio of the original jet energy to the energy of the particles inside the cone. Seven values of the cone opening angle R are used from 0.4 to 0.9 radians. Studies show that fragmentation uncertainties increase
rapidly for momentum cut-offs beyond 3 GeV/c or cone angles smaller than 0.4 radians. These values were found to provide optimal balance between statistical and systematic uncertainties on mW.
Figure 4 shows the expected variation of the mass due to CR as a function of the cut for the tuned AR2, HWCR and GAL models in the 183 to 209 GeV energy range. The SKI predictions for two values of kiare also included. The predictions for each of the eight CM
energies are combined using the relative integrated luminosities of the data. Table 4 lists the mW shifts, δmWPCUT and δmWCONE, for the PCUT(=3 GeV/c) and CONE (R=0.4
rad) reconstructions respectively. The corresponding mW shifts in the standard analysis
δmW0 are shown for comparison. Within errors the shifts for each reconstruction are
comparable for all tuned models and consistent with SKI (ki=1).
Table 4: Predicted W mass shifts (δmW) from various models averaged over all CM energies for the
CONE (R=0.4 rad) and PCUT (=3 GeV/c) reconstructions (units in MeV/c2).
Model δmW0 δmWPCUT δmWCONE
SKI (ki=1.0) +56±2 +19±4 +23±3 AR2-AR20 +54±5 +17±8 +20±6 HWCR +39±4 +13±7 +14±7 GAL (R0=0.04) +44±8 +27±12 +22±11 0 20 40 60 80 100 0 1 2 3 Pcut (GeV/c) δ mW (MeV/c 2 ) ALEPH SKI ki = 1 SKI ki = 2 AR2 HWCR GAL 0 20 40 60 80 100 -0.5 0 0.5 1 1.5 2 2.5 3 1/Rcone (rad-1) δ mW (MeV/c 2 ) ALEPH SKI ki = 1 SKI ki = 2 AR2 HWCR GAL
Figure 4: δmW versus (a) PCUT in GeV/c and (b) inverse CONE radius (R) in rad−1 for SKI (2 ki
values), AR2, HWCR and GAL models in the q¯qq¯q channel.
(a)
(b)
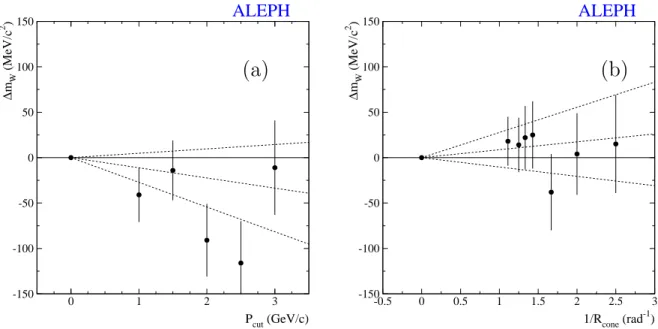
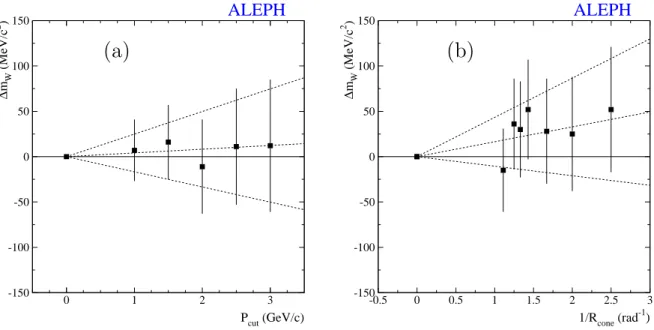
For the data collected at all CM energies combined, Fig. 5 shows the mass difference ∆mW between a PCUT or CONE reconstruction and the standard mass analysis. The
slopes are fitted with the full correlation matrix included and amount to −11 ± 16 (MeV/c2)/(GeV/c) for the PCUT analysis and +9±19 (MeV/c2)/(rad−1
) for the CONE. Both values are compatible with no effect.
Pcut (GeV/c) ∆ mW (MeV/c 2 ) ALEPH -150 -100 -50 0 50 100 150 0 1 2 3 1/Rcone (rad-1) ∆ mW (MeV/c 2 ) ALEPH -150 -100 -50 0 50 100 150 -0.5 0 0.5 1 1.5 2 2.5 3
Figure 5: ∆mW versus (a) PCUT in GeV/c and (b) inverse CONE radius (R) in rad−1 for q¯qq¯q data.
The dashed lines denote the fitted slopes and ±1σ errors. The correlation with respect to the standard analysis is taken into account in the error on the mass difference for each reconstruction.
(a)
(b)
A cross check was performed on all the semileptonic channels where no CR effect between the decay products of the different W’s can be present. The mass analyses in the eνq¯q and µνq¯q channels were repeated for PCUT and CONE following the same kinematic fit procedure as used in the τ νq¯q channel where only the hadronic jets are included. Figure 6 shows the corresponding mass differences for each cut value relative to the standard analysis after combining the results statistically from the eνq¯q, µνq¯q and τ νq¯q channels. No significant instability is observed. The combined ℓνq¯q channels represent a sample of size similar to the size of the q¯qq¯q channel and give a slope of +4 ± 21 (MeV/c2
)/(GeV/c) for the PCUT analysis and +16 ± 27 (MeV/c2)/(rad−1) for
the CONE, which are not significantly different from zero.
A limit on δmW can be inferred from a comparison between the slopes observed in the
data and those from the CR models. For each model, pseudo-data samples were built, combining all the CM energy points weighted by their respective integrated luminosities. In the case of the SKI model, 20 different values of the ki parameter are chosen, ranging
from 0 to 100.
The SKI model predicts a clear correlation between the mass shift for the standard reconstruction, δmW0, and the slope of the mass difference as a function of the PCUT or
CONE cuts as shown in Fig. 7. The clustering of the slope values from AR2, HWCR and GAL, around −10(MeV/c2)/(GeV/c) for PCUT and similarly for CONE corresponds to
the previously described values of δmW quantified in Table 4.
The covariance between the slopes, Scone and Spcut, is computed as well as the
resolution on the slopes from a Gaussian fit using the pseudo-data samples at each ki. The
average correlation between the PCUT and CONE slopes is 51 % with little dependence on ki. The RMS errors on the slopes are 18 (MeV/c2)/(GeV/c) for the PCUT analysis
and 19 (MeV/c2)/( rad−1
Pcut (GeV/c) ∆ mW (MeV/c 2 ) ALEPH -150 -100 -50 0 50 100 150 0 1 2 3 1/Rcone (rad-1) ∆ mW (MeV/c 2 ) ALEPH -150 -100 -50 0 50 100 150 -0.5 0 0.5 1 1.5 2 2.5 3
Figure 6: ∆mW versus (a) PCUT in GeV/c and (b) inverse CONE radius (R) in rad−1 for data from
the e, µ, τ νq¯q channels combined, fitting with the jets alone in each case
(a)
(b)
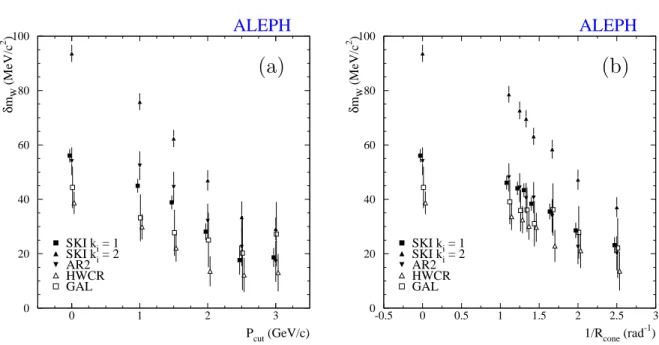
δmW0 (MeV/c2) Spcut ((MeV/c 2 )/(GeV/c))ALEPH
0 50 100 150 200 250 300 350 -80 -70 -60 -50 -40 -30 -20 -10 0 10 20 δmW0 (MeV/c 2) Spcut ((MeV/c 2)/(GeV/c)) -10 0 10 20 30 40 50 60 70 80 -20 -17.5 -15 -12.5 -10 -7.5 -5 -2.5 0 2.5 5 δmW0 (MeV/c2) Scone ((MeV/c 2 )/rad -1 )ALEPH
0 50 100 150 200 250 300 350 -70 -60 -50 -40 -30 -20 -10 0 10 20 30 δmW0 (MeV/c 2) Scone ((MeV/c 2)/rad -1) -10 0 10 20 30 40 50 60 70 80 -20 -17.5 -15 -12.5 -10 -7.5 -5 -2.5 0 2.5 5Figure 7: Slope of the mass difference relative to the standard analysis as a function of δmW0 for
(a) the PCUT and (b) the CONE reconstructions. The dashed line is a straight line fit to the SKI points represented by white circles. The black symbols represent AR2 (circle), HWCR (square) and GAL (triangle) predictions. The horizontal bands represent the measured slopes with their ±1σ errors.
(a)
(b)
in the data sample. A χ2 fit, defined as follows:
X αβ (Sαdata− S M C α (x))σ −1 αβ(S data β − S M C β (x))
where α, β signify PCUT and CONE respectively and σαβ the covariance matrix, is used
to extract the 68% CL Gaussian upper limit on x. The parameter x can be either ki or
δmW.
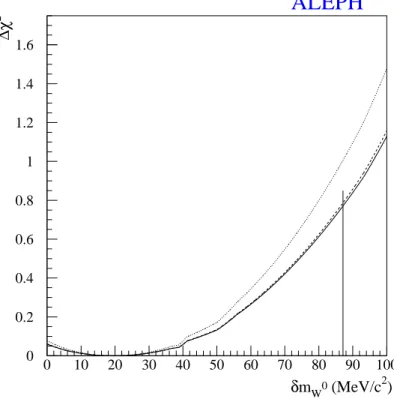
The χ2 curve is shown in Fig. 8 as a function of δm
W0. The upper limit on δmW0 has
been set to +78 MeV/c2, corresponding to the value at which the integral of the Gaussian
likelihood from zero is 68% of the full integral over the allowed (positive) range.
δmW0 (MeV/c2) ∆χ 2
ALEPH
0 10 20 30 40 50 60 70 80 90 100 0 0.2 0.4 0.6 0.8 1 1.2 1.4 1.6Figure 8: ∆χ2 as a function of the mass shift δm
W0 in the standard analysis. The dotted line is
with statistical errors only, the dashed line includes fragmentation errors, and the full line includes all systematic uncertainties.
The fragmentation uncertainty on this limit is estimated from the average bias on the slopes between an ARIADNE or HERWIG sample and the JETSET reference sample, repeated over the pseudo-data samples. The slope biases from ARIADNE, being largest, are used as diagonal terms of a systematic error matrix with 100% correlation between the PCUT and CONE slopes. This matrix is added to the statistical error matrix resulting in an increase in the mass limit to +86 MeV/c2. An estimate of the uncertainty in
evaluating the statistical error matrix yields a further small increase in the mass limit to +87 MeV/c2(corresponding to k
i (68% U.L.) = 1.88). Figure 8 shows the progressive
effect of adding these systematic uncertainties to the χ2 fits.
The same procedure is used to determine the mass shifts δmWPCUT and δmWCONE.
The upper limits on these mass shifts are given in Table 5 together with the limit from the standard analysis.
Both AR2 and HWCR agree well with the SKI prediction of the slopes as a function of δmW. However, the actual limit from SKI is larger than the AR2, HWCR and GAL
absolute predictions and therefore is taken as the systematic uncertainty due to colour reconnection for each reconstruction.
In practice, these limits on the mass bias depend linearly on the CM energy within SKI. From 183 to 209 GeV, the limit varies from 45 to 105 MeV/c2 when no cut is applied,
12 to 36 MeV/c2 for the PCUT and 18 to 45 MeV/c2 for the CONE respectively.
Table 5: CR mass shifts (68 % C.L. upper limits in MeV/c2) for the three reconstructions: standard,
PCUT and CONE using SKI derived from (a) the purely statistical analysis and (b) incorporating all systematic uncertainties. (a)SKI(stat.) (b)SKI(stat.+syst.) δmW0 78 87 δmWPCUT 25 27 δmWCONE 32 35
8
Systematic uncertainties
Systematic uncertainties in the measurement of mW and ΓW arise from an incomplete
description of the WW production process, inaccuracies in the simulation of event reconstruction in the detector and the modelling of the W decays to di-jets. The following subsections describe all the systematic uncertainties evaluated for the standard analysis in each of the four event categories. They are also determined in the q¯qq¯q channel for the CONE (R=0.4 rad) and PCUT (=3 GeV/c) reconstructions where the potential effects of colour reconnection (CR) are minimised.
The LEP energy uncertainties with year-to-year correlations are taken from Ref. [34]. All other uncertainties in the analysis are evaluated at 189 and 207 GeV, simultaneously in mW and ΓW from the two-parameter fits. When combining all the measurements, any
variation over this energy range is taken into account using a linear interpolation for the intermediate CM energies. Table 8 lists all the systematic uncertainties for the standard analysis as well as the optimal PCUT and CONE reconstructions in the q¯qq¯q channel. The CR uncertainty in this channel is taken into account at each CM energy. Table 9 lists all the systematic uncertainties in the standard analyses of the three semileptonic channels.
8.1
Detector simulation
The systematic uncertainties in the detector simulation for the q¯qq¯q events are those arising from the quantitative comparison of the reconstructed jet four-momenta with the data as described in Sec. 3. For the eνq¯q and µνq¯q channels, the uncertainties in the lepton four-momenta are included and combined in quadrature with those from the jets. Subsidiary studies of particles within the jets have been made by comparing the simulation with data for the effect of photon energy miscalibration and charged hadron tracking discrepancies. These uncertainties are already taken into account in those quoted for the jets. Each uncertainty is evaluated by first comparing the mean fitted parameters from special pseudo-data samples with corresponding normal samples each of the size of the data. The mean shifts found in mW and ΓW are then rescaled to correspond to the
residual discrepancies found between data and simulation after any corrections have been applied (Sec. 3.3).