HAL Id: hal-02150627
https://hal-sde.archives-ouvertes.fr/hal-02150627
Submitted on 7 Jun 2019HAL is a multi-disciplinary open access archive for the deposit and dissemination of sci-entific research documents, whether they are pub-lished or not. The documents may come from teaching and research institutions in France or abroad, or from public or private research centers.
L’archive ouverte pluridisciplinaire HAL, est destinée au dépôt et à la diffusion de documents scientifiques de niveau recherche, publiés ou non, émanant des établissements d’enseignement et de recherche français ou étrangers, des laboratoires publics ou privés.
Validation of an integrated satellite-data-driven response
to an effusive crisis: the April–May 2018 eruption of
Piton de la Fournaise
Andrew J.L. Harris, Magdalena Oryaëlle Chevrel, Diego Coppola, Michael
Ramsey, Alexis Hrysiewicz, Simon Thivet, Nicolas Villeneuve, Massimiliano
Favalli, Aline Peltier, Philippe Kowalski, et al.
To cite this version:
Andrew J.L. Harris, Magdalena Oryaëlle Chevrel, Diego Coppola, Michael Ramsey, Alexis Hrysiewicz, et al.. Validation of an integrated satellite-data-driven response to an effusive crisis: the April–May 2018 eruption of Piton de la Fournaise. Annals of Geophysics, Istituto Nazionale di Geofisica e Vulcanologia (INGV), 2019, 61 (Vol 61 (2018)), �10.4401/ag-7972�. �hal-02150627�
ACCEPTED ON ANNALS OF GEOPHYSICS, 61, 2018; Doi:
10.4401/ag-7972
Validation of an integrated satellite
-data-driven
response to an effusive crisis: the April–May 2018
eruption of Piton de la Fournaise
Andrew J.L. Harris1, Magdalena Oryaelle Chevrel1, Diego Coppola2, Michael
S. Ramsey3, Alexis Hrysiewicz1, Simon Thivet1, Nicolas Villeneuve4,
Massimiliano Favalli5, Aline Peltier6, Philippe Kowalski6, Andrea Di Muro6,
Jean
-Luc Froger1, Lucia Gurioli1
1 Universite Clermont Auvergne, CNRS, OPGC, Laboratoire Magmas et Volcans, 63000 Clermont- Ferrand, France.
2 Dipartimento di Scienze della Terra, Universita degli Studi di Torino, Via Valperga Caluso 35, 10125 Torino, Italy.
3 Department of Geology and Planetary Science, University of Pittsburgh, Pittsburgh, PA, USA
4 Laboratoire GeoSciences Reunion, Universite de La Reunion, Institut de Physique du Globe de Paris, Sorbonne Paris Cite, CNRS, F-97744 Saint Denis, France.
5 Istituto Nazionale di Geofisica e Vulcanologia (INGV), Via della Faggiola, 32, 56126 Pisa, Italy.
6 Observatoire Volcanologique du Piton de la Fournaise (OVPF), Institut de Physique du Globe de Paris, Sorbonne Paris Cite, Univ. Paris Diderot, CNRS, F-97418 La Plaine des Cafres, La Reunion, France.
Validation of an integrated satellite‐data‐driven response to an effusive crisis:
1
the April–May 2018 eruption of Piton de la Fournaise
2
Andrew J.L. Harris1, Magdalena Oryaëlle Chevrel1, Diego Coppola2, Michael S. Ramsey3, Alexis 3
Hrysiewicz1, Simon Thivet1, Nicolas Villeneuve4, Massimiliano Favalli5, Aline Peltier6, Philippe 4
Kowalski6, Andrea Di Muro6, Jean‐Luc Froger1, Lucia Gurioli1 5 1. Université Clermont Auvergne, CNRS, OPGC, Laboratoire Magmas et Volcans, 63000 Clermont‐ 6 Ferrand, France. 7 2. Dipartimento di Scienze della Terra, Università degli Studi di Torino, Via Valperga Caluso 35, 10125 8 Torino, Italy. 9 3. Department of Geology and Planetary Science, University of Pittsburgh, Pittsburgh, PA, USA 10 4. Laboratoire GéoSciences Réunion, Université de La Réunion, Institut de Physique du Globe de 11 Paris, Sorbonne Paris Cité, CNRS, F‐97744 Saint Denis, France. 12 5. Istituto Nazionale di Geofisica e Vulcanologia (INGV), Via della Faggiola, 32, 56126 Pisa, Italy. 13 6. Observatoire Volcanologique du Piton de la Fournaise (OVPF), Institut de Physique du Globe de 14 Paris, Sorbonne Paris Cité, Univ. Paris Diderot, CNRS, F‐97418 La Plaine des Cafres, La Réunion, 15 France. 16
Abstract. Satellite‐based surveillance of volcanic hot spots and plumes can be coupled with 17 modeling to allow ensemble‐based approaches to crisis response. We complete benchmark tests on 18 an effusive crisis response protocol aimed at delivering product for use in tracking lava flows. The 19 response involves integration of four models: MIROVA for discharge rate (TADR), the ASTER urgent 20
response protocol for delivery of high‐spatial resolution satellite data, DOWNFLOW for flow path 21
projections, and PyFLOWGO for flow run‐out. We test the protocol using the data feed available 22
during Piton de la Fournaise’s April–May 2018 eruption, with product being delivered to the 23 Observatoire du Piton de la Fournaise via Google Drive. The response was initialized by an alert at 24 19:50Z on 27 April 2018. Initially DOWNFLOW‐FLOWGO were run using TADRs typical of Piton de la 25 Fournaise, and revealed that flow at >120 m3/s could reach the island belt road. The first TADR (10– 26 20 m3/s) was available at 09:55Z on 28 April, and gave flow run‐outs of 1180–2510 m. The latency 27 between satellite overpass and TADR provision was 105 minutes, with the model result being posted 28 15 minutes later. An InSAR image pair was completed six hours after the eruption began, and gave a 29
flow length of 1.8 km; validating the run‐out projection. Thereafter, run‐outs were updated with 30 each new TADR, and checked against flow lengths reported from InSAR and ASTER mapping. In all, 31 35 TADRs and 15 InSAR image pairs were processed during the 35‐day‐long eruption, and 11 ASTER 32 images were delivered. 33 Introduction 34 Throughout the 1990’s and 2000’s methods were developed to extract lava flow discharge rates from 35 1 km spatial resolution satellite data collected by satellite sensors operating in the thermal infrared 36 (e.g., Harris et al., 1997; 2007; Harris & Bologa 2009; Coppola et al., 2010). At the same time, high 37 spatial resolution (30 m) satellite data were shown to be of value for mapping lava flow fields (e.g., 38
Flynn et al., 1994; Wright et al., 2000; Lombardo et al., 2009), with InSAR data allowing estimation of 39 lava flow areas, thicknesses and, hence, volumes (e.g., Zebker et al., 1996; Rowland et al., 1999; Lu et 40 al., 2003). In parallel, a series of lava flow models were developed to allow flow inundation areas to 41
be simulated (e.g., Young & Wadge, 1990; Crisci et al., 2003; Vicari et al., 2007). Increasingly, the 42
capabilities have been merged to allow an ensemble‐based approach whereby satellite data from 43 multiple wavelengths and spatial resolutions are combined to allow maximum constraint and cross‐ 44 validation (e.g., Patrick et al., 2003; Rowland et al., 2003; Wright et al., 2005) and source term input 45 into real‐time lava flow emplacement models (e.g., Wright et al., 2008; Vicari et al., 2011; Ganci et 46
al., 2016). Since 2015, just such a response model has been developed at Piton de la Fournaise 47 (Harris et al. 2017), where we here review and validate an updated version of the protocol so as to 48 review an ensemble approach to responding to an effusive crisis. 49 The response protocol is based on in situ observations and data acquisitions carried out routinely by 50 the Observatoire du Piton de la Fournaise (OVPF) team and the integration of four models: MIROVA 51
(Coppola et al. 2016), the ASTER (Advanced Spaceborne Thermal Emission Radiometer) urgent 52
response protocol (Ramsey, 2016), DOWNFLOW (Favalli et al., 2005) and FLOWGO (Harris and 53
Rowland, 2001). MIROVA is a near‐real time hot spot detection system that uses MODIS data, and 54
has been calibrated for TADR calculation at Piton de la Fournaise by Coppola et al. (2010), the ASTER 55
urgent response protocol is a means of automatically prioritizing and targeting ASTER data 56
acquisition during a volcanic eruption. Instead, while DOWNFLOW is a stochastic model that 57
assesses potential flow paths based on iterative runs over a DEM with random noise added, FLOWGO 58
can calculate the cooling‐limit of flow down each path (Rowland et al., 2005; Wright et al., 2008). To 59
estimate the maximum distance a flow can extend at a given effusion rate, FLOWGO tracks the 60 thermal and rheological evolution of a control volume of lava as it moves down a channel, tracking 61 the volume until the volume cools and crystallizes to such an extent that forward motion becomes 62 rheologically impossible (Harris and Rowland 2015). FLOWGO has been initialized for and tested for 63 lava channels at Piton de la Fournaise by Harris et al. (2016) and Rhéty et al. (2017), and—to allow 64 improved model initialization, iteration and application—has been rewritten and rebuilt in Python as 65 PyFLOWGO (Chevrel et al., 2018). It is this version of FLOWGO that we use here. 66 As described in Harris et al. (2017), the response protocol is initialized with the alert of an imminent 67
eruption and provision of the vent location provided by the OVPF as part of their mandated 68 monitoring and response procedures. Subsequently, it involves calling each model in sequence and 69 passing results between each actor, and then final product to OVPF, in as timely fashion as possible. 70 The protocol also calls in ground truth (for vent locations, effusion rates, channel dimensions, flow 71
lengths) provided by the OVPF as well as textural and chemical data (for eruption temperatures, 72
vesicularity, crystallinity, rheological models) produced at LMV, to improve model uncertainty and 73
syn‐response validation. We show here how the response protocol works, and define the main 74 uncertainties, using a real‐time exercise held immediately after the April–May 2018 eruption of Piton 75 de la Fournaise. The aim of the exercise was to refine model initialization and execution for Piton de 76 la Fournaise, reduce uncertainty, and to fully define the call‐down and communication protocol. It 77 involved first following the data feed and executing responses, in the order that they were received, 78
followed by a validation phase in which remote sensing and model based estimates for discharge 79
rate and flow length were compared against ground truth. In doing so, we show how an integrated 80
multi‐sensor remote sensing approach can be used to follow, document and quantify an effusive 81
event in near‐real time. 82
The April–May 2018 eruption of Piton de la Fournaise and available data 83 The April–May 2018 eruption of Piton de la Fournaise began late on 27 April (19h50 UTC) from five 84 north‐south orientated en‐echelon fissures that opened between the elevations of 2165 m and 2285 85 m on the southwest flank of the terminal cone (Figure 1a). Initially flow was channel‐fed 'a'a which 86
moved down the SW flank of the Dolomieu. In a short time activity reached a peak and became 87
focused at a main vent roughly central to the fissure line at an elevation of 2200 m. Another much 88
less active vent a few meters to the north continued to project tephra and emit flames. Around the 89
two vents, scoria cones and tephra fields were constructed. Upon reaching the base of the Enclos 90
Fouqué wall (between the 29 and 30 April), lava flows turned southeast to follow the base of the wall 91
reaching a distance of 2.6 km before discharge rates declined and active flow fronts retreated to 92
positions closer to the vent (Figure 1b). Between 4 and 7 May, flow activity was concentrated in the 93
proximal section of the flow field with several tubes and, with two main zones of breakout being 94 active 200 and 500 m down the tube system (Figure 1c). Breakouts from the tube system fed low‐ 95 discharge rate flows which extended no more that 100–200 m. From 7 May new lava flows broke out 96 from an ephemeral vent at the base of the Enclos Fouqué Southern wall producing local vegetation 97 fires. Over the following days, the tube continued to extend and feed lava flows from its terminus, so 98 that by 10 May the tube exit was around 3.2 km from the vent. This continued to feed low‐discharge 99
rate flows that extended over 1.1 km (or 4.5 km from the main vent) along the base of the Enclos 100
Fouqué wall. Activity continued in this way until 1 June 2018 when activity died out around 14h30 101
(local time). During the 34.6‐day‐long eruption, six aerial photograph, two aerial IR image and 102
several field observation campaigns, including GPS measurements, lava and tephra sampling, gas 103 analysis and UAV over flights were completed by the OVPF. In addition, 35 cloud‐free MODIS images, 104 11 ASTER images and 15 InSAR image pairs all of which were available for near‐real time analysis and 105 reporting. 106 Methodology 107
While implementation of MIROVA and the ASTER urgent response protocol (URP) allow near‐real 108
time collection and processing of satellite thermal data for derivation of time‐averaged discharge 109 rate and mapping of a thermal anomaly, DOWNFLOW and FLOWGO (DOWNFLOWGO) allow the flow 110 paths and potential run out distance to be projected. These models are called in sequence, where 111 the call‐down procedure is given in Figure 2. As part of this system, output and product are shared 112
using a standardized reporting form (as given in Appendix A) which is shared between an email 113
distribution list involving all actors in the response chain, and to OVPF for integration into 114 surveillance and reporting duties. With each update, the group is issued an update email, flagging 115 the field that has been updated and giving the time and date of the update as well as the name of 116 the person responsible for the update. The reporting form has four fields for: (i) current MIROVA‐ 117 derived TADR and time series; (ii) current vent location and DOWNFLOWGO projections; (iii) current 118
ASTER thermal distribution map, with flow field evolution time series and report; (iv) InSAR‐based 119
flow length report and coherence images (Appendix A). Another field may be added to the reporting 120
form including relevant OVPF data collection, e.g., flow length from Structure from Motion (SfM), 121
SO2 flux, sampling locations etc. This is left at the observatory’s discretion to add depending on work 122
loads and time commitment. 123
MIROVA and ASTER were called using the observatory bulletin announcing implementation of alert 124 level 1, that is an eruption is believed (on the basis of seismic and ground deformation data) to be 125 “imminent” (in the next minutes/hours). This causes ASTER to be targeted, and MIROVA to set up a 126 “watch” for the first sign of a hot spot. Upon eruption onset, DOWNFLOWGO is run as soon as vent 127
location(s) (GPS coordinates) is (are) known. The first vent location is usually provided by OVPF 128
personnel or gendarmerie using hand‐held GPS from a helicopter which is flown by the police 129
(gendarmerie) service. Precision may vary depending on flight time available, the height of the 130
fountains and the number of aircraft in the air space above the eruption site. Initially, to give an 131 immediate idea of likely flow paths and inundation areas, 10000 flow lines are run to the edge of the 132 DEM (i.e., the coast) over the most recent 5‐m DEM with random noise of between ±0.8 m and ±2.5 133 m being added between each run. The slope from the line of steepest descent (LoSD) at ±0.001 m is 134
then extracted (and smoothed every 10 m) and used for preliminary FLOWGO runs at various 135
effusion rates (10, 20, 30, 40, 50, to 100 m3/s). To do this, FLOWGO is initialized prior to the call 136
down using typical Piton de la Fournaise thermo‐rheological conditions and textural properties as 137
given in Table 1. At the beginning of the eruption, a typical channel width of 4 m is taken (Table 1), 138
and the model iterates on depth until the combination with calculated velocity gives the required 139
effusion rate. Subsequently, upon derivation of a first TADR from MIROVA, the cooling‐limited 140
extent of flow down each flow line is then updated. Runs driven by the MIROVA‐derived TADR are 141
then plotted over a Piton de la Fournaise base map to give an idea of how the flow front may extend, 142
or retreat, if TADRs increase (or decrease) over the current level. In addition, if vent location or 143 channel width information are updated or made available, these are also modified and all models re‐ 144 run. 145 Upon receipt of the first ASTER imagery a thermal anomaly map is produced, and flow locations and 146 lengths assessed on the basis of the spatial distribution of spectral radiance in 90 m ASTER band 12 147 (thermal infrared, 8.925–9.275 µm). In addition, vent location is checked where the intense thermal 148 anomaly at the vent is apparent in ASTER band 3 (near‐infrared, 0.807 µm) image. The 15 m‐pixel 149
size, and one pixel accuracy of the geolocation, allows the location of the vent hot spot to ±15 m. 150 This is often better than that provided by hand‐held GPS, which when run in a fast moving helicopter 151 records a point that will lag behind the craft point by several hundred meters. If this is the case, the 152 vent location is updated and new DOWNFLOWGO runs are produced. If tubes begin to extend from 153
the vent, this—following Wright et al. (2000)—becomes apparent in the high spatial resolution 154
satellite images from the distribution of spectral radiance. In such as case, the source for 155
DOWNFLOWGO will be moved to the tube exit. 156
In addition, InSAR interferograms and SfM data are processed for flow thickness and length maps 157
that both add to the information flow and allow validation of model‐based flow‐length projections. 158
Although remaining largely underutilized in an operational response sense, the value of such data in 159
producing lava flow thickness maps as long been known (e.g., Zebker et al., 1996; Rowland et al., 160
1999; MacKay et al., 1998; Stevens, 2002; Lu et al., 2003), as has the potential for merging with 161
ancillary data, such as thermal‐IR‐derived TADRs and model‐based lava flow run‐outs (Rowland et al., 162
2003). The InSAR method consists of computing an interferogram by subtracting the phase between 163
two SAR images acquired for the same area at different times (for details of the method see 164
Appendix B). These statistics which are input into a fourth field in the reporting form (Appendix A) 165
and are also used to update the DEM used for flow path runs. 166
Validation 167 On 4 May 2018 an over flight was made in an ultra‐light aircraft at a flight height of around 310 m 168 above the ground surface. A thermal camera was used to collect 52 images of the lava flow field and 169
vent system between 12:15 and 12:30 local time. The thermal camera was a FLIR Systems T650 170 which provides a 640 × 480 pixel image in the 8–14 µm waveband, with 0.65 mrad pixels. This, over 171 a line‐of‐sight distance of 460 m (and viewing angle of 48°) gives a pixel size of 0.3 m. Images were 172 used to obtain vent (eruption) temperatures and down channel surface temperature profiles to use 173
in FLOWGO, as well as channel and flow dimensions plus radiative (Qrad), convective (Qconv) and total 174
(Qtot = Qrad + Qconv) heat fluxes to check against model output. In addition, the MODIS and ASTER 175
images collected at 10:30 (local time) on the same day (i.e., two hours previously) were fitted to the 176
thermal camera image mosaic to allow the heat fluxes and TADRs to be compared. TADR was 177
extracted from the thermal camera images using TADR = Qtot / (cp T + f ), in which is the lava 178
density, cp is specific heat capacity, T is the cooling range, f is the fraction of crystals grown down 179
flow and is latent heat of crystallization. Values characteristic of recent lavas at Piton de la 180
Fournaise were used for , cp, and f, these being 2079 kg/m3, 1225 J/kg K and 0.1, respectively, with a 181
cooling range of 75–250 °C (Harris et al. 2007). At the end of the eruption, following sample analysis, 182
the chemical, temperature, crystallinity and vesicularity sections of the initialization file for flow 183 modeling are checked, and if necessary, updated (Table 1). 184 Results 185 The trigger for the protocol of Figure 2 was the Bulletin released by OVPF on 27 April 2018 at 20h30 186
local time (16h30 UTC). The bulletin declared that a seismic crisis had begun at 20h15 local time 187
(16h15 UTC) accompanied by rapid ground deformation indicative of “magma leaving the storage 188
system and propagating towards the surface” (Peltier 2018). Consequently, an eruption was 189
declared probable in the following minutes or hours, and the alert level was set to “Alert 1” (Peltier 190
2018). As a result, the MIROVA “watch” began at 20h30 (16h30 UTC) on 27 April, with an ASTER URP 191
being triggered at 04h25 (00h25 UTC) on 29 April (Appendix C). In addition, on receipt of the 192
Bulletin, DOWNFLOWGO was loaded with the most recent DEM of Piton de la Fournaise, this being 193
the 5‐m DEM generated from LiDAR data in 2010 modified by adding the largest flow fields in the 194 area that are the October 2010 and the August 2015 using the InSAR‐based thickness maps. 195 The eruption began at 23h50 local time (19h50 UTC) on 27 April. Initially DOWNFLOWGO was run 196 from a vent location set on the basis of fissure location relative to pre‐existing topographic features 197 as apparent in images acquired by OVPF’s web‐cam monitoring network. For this case, the camera 198
used was that of “Piton Bert” (BERC, http://www.ipgp.fr/fr/ovpf/reseau‐de‐cameras) which targets 199
this sector of the volcano. Comparison of a daytime image as a background layer and an image 200
acquired during the eruption revealed the fissure to approximately extend between two newly 201
formed cinder cones at an elevation of 2200 m on the SW flank of the terminal cone. These cones 202
were located at 365375 m E; 7649065 m S and 365500 m E; 7848455 m S, and DOWNFLOW was 203 launched from a point between the two cones at 365377 m E; 7648853 m S. This showed that the 204 flows would likely move SW down the flank of the terminal cone, and then turn SE to following the 205 caldera wall to the coast (Figure 3). The effusion rate contour map for this case was subsequently 206
produced and posted on the reporting form (Figure 3). This revealed that flows fed at sustained 207
rates in excess of 120 m3/s were capable of reaching the island belt road, to reach the coast. 208
However, because a 4 km wide basin existed after a distance of 4 km from the vent, flows became 209 held up at this point, with even flows at 80 m3/s coming to a halt 4 km from the vent; and to push the 210 model across the basin needed more than 120 m3/s. Thus, in reality, our prediction was that either 211 time would be needed to fill this basin, where lava needed time spread and pile up, and/or for a tube 212
to develop across the basin—a little like the case of lava flow advance towards Etnea Zafferana in 213
1992 (Barberi et al. 1993). 214
The first cloud‐free MODIS overpass occurred at 09h55 (UTC, 13h55 local time) on 28 April, i.e., 215
around 14 hours after the eruption began. This yielded a TADR of 10–20 m3/s (Table 2). These 216
values were immediately input into the reporting sheet, thereby being handed onwards for input 217
into the PyFLOWGO initialization file. The first lava flow projection map was thus also completed and 218
posted; revealing flows were capable of extending up to 1180–2510 m under initial conditions 219
(Figure 4a). The latency between satellite overpass and TADR provision was 105 minutes, with the 220
model result being posted 15 minutes later. The first S1B InSAR image pair was completed around six 221
hours after the eruption began and was also entered into the reporting sheet (Figure 5a). These 222
revealed that the flow was already 1.8 km long and covered an area of 0.5±0.1 × 10⁶ m2 (Table 3); 223
giving an initial extension rate of around 5 m/min and coverage rate of 1400 ²/min. On the same day, 224
at 09h00 (local time), the first SfM survey was completed and by 16h00 (local time) approximate 225 location of the fissures and flow outline from aerial images were published by the OVPF. 226 At 03h33 (UTC, 07h33 local time) on 30 April, after a new aerial visit of the eruption, the center of 227 the main fissure was precisely given at 365365 m E; 7648810 m S. By this time, however, MODIS‐ 228
derived TADR had declined to 3.7–6.9 m3/s (Table 2). Updating PyFLOWGO revealed reduced run‐ 229 outs of 0.7–1.0 km. The first cloud‐free ASTER image was acquired on 2 May. This revealed an 11 230 pixel‐long anomaly of saturated pixels orientated NE‐SW on the south flank of the Dolomieu (Figure 231 6)—equivalent to a 990 m long zone of active lava (Table 4). The active vent was apparent as a single 232
pixel hot spot in the 15‐m near‐infrared data and the vent location was updated to 365280 m E; 233
7648835 m S (Appendix D), with the TADR for this day being 3.6–4.6 m3/s (Table 2). These details 234
were updated in the reporting form, and the vent location for DOWNFLOWGO adjusted slightly 235
(although this had no effect on the flow paths or LoSD). The following day (3 May), the second 236 coherence map was produced. This revealed that the lava flow field had, at some point, reached the 237 base of the caldera wall, turning SE to follow the base of the wall (Figure 6) having attained a length 238 of 2.5 km (Table 3). The shorter length of the active flows implied by the size of the thermal anomaly 239 in ASTER on 2 May, as well as the 17 pixel (1530 m) long zone of cooler pixels beyond the front of the 240 main hot spot indicated that flow front locations had begun to retreat back up flow by this time. 241
The thermal camera imagery obtained from the over‐flight of 4 May confirmed that activity had 242
diminished, and comprised tube‐fed breakouts of channel‐fed 'a'a (Figure 1c). Two main breakouts 243
were located where the southern breakout was fed by a 2 m‐wide channel which fed a 110 m pad of 244
'a'a. Total heat flux from the breakout was 435±50 MW, which converted to a TADR of 0.61–1.65 245
m3/s. ASTER imagery revealed that, by 9 May, the tube had extended 2430 m (Figure 6) to feed lava 246
flows of around 1.4 km in length. At the same time, MIROVA revealed continued decline in TADR 247
(Figure 7) to between 1 and 2 m3/s. As a result, the vent location for DOWNFLOW was moved to the 248
tube exit, which ASTER gave as being at 364685 m E; 7647090 m S, and FLOWGO run at 1.6 and 3.8 249
m3/s (Table 2) with an updated channel width and eruption temperature (Table 1). This gave flow 250
lengths of 1–2 km beyond the end of the tube system (Figure 4b). 251
Thereafter, TADRs remained at low levels (Figure 7) and the flow field continued to build parallel with 252
the base of the caldera wall (Figure 5). TADRs of 0.8 m3/s characteristic of the final week of the 253 eruption (Table 2) gave flow lengths that extended just 1 km from the end of the tube (Figure 4b). 254 The flow field (both predicted and measured) attained a final length of 4.1 km and area of 1.3±0.1 × 255 106 m2 (Table 3), and a volume of 5.5±1.6 x 10⁶ m2 (Table 2). In all, 35 TADR sets were processed by 256 MIROVA (Table 2), 15 image pairs were processed for coherence analysis (Table 3), 11 ASTER images 257 were obtained using the ASTER URP (Table 4) and DOWNFLOWGO was launched three times as TADR 258 and vent location changed. Additionally, six aerial photograph data sets, two aerial IR image surveys 259
and multiple field observations, including lava and tephra sampling, gas analyses, UAV over flights 260
were completed by the OVPF. The final reporting sheet, filled out with all derived values from this 261 data set, is given in Appendix D. 262 Discussion 263 The aerial survey mapping of the flow field of 30 April allowed checking of the dimensions of the lava 264
flow field derived from InSAR data; the center line length being 1.8 km (the same as that given by 265
InSAR) and the area having excellent coincidence with the zone of incoherence obtained from the 266
InSAR data. Likewise, dimensions of InSAR zones of incoherence, ASTER thermal anomalies and 267
FLOWGO lengths are in excellent agreement (Figure 8). For example, the thermal anomaly in ASTER 268
on 2 May revealed that flows had extended to a maximum distance of 2520 m in the proceeding 269
days. This compares with the 2.5 km long zone of incoherence recorded by the InSAR pair processed 270
the following day (3 May) and the 2510 m flow length generated by FLOWGO using the maximum 271 TADRs obtained from MIROVA the first few days of the eruption. Closing the circle with validation of 272 the FLOWGO run outs with good fits with dimensions of incoherence and thermal anomalies in InSAR 273 and ASTER data gives us confidence in the source terms (including MIROVA‐derived TADR) entered 274
into the model. We next assess the uncertainty in those MIROVA‐derived TADR, as well as the 275
FLOWGO run‐outs and errors due to DEM problems. 276
Validation of MIROVA‐derived TADR 277
The image collected on 4 May by MODIS‐MIROVA indicates a total radiant power (Qrad) of 497±149 278
MW, corresponding to a total TADR of 2.6±0.6 m3/s. Total radiant power is around 42 % of that 279
measured for the south breakout on 4 May using the thermal camera (i.e., 209±20 MW). The TADR 280
(1.13±0.52 m3/s) obtained from the thermal image is also 43 % that of the MODIS‐MIROVA, 281
indicating confidence in the latter value and the conversion routine used. In this regard, MODIS‐ 282
MIROVA uses the conversion Qrad/TADR = cRad (Coppola et al. 2010). For Piton de la Fournaise, 283
Coppola et al. (2010) used thermal camera data for the May–June 2003 eruption to obain cRad of 284
2.5±1 × 10⁸ J m‐3. The value of cRad obtained here is 2.3±1 × 10⁸ J m‐3 indicating that the conversion 285 factor is stable, still holds and provides a TADR in good agreement with ground truth. 286 FLOWGO Uncertainty 287 To test uncertainty, we take our initial run of 28 April which was initialized with a TADR of 20 m3/s 288
and vary the source terms of Table 1 within reasonable limits. Using the generic source terms of 289
Table 1, the model solved for a channel depth of 4 m give a distance of 2510 m (Figure 4a). 290
Our first uncertainty is in eruption temperature. Thermal camera imagery of the vent on 4 May 291 yielded maximum temperatures of up to 1210±40 °C, a value which is suspiciously high. On 10 May, 292 similarly suspicious temperatures of 1700 °C were recorded over a small skylight at the base of the 293
main scoria cone. These temperatures are higher than the liquidus for Piton de la Fournaise and 294
therefore cannot correspond to lava temperatures. However, nighttime observations revealed 295
flames over the vent, so this appears to be a flame temperature, where the presence of the flame 296
likely explains the intense thermal anomaly in the ASTER NIR band. Flame‐free maxima were 297
1142±35 °C, consistent with temperatures obtained from the glass chemistry. If we update the 298
eruption from 1114 °C temperature to 1142 °C (and readjust the channel dimension to balance for 299
similar TADR) this increases the run out by just 30 m, revealing that a 3 % uncertainty in eruption 300 temperature results in a 1 % uncertainty in run out. 301 Our second uncertainty is in bubble content and crystallinity and associated rheology models. Based 302 on our analysis of lava samples from the 2015 channel, bubble content could be as high as 50 vol.% 303
and phenocryst content as low as 1 vol.%. Because we use a simple two phase (fluid+crystals) 304
mixture model bubble content effects the velocity equation through its effect on density, while the 305
lower starting crystal content reduces the viscosity of the mixture. While increasing the vesicularity 306
to 50 vol.% decreases run‐out by 120 m (11 %), decreasing the phenocryst content to 1 vol.% 307
increases run‐out by 470 m (28 %). 308
The third uncertainty is on surface temperature which controls heat loss and hence cooling rate. We 309
have used the typical effective radiation temperature approximated from the data of Flynn and 310
Mouginis‐Mark (1994) for a lava channel on Kilauea to initialize the model (Table 1). The thermal 311
imagery of the south break out channel indicates that this may be a little low, where temperatures 312
down the center line are 520–890 °C, with a mean and standard deviation of 740 °C and 80 °C. If we 313
use this mean temperature for the effective radiation temperature, we have a flow length that 314 decreases by 230 m (23 %). 315 Our final uncertainty is on channel width. If, for example, we reduce to a width of 2 m, depth and 316 velocity have to increase to 1.1 m and 4.8 m/s to balance the TADR. This yields a runout of 2550 m 317 or 46 % longer, so that an uncertainty on channel depth of 50 % yields uncertainty on runout of the 318
same order. However, to extent uncertainties may cancel. If for example, we increase the 319
vesicularity to 50 vol.% but decrease the phenocryst content to 1 vol.% we change the runout by just 320
50 m (for the same TADR). Likewise, if we decrease channel width to 2 m, but increase surface 321 temperature to 740 °C we change the runout by 50 m. Thus, our error appears to be around 4‐5 %, 322 so that the error on a predicted runout of 3000 m, is just less than a few hundred meters. 323 DEM uncertainty 324 Until now, for the near real time response at the effusive crises at Piton de la Fournaise, DOWNFLOW 325 was run on the SRTM DEM from 2005. When we first ran the DOWNFLOW simulation (in May), the 326 LoSD was not south to the base of the Enclos Fouqué wall, but projected due East. It was not possible 327
to simulate the actual flow path because post‐2005 topography could not be accounted for. 328 However, now that we have updated our flow projection by using the 5‐m 2010 DEM to which lava 329 flow fields from October 2010 and August 2015 (which were both in the southern area of the Enclos 330 Fouqué) were added, the predicted path is south, moving around the western edge of the 2015 flow 331 field, and to reach the wall before flowing to the east along its base. This was exactly the trajectory of 332
the flow. Note that although the eruptive fissures were located near and onto the February 2015 333
flow (on the distal part) we did not update the DEM with this lava flow as it did not interfere with the 334
ongoing flow process. To model flows on a very active volcano, where topography is constantly 335 changing, we thus need a DEM that is updated after each eruption, so as to reduce uncertainties on 336 predicted flow inundation area. 337 To obtain the inundation area, DOWNFLOW needs to be calibrated to a specific scenario, and this is 338 achieved by tuning N and Dh (Favalli et al. 2011). Previous simulations that were compared with real 339 cases at Piton de la Fournaise showed that N=10000 and Dh of 2.5 m gives a good approximation of 340
the proximal area around the Dolomieu, while a Dh of 0.8 m gives a better estimation of the lava 341
flow distal, coastal zone. Subsequently, to obtain the LoSD, DOWNFLOW is first run with 1000 342 iterations at Dh=1 mm which allows pits and holes to be filled. This filled DEM is then used to obtain 343 a second LoSD with N=1 and Dh=0.001). Down the LoSD a slope value is extracted every 10 m for use 344 in PyFLOWGO. PyFLOWGO includes traps for cases where slope values are negative or zero, where 345 the slope is recalculated at each step from the average of the five previous and five following positive 346
and non‐zero values down the LoSD (Chevrel et al. 2018). This allows FLOWGO to overcome small 347 terrain irregularities, and to project across holes and pits as well as flat zones. The value of 10 m has 348 been chosen from several simulations and seems to be the best suited value. Although precise DEMs 349 are always preferred, we find we have to smooth the LoSD in order to obtained results in agreement 350 with reality. 351
In the present case, the changes in vent location between the first estimation and the coordinates 352
obtained in the field or from the satellite images did not change significantly. The effect on the 353
predicted flow path was therefore minor and limited to within 100 m of the vent area. However, 354
knowing, and moving to, the break out location of 9 May, was essential to predict the final flow 355
length (at the given new TADR). The protocol we are offering here, that is sharing ASTER, MODIS, and 356
DOWNFLOWGO allow a back and forth to update the vent location and is therefore of major 357
improvement for correct estimation of the lava flow path and runout distance. In addition this 358
protocol is of service to OVPF to aid in monitoring needs for lava flow field evolution allowing both 359
crisis management and appraisal of need to evacuate ground based monitoring stations falling in 360
flow paths. 361
Conclusion 362
With the near‐real time availability of data from so many satellite‐based sensors, as well as the 363
immediate availability of ground truth through upload to internet‐based data hubs, the best way 364
forward to tracking an effusive crisis is an ensemble‐based approach. Such a system is open to 365
expansion and ingestion of further data sets to improve coverage and further reduce lags between 366
event and measurement. For example, VIIRS (Visible Infrared Imaging Radiometer Suite) can be 367
considered as an extension to MODIS (Blackett 2015), and Sentinel‐2 as an extension to ASTER 368
(Cappello et al. 2018), with other sensors being incorporated as they come on‐line. In this regard, 369
technology is constantly evolving with new potential coming‐on line every year where, for this case, 370
we have begun to convolve data from sensors flown on UAVs, as well as from crowdsourcing. 371
Another developing avenue is small, low cost satellite networks, such as the small satellite 372
Technology Experiment Carrier‐1 (TET‐1) as developed by the German Aerospace Center and 373
dedicated to monitoring high temperature events (Zhukov et al. 2006). Such systems offer high 374
spatial resolution (160 m) thermal infrared imagery at a relatively high temporal resolution (3 days) 375
and have shown to be of value in tracking effusive crises yielding TADR time series to supplement 376
those provided by MODIS (Zakšek et al. 2005). 377
As shown here, merging thermal data of different resolutions allows time series generation with the 378
best possible temporal resolution and precision; cross‐validation of TADR, error and uncertainty 379
assessment; and input into lava flow emplacement models. The next step will be the use of InSAR 380
data to allow DEMs to be updated between eruptions so as to ensure that flow paths are correct and 381
use the most up‐to‐date topography available, with the DEM evolving as the topography changes. 382
This is a key feature, especially during a long‐term eruption with changing topography and vent 383 position. In turn, the chain can be inverted where good agreement of model‐predicted flow lengths 384 with dimensions of thermal and incoherence anomalies in high spatial resolution and thermal data 385 suggests that the source terms input into the model are valid. Another key feature explored here is 386 immediate delivery of a flow run out map that considers all feasible TADRs. This means that delivery 387
of the hazard map, which can be created in a few minutes, does not have to be attendant on the 388
first, cloud‐free satellite overpass for delivery of a TADR. Instead, the map gives the hazard manager 389
an immediate idea of possible event scenario’s which can be assessed and checked when the first 390
TADR comes in, and updated as vent locations and topographies change. 391
392
Acknowledgments. This work comes out of a three day workshop and exercise held in Clermont 393
Ferrand in June 2018 funded by ANR‐LAVA. This work was funded by the Agence National de la 394
Recherche (ANR: www.agence‐nationale‐recherche.fr) through project ANR‐LAVA (ANR Program: 395
DS0902 2016; Project: ANR‐16 CE39‐0009, PI: A. Harris, Link: www.agence‐nationale‐ 396
recherche.fr/?Project=ANR‐16‐CE39‐0009; https://sites.google.com/view/anrlava/). We would like 397
to thank the Sentinel‐1 ESA team, especially P. Potin and Y.‐L. Desnos for having made possible 398
routine Sentinel‐1 StripMap acquisition on La Réunion Island. This is ANR‐LAVA contribution no. 5 399 and IPGP contribution no. XXX. 400 401 References 402 Favalli M, Pareschi MT, Neri A, Isola I (2005) Forecasting lava flow paths by a stochastic approach. 403 Geophys Res Lett, 32(L03305). doi: 10.1029/2004GL021718 404 Flynn LP, Mouginis‐Mark PJ (1994) Temperature measurements of an active lava channel from 405 spectral measurements, Kilauea Volcano, Hawaii. Bulletin of Volcanology, 56, 297‐301 406 Harris AJL, Rowland SK (2001) FLOWGO: a kinematic thermo‐rheological model for lava flowing in a 407 channel. Bull Volcanol, 63, 20–44. doi:10.1007/s004450000120. 408 Harris AJL, Baloga SM (2009) Lava discharge rates from satellite‐measured heat flux. Geophys. Res. 409 Lett., 36, L19302. doi:10.1029/2009GL039717 410 Harris AJL, Rowland SK (2015) FLOWGO 2012: an updated framework for thermorheological 411 simulations of channel‐contained lava. In: Carey, R., Cayol, V., Poland, M., Weis, D. (Eds.), 412
Hawaiian Volcanoes: from Source to Surface, Geophysical Monograph, vol. 208. American 413 Geophysical Union, 457–481 414 Harris AJL, Blake S, Rothery DA, Stevens NF (1997) A chronology of the 1991 to 1993 Etna eruption 415 using AVHRR data: Implications for real time thermal volcano monitoring, J. Geophys. Res., 416 102(B4), 7985–8003. doi:10.1029/96JB03388 417 Harris AJL, Dehn J, Calvari S (2007) Lava effusion rate definition and measurement: a review. Bull 418 Volcanol, 70, 1–22 419 Harris A, Rhéty M, Gurioli L, Villeneuve N, Paris R. (2016) Simulating the thermorheological evolution 420 of channel‐contained lava: FLOWGO and its implementation in EXCEL. In: Harris AJL, De Groeve T, 421 Garel F, Carn SA, editors. Detecting, modelling and responding to effusive eruptions, vol. 426. 422 London: Geological Society, London Special Publication, 313–36. doi:10.1144/SP426.9. 423 Barberi F, Carapezz ML, Valenza M, Villari L (1993) The control of lava flow during the 1991–1992 424 eruption of Mt. Etna. Journal of Volcanology and Geothermal Research, 56(1–2), 1‐34. 425 Blackett M (2015) An initial comparison of the thermal anomaly detection products of MODIS and 426 VIIRS in their observation of Indonesian volcanic activity. Remote Sensing of Environment, 171, 427 75‐82 428 Cappello A, Ganci G, Bilotta G, Herault A, Zago V, Del Negro C (2018) Satellite‐driven modeling 429 approach for monitoring lava flow hazards during the 2017 Etna eruption. Annals of Geophysics, 430 61, Doi:10.4401/ag‐7792 431 Chevrel MO, Labroquère J, Harris AJL, Rowland SK (2018) PyFLOWGO: An open‐source platform for 432 simulation of channelized lava thermo‐rheological properties. Computers & Geosciences, 111, 433 167–180 434 Coppola D, James MR, Staudacher T, Cigolini C (2010) A comparison of field‐ and satellite‐derived 435 thermal flux at Piton de la Fournaise: implications for the calculation of lava discharge rate. Bull 436 Volcanol., 72(3), 341–56. doi:10.1007/s00445‐009‐0320‐8 437 Coppola D, Laiolo M, Cigolini C, Delle Donne D, Ripepe M (2016) Enhanced volcanic hot‐spot 438 detection using MODIS IR data: results from the MIROVA system. In: Harris AJL, De Groeve T, 439 Garel F, Carn SA, editors. Detecting, Modelling and responding to effusive eruptions, vol. 426. 440 London: Geological Society, London, Special Publications, 181–205. 441 http://doi.org/10.1144/SP426.5. 442 Crisci G, Di Gregorio S, Rongo R, Scarpelli M, Spataro W, Calvari S (2003) Revisiting the 1669 Etnean 443 eruptive crisis using a cellular automata model and implications for volcanic hazard in the Catania 444 area. Journal of Volcanology and Geothermal Research, 123, 211‐230. 445 Flynn LP, Mouginis‐Mark PJ, Horton KA (1994) Distribution of thermal areas on an active lava flow 446 field: Landsat observations of Kilauea, Hawaii, July 1991. Bull. Volcanol., 56, 284‐296. 447 Ganci G, Bilotta G, Cappello A, Herault A, Del Negro C (2016) HOTSAT: a multiplatform system for the 448 thermal monitoring of volcanic activity using satellite data. In Harris, A. J. L., De Groeve, T., Garel, 449
F. & Carn, S. A. (eds) 2016. Detecting, Modelling and Responding to Effusive Eruptions. Geological 450 Society, London, Special Publications, 426, 207–221. First published online October 29, 2015, 451 http://doi.org/10.1144/SP426.21 452 Lombardo V, Harris AJL, Calvari S, Buongiono MF (2009) Spatial variations in lava flow field thermal 453 structure and effusion rate derived from very high spatial resolution hyperspectal (MIVIS) data. J. 454 Geophys. Res., 114, B02208. doi:10/1029.2008JB005648 455 Lu Z, Fielding E, Patrick MR, Trautwein CM (2003) Estimating lava volume by precision combination of 456 multiple baseline spaceborne and airborne interferometric synthetic aperture radar: The 1997 457 eruption of Okmok volcano, Alaska. IEEE Transactions on Geoscience and Remote Sensing ,41(6), 458 I428‐I436. 459 MacKay ME, Rowland SK, Mouginis‐Mark PJ, Gareil H (1998) Thick lava flows of Karisimbi volcano, 460 Rwanda: insights from SIR‐C interferometric topography. Bull. Volcanol., 60, 239‐251. 461 Patrick MR, Dehn J, Papp KR, Lu Z, Dean K, Moxey L, Izbekov P, Guritz R (2003) The 1997 eruption of 462 Okmok Volcano, Alaska: a synthesis of remotely sensed imagery. J Volcanol Geotherm Res, 127, 463 87–105 464 Peltier A (2018) Bulletin du 27 avril 2018 – 20:30 heure locale Observatoire Volcanologique du Piton 465 de la Fournaise. Bulletin of the Observatoire Volcanologique du Piton de la Fournaise, 27 April 466 2018, OVPF_20180427_20h30‐ ISSN 2610‐5101. 467 Ramsey M (2016) Enhanced volcanic hot‐spot detection using MODIS IR data: results from the 468 MIROVA system. In: Harris AJL, De Groeve T, Garel F, Carn SA, editors. Detecting, Modelling and 469 responding to effusive eruptions, vol. 426. London: Geological Society, London, Special 470 Publications, 181–205. http://doi.org/10.1144/SP426.5. 471 Rhéty M, Harris A, Villeneuve N, Gurioli L, Médard E, Chevrel O, Bachélery P (2017) A comparison of 472 cooling‐limited and volume‐limited flow systems: Examples from channels in the Piton de la 473 Fournaise April 2007 lava‐flow field, Geochem. Geophys. Geosyst., 18, 474 doi:10.1002/2017GC006839. 475 Rowland SK, MacKay ME, Garbeil H, Mouginis‐Mark PJ (1999) Topographic analyses of Kilauea 476 volcano, Hawaii, from interferometric airborne radar. Bull. Volcanol., 61, 1‐14. 477 Rowland SK, Harris AJL, Wooster MJ, Amelung F, Garbeil H, Wilson L, Mouginis‐Mark PJ (2003) 478 Volumetric characteristics of lava flows from interferometric radar and multispectral satellite 479 data: the 1995 Fernandina and 1998 Cerro Azul eruptions in western Galápagos. Bull. Volcanol., 480 65, 311‐330. 481 Rowland SK, Garbeil H, Harris A (2005) Lengths and hazards from channel‐fed lava flows on Mauna 482 Loa, Hawai’i, determined from thermal and downslope modeling with FLOWGO. Bull. Volcanol., 483 67, 634–647. 484 Stevens NF (2002) Emplacement of the large andesitic lava flow in the Oturere Stream valley, 485 Tongariro Volcano, from airborne interferometric radar. New Zealand Journal of Geology and 486 Geophysics, 45, 387‐394. 487
Vicari A, Herault A, Del Negro C, Coltelli M, Marsella M, Proietti C (2007) Modeling of the 2001 lava 488 flow at Etna volcano by a Cellular Automata approach. Environmental Modelling and Software, 489 22, 1464‐1471. 490 Vicari A, Ganci G, Behncke B, Cappello A, Neri M, Del Negro (2011) Near‐real‐time forecasting of lava 491 flow hazards during the 12–13 January 2011 Etna eruption. Geophysical Research Letters, 38, 492 L13317. http://doi.org/10.1029/2011GL047545 493 Villeneuve N, Neuville DR, Boivin P, Bachèlery P, Richet P (2008) Magma crystallization and viscosity: 494 a study of molten basalts from the Piton de la Fournaise volcano (La Réunion island). Chemical 495 Geology, 256, 242–251 496 Wright R, Rothery DA, Blake S, Pieri DC (2000) Visualizing active volcanism with high spatial 497 resolution satellite data: the 1991–1993 eruption of Mount Etna. Bull. Volcanol., 62, 256–265 498 Wright R, Carn SA, Flynn LP (2005) A satellite chronology of the May–June 2003 eruption of Anatahan 499 volcano. Journal of Volcanology and Geothermal Research, 146, 102‐116. 500 Wright R, Garbeil H, Harris AJL (2008) Using infrared satellite data to drive a 501 thermorheological/stochastic lava flow emplacement model: A method for near‐real‐time 502 volcanic hazard assessment. Geophys Res Lett., 35(L19307). doi:10.1029/2008GL035228 503 Zakšek K, Hort M, Lorenz E (2015) Satellite and Ground Based Thermal Observation of the 2014 504 Effusive Eruption at Stromboli Volcano. Remote Sens., 7, 17190‐17211. 505 Zebker HA, Rosen P, Hensley S, Mouginis‐Mark PJ (1996) Analysis of active lava flows on Kilauea 506 volcano, Hawaii, using SIR‐C radar correlation measurements. Geology, 24(6), 495‐498. 507
Zhukov B, Lorenz E, Oertel D, Wooster M, Roberts G (2006) Spaceborne detection and 508
characterization of fires during the bi‐spectral infrared detection (BIRD) experimental small 509 satellite mission (2001‐2004). Remote Sens. Environ., 100, 29–51 510 Young P, Wadge G (1990). FLOWFRONT: Simulation of a lava flow. Computers and Geosciences, 16, 511 1171‐1191. 512 513
Figure Captions 514
Figure 1. Location of the vent for the April–May 2018 eruption on the Dolomieu cone overlain on 515
Google Earth with (a) MODIS, (b) ASTER and (c) thermal camera mosaic of the hot spots 516 associated with active lava flow on 4 May overlain. Yellow outline in (c) gives the limit of the flow 517 field as mapped using hand‐held GPS. 518 Figure 2. Flow chart giving the call‐down and reporting procedure, as well as flow of source terms, 519 between each model. 520 Figure 3. DOWNFLOW inundation area for a 10000 iterations from the initial vent location with DEM 521
noise (Dh) of 0.8 m (light blue) and 2.5 m (dark blue), with the line of steepest descent in red. 522
Yellow stars give the distance down the LoSD FLOWGO runs at each generic effusion rate 523 (numbers are in m3/s). These are the “effusion rate contours” for this eruption. 524 Figure 4. Distance down the LoSD (red line) that FLOWGO will run at the given effusion rates, these 525 being the numbers (in m3/s) next to each star. Runs are given from (a) the initial vent location of 526
28 April, and (b) the tube exit on 9 May. Overlain are the limits of the flow field defined from 527
InSAR incoherence (blue outline) and field mapping (yellow outline) on the same dates. 528 Background shows the DOWNFLOW inundation area. 529 Figure 5. Time‐series of InSAR incoherence images with lava flow field outlined in blue. 530 Figure 6. Time‐series of ASTER TIR images with active flows apparent as elongate thermal anomalies 531
(higher pixel‐integrated temperatures give lighter tones: white are the hottest pixels, and black 532 are the coldest). Note how the highest intensities in the thermal anomaly move down flow with 533 time, and effect of lava tube extension. 534 Figure 7. MIROVA‐derived TADR and cumulative volume. 535 Figure 8. Comparison of ASTER thermal anomaly, InSAR incoherence and FLOWGO run outs for (a) 4 536 May (FLOWGO run from the initial vent location) and (b) 9 May (FLOWGO run from the tube exit 537 along the new path, yellow line). 538 539
(a) MODIS 04 May 2018 06:30 UTC
(b) ASTER 04 May 2018 06:30 UTC
(c) FLIR 04 May 2018 08:19 UTC
Main Vent
Main Vent
Breakout S
Breakout N
N
N
N
3 km
Dolomieu
crater
Dolomieu
crater
Main Vent
1 km
100 m
Observatory
MIROVA
ASTER URP
R E P O R T I N G F O R M
InSAR
PyFLOWGO
Trigger email
(Alert Level 1)
TADR
Vent coordinates;
15-90 m ASTER
hot spot maps
TADR;
vent coodinates
Flow run-out;
Flow line maps;
Flow length maps
Flow length;
Flow area;
Flow area maps
DOWNFLOW
Routine data
collection
;
Vent coordinates
Validation:
flow lengths,
locations & areas
obtained from
UAV surveys
and SO2 flux
7 6 4 6 0 0 0 7 6 4 8 0 0 0 7 6 5 0 0 0 0 364000 366000 7 6 4 6 0 0 0 7 6 4 8 0 0 0 7 6 5 0 0 0 0 364000 366000 7 6 4 6 0 0 0 7 6 4 8 0 0 0 7 6 5 0 0 0 0 364000 366000 7 6 4 6 0 0 0 7 6 4 8 0 0 0 7 6 5 0 0 0 0 364000 366000 7 6 4 6 0 0 0 7 6 4 8 0 0 0 7 6 5 0 0 0 0 364000 366000 7 6 4 6 0 0 0 7 6 4 8 0 0 0 7 6 5 0 0 0 0 364000 366000
a)
0 0.5 1 kmb)
c)
0
d)
e)
0 0.5 1 kmCoherence
S1B_SM_151_04-16-2018-04-28-2018f)
1
0 0.5 1 km0.5
0 0.5 1 km0.25
0 0.5 1 km 0 0.5 1 km S1A_IW_144_01-03-2018-05-03-20180.75
S1B_SM_151_04-16-2018-05-10-2018 S1A_IW_151_05-04-2018-05-16-2018 S1B_SM_144_04-03-2018-06-02-2018 S1B_SM_144_04-03-2018-06-26-20187 6 4 6 0 0 0 7 6 4 8 0 0 0 7 6 5 0 0 0 0 364000 366000 7 6 4 6 0 0 0 7 6 4 8 0 0 0 7 6 5 0 0 0 0 364000 366000 7 6 4 6 0 0 0 7 6 4 8 0 0 0 7 6 5 0 0 0 0 364000 366000 7 6 4 6 0 0 0 7 6 4 8 0 0 0 7 6 5 0 0 0 0 364000 366000 7 6 4 6 0 0 0 7 6 4 8 0 0 0 7 6 5 0 0 0 0 364000 366000 7 6 4 6 0 0 0 7 6 4 8 0 0 0 7 6 5 0 0 0 0 364000 366000
a)
0 0.5 1 kmb)
c)
Cold
d)
e)
0 0.5 1 kmTemperature
ASTER TIR image 02 May 2018
f)
Hot
0 0.5 1 km 0 0.5 1 km
0 0.5 1 km 0 0.5 1 km
ASTER TIR image 04 May 2018
ASTER TIR image 09 May 2018 ASTER TIR image 25 May 2018
25Apr18
0
02May18
09May18
16May18
23May18
6.25
12.5
18.75
25
TADR (m
3s
−1)
0
2.5
5
7.5
10
Vol (Mm
3)
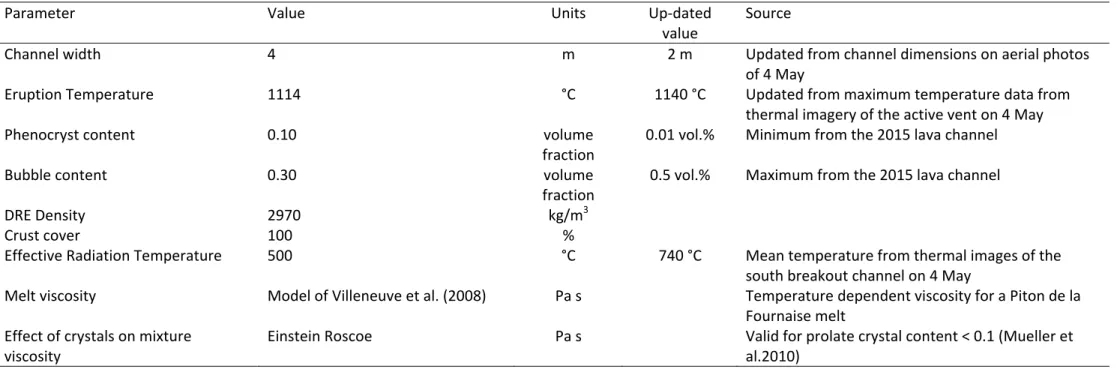
Table 1. Key thermal, textural and rheological source terms used to initialize PyFLOWGO at Piton de la Fournaise as given by Chevrel et al. (2018). These are
based on measurements and best‐fit testing of FLOWGO on lava channels active during the December 2010 eruption of Piton de la Fournaise as described in Harris et al. (2016).
Parameter Value Units Up‐dated
value Source Channel width 4 m 2 m Updated from channel dimensions on aerial photos of 4 May Eruption Temperature 1114 °C 1140 °C Updated from maximum temperature data from thermal imagery of the active vent on 4 May Phenocryst content 0.10 volume fraction 0.01 vol.% Minimum from the 2015 lava channel Bubble content 0.30 volume fraction 0.5 vol.% Maximum from the 2015 lava channel DRE Density 2970 kg/m3 Crust cover 100 % Effective Radiation Temperature 500 °C 740 °C Mean temperature from thermal images of the south breakout channel on 4 May
Melt viscosity Model of Villeneuve et al. (2008) Pa s Temperature dependent viscosity for a Piton de la Fournaise melt
Effect of crystals on mixture viscosity
Einstein Roscoe Pa s Valid for prolate crystal content < 0.1 (Mueller et al.2010)
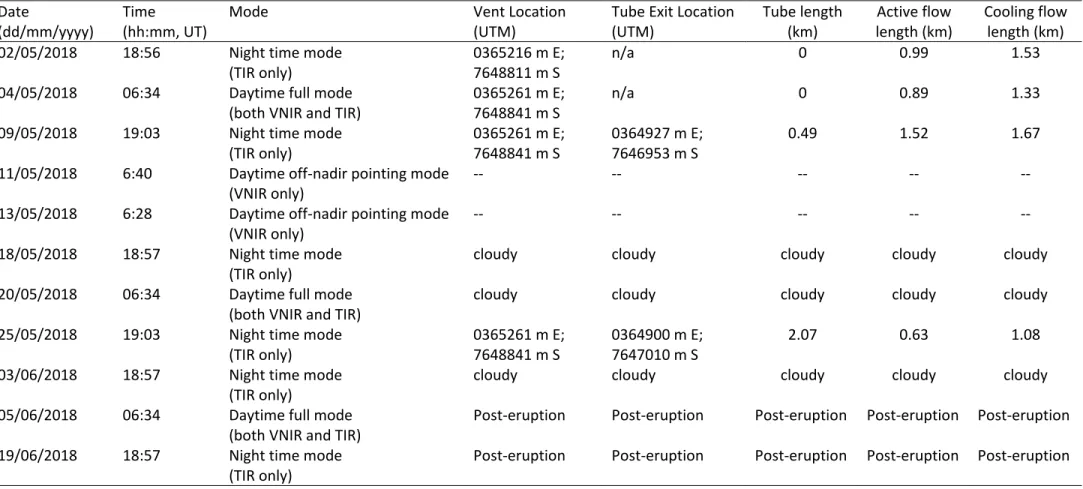
Table 2. Cloud‐free MODIS images processed and TADR delivered during the April‐May 2018 eruption
Date & Time (UT) Satellite TADR (m3/s) Duration Cumulative Volume (× 106 m3)
(dd/mm/yyyy hh:mm) Min. Mid‐point Max. (days) Min. Mid‐point Max.
28/04/2018 09:55 Aqua 11.4 16.3 21.2 0.51 0.47 0.66 0.86 28/04/2018 19:20 Terra 7.8 11.2 14.5 0.90 0.79 1.13 1.47 29/04/2018 21:30 Aqua 3.0 4.3 5.6 1.99 1.30 1.86 2.42 30/04/2018 19:05 Terra 3.7 5.3 6.9 2.89 1.56 2.23 2.90 02/05/2018 22:00 Aqua 2.5 3.6 4.6 5.01 2.13 3.05 3.96 04/05/2018 06:30 Terra 1.8 2.6 3.4 6.36 2.38 3.41 4.43 04/05/2018 18:40 Terra 2.7 3.8 4.9 6.87 2.48 3.55 4.61 04/05/2018 21:50 Aqua 2.8 4.0 5.2 7.00 2.51 3.59 4.67 05/05/2018 10:00 Aqua 1.5 2.1 2.8 7.51 2.61 3.72 4.84 05/05/2018 19:25 Terra 2.1 3.0 3.9 7.90 2.67 3.81 4.95 06/05/2018 06:20 Terra 1.3 1.8 2.4 8.36 2.73 3.91 5.08 06/05/2018 21:35 Aqua 1.1 1.5 2.0 8.99 2.80 4.00 5.20 07/05/2018 09:45 Aqua 1.4 2.0 2.7 9.50 2.85 4.08 5.30 07/05/2018 19:15 Terra 1.1 1.6 2.1 9.90 2.90 4.14 5.38 08/05/2018 06:10 Terra 0.9 1.3 1.7 10.35 2.94 4.19 5.45 08/05/2018 21:25 Aqua 0.6 0.9 1.1 10.99 2.98 4.25 5.53 09/05/2018 06:50 Terra 1.6 2.3 3.1 11.38 3.02 4.31 5.60 09/05/2018 19:00 Terra 2.1 3.0 3.8 11.89 3.10 4.42 5.75 10/05/2018 21:15 Aqua 0.9 1.2 1.6 12.98 3.23 4.62 6.01 11/05/2018 06:40 Terra 0.3 0.4 0.5 13.37 3.25 4.65 6.04 11/05/2018 18:50 Terra 1.0 1.5 1.9 13.88 3.28 4.69 6.10 12/05/2018 10:05 Aqua 0.4 0.6 0.8 14.51 3.32 4.75 6.17 13/05/2018 06:25 Terra 1.1 1.5 2.0 15.36 3.38 4.83 6.27 13/05/2018 18:35 Terra 1.1 1.6 2.1 15.87 3.43 4.89 6.36 13/05/2018 21:45 Aqua 1.0 1.5 1.9 16.00 3.44 4.91 6.39 14/05/2018 09:55 Aqua 1.0 1.4 1.8 16.51 3.48 4.97 6.47
14/05/2018 19:20 Terra 0.8 1.1 1.5 16.90 3.51 5.02 6.52 15/05/2018 06:15 Terra 1.4 2.0 2.6 17.35 3.55 5.08 6.60 15/05/2018 21:30 Aqua 0.9 1.3 1.7 17.99 3.62 5.17 6.72 16/05/2018 06:55 Terra 0.6 0.8 1.1 18.38 3.64 5.21 6.77 16/05/2018 19:05 Terra 0.9 1.3 1.6 18.89 3.68 5.25 6.83 17/05/2018 21:20 Aqua 0.5 0.8 1.0 19.98 3.74 5.35 6.95 19/05/2018 21:05 Aqua 0.4 0.5 0.7 21.97 3.82 5.46 7.10 22/05/2018 21:35 Aqua 0.02 0.03 0.04 24.99 3.88 5.54 7.20 24/05/2018 06:10 Terra 0.02 0.02 0.03 26.35 3.88 5.54 7.20
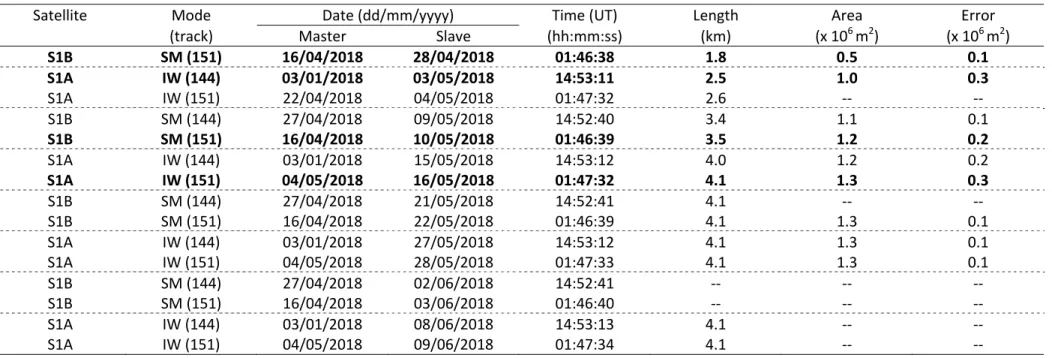
Table 3. InSAR image pairs used to produce coherence maps during the April – May eruption, and the resulting flow lengths and flow field areas. The lines entered in bold are used in the reporting form (Appendix A). Track 144 for ascending pass; 151 for descending pass.
Satellite Mode Date (dd/mm/yyyy) Time (UT) Length Area Error
(track) Master Slave (hh:mm:ss) (km) (x 106 m2) (x 106 m2)
S1B SM (151) 16/04/2018 28/04/2018 01:46:38 1.8 0.5 0.1 S1A IW (144) 03/01/2018 03/05/2018 14:53:11 2.5 1.0 0.3 S1A IW (151) 22/04/2018 04/05/2018 01:47:32 2.6 ‐‐ ‐‐ S1B SM (144) 27/04/2018 09/05/2018 14:52:40 3.4 1.1 0.1 S1B SM (151) 16/04/2018 10/05/2018 01:46:39 3.5 1.2 0.2 S1A IW (144) 03/01/2018 15/05/2018 14:53:12 4.0 1.2 0.2 S1A IW (151) 04/05/2018 16/05/2018 01:47:32 4.1 1.3 0.3 S1B SM (144) 27/04/2018 21/05/2018 14:52:41 4.1 ‐‐ ‐‐ S1B SM (151) 16/04/2018 22/05/2018 01:46:39 4.1 1.3 0.1 S1A IW (144) 03/01/2018 27/05/2018 14:53:12 4.1 1.3 0.1 S1A IW (151) 04/05/2018 28/05/2018 01:47:33 4.1 1.3 0.1 S1B SM (144) 27/04/2018 02/06/2018 14:52:41 ‐‐ ‐‐ ‐‐ S1B SM (151) 16/04/2018 03/06/2018 01:46:40 ‐‐ ‐‐ ‐‐ S1A IW (144) 03/01/2018 08/06/2018 14:53:13 4.1 ‐‐ ‐‐ S1A IW (151) 04/05/2018 09/06/2018 01:47:34 4.1 ‐‐ ‐‐