HAL Id: hal-01493537
https://hal.archives-ouvertes.fr/hal-01493537
Submitted on 12 Apr 2018
HAL is a multi-disciplinary open access
archive for the deposit and dissemination of sci-entific research documents, whether they are pub-lished or not. The documents may come from teaching and research institutions in France or abroad, or from public or private research centers.
L’archive ouverte pluridisciplinaire HAL, est destinée au dépôt et à la diffusion de documents scientifiques de niveau recherche, publiés ou non, émanant des établissements d’enseignement et de recherche français ou étrangers, des laboratoires publics ou privés.
graveolens essential oil by HPLC and absolute
configuration determination by VCD
Mohammed El-Amin Said, Isabelle Bombarda, Jean-Valère Naubron, Pierre
Vanloot, Marion Jean, A Cheriti, Nathalie Dupuy, Christian Roussel
To cite this version:
Mohammed El-Amin Said, Isabelle Bombarda, Jean-Valère Naubron, Pierre Vanloot, Marion Jean,
et al.. Isolation of the major chiral compounds from Bubonium graveolens essential oil by
HPLC and absolute configuration determination by VCD. Chirality, Wiley, 2017, 29 (2), pp.70-79. �10.1002/chir.22672�. �hal-01493537�
R E G U L A R A R T I C L E
Isolation of the major chiral compounds from Bubonium
graveolens essential oil by HPLC and absolute configuration
determination by VCD
Mohammed El
‐Amin Said
1| Isabelle Bombarda
1| Jean
‐Valère Naubron
2| Pierre Vanloot
1|
Marion Jean
3| Abdelkrim Cheriti
4| Nathalie Dupuy
1| Christian Roussel
31Aix
‐Marseille Université, EA4672 LISA Equipe METICA, Marseille, France
2
Aix‐Marseille Université, CNRS FR1739 Spectropole, Marseille, France
3Aix
‐Marseille Université, CNRS, Centrale Marseille, iSm2, Marseille, France
4Phytochemistry and Organic Synthesis
Laboratory, University of Bechar, Bechar, Algeria Correspondence
Mohammed El‐Amin Said, Aix‐Marseille Université, EA4672 LISA Equipe METICA, Case 451, Av. Escadrille Normandie Niémen, 13397 Marseille Cedex 20, France.
Email: mastercompt@hotmail.com
Abstract
The chirality issues in the essential oils (EOs) of leaves and flowers from Bubonium graveolens were addressed by chiral high‐performance liquid chromatography (HPLC) with polarimetric detection and vibrational circular dichroism (VCD). The chemical compositions of the crude oils of three samples were established by gas chromatogra-phy / mass spectrometry (GC/MS). The well‐known cis‐chrysanthenyl acetate (1), oxocyclonerolidol (2), and the recently disclosed cis‐acetyloxychrysanthenyl acetate (3), the three major chiral compounds, were isolated by preparative HPLC. The naturally occurring oxocycloneroledol (2), mostly found in the leaf oil (49.4–55.6%), presents a (+) sign in the mobile phase during HPLC on a chiral stationary phase (CSP) with a Jasco polarimetric detection. The naturally occurring cis‐chrysanthenyl acetate (1) and cis‐acetyloxychrysanthenyl acetate (3), mostly found in the flower EO (35.9–74.9% and 10.0–34.3%, respectively), both present a (−) sign. HPLC on a CSP with polarimetric detection is an unprecedented approach to readily differentiate the flower and leaf EOs according to their chiral signature. The comparison of the experi-mental and calculated VCD spectra of pure isolated 1, 2, and 3 provided their absolute configuration as being (1S,5R,6S)‐(−)‐2,7,7‐trimethylbicyclo[3.1.1]hept‐2‐en‐6‐yl acetate 1, (2R,6R)‐(+)‐6‐ethenyl‐2,6‐dimethyl‐2‐(4‐methylpent‐3‐en‐1‐yl)dihydro‐
2H‐pyran‐3(4H)‐one) 2 and (1S,5R,6R,7S)‐(−)‐7‐(acetyloxy)‐2,6‐
dimethylbicyclo[3.1.1]hept‐2‐en‐6‐yl]methyl acetate 3. Compounds 1, 2, and 3 were already known in B. graveolens but this is the first report of the absolute configuration of (+)‐2 and (−)‐3. The VCD chiral signatures of the crude oils were also recorded.
K E Y WO R D S
Bubonium graveolens, chiroptical HPLC signature, enantiomers, essential oil, vibrational circular dichroism
1 | I N T RO D U C T I O N
Bubonium graveolens (Forsk.) is a species belonging to the Asteraceae family, [synonyms: Bubonium odorum (Schousb.);
Asteriscus graveolens (Forsk.); Asteriscus cavanillesi
(Caball.); Asteriscus paui; Asteriscus stenophyllus (Link.);
Asteriscus stenophyllus; Odontospermum graveolens;
Odontospermum odorum (Schousb.); Nauplius graveolens (Forsk.); Buphthalmum odorum (Schousb.)].1It is a medicinal
plant growing in arid and semiarid climates. It extends from the north of Africa to the desert of Central Asia but it is widely represented in southwest Algeria and southeast Morocco (locally known as Tafss).2 The whole plant (flowers and leaves) is used in Saharan folk medicine for various diseases (bronchitis, gastrointestinal tract complaints, fever, and cephalic pains).3Furthermore, B. graveolens exhibits antibac-terial,4 antioxidant, and antifungal activities.5,6 To our knowledge, the literature dealing with the composition of the
Received: 27 January 2016 Revised: 2 November 2016 Accepted: 7 November 2016 DOI 10.1002/chir.22672
leaf and flower essential oil (EO) is limited to five articles. The first one described the flowering part of B. graveolens from Sinai (Egypt).4Three articles deal with plants from southeast Morocco,3,5,7 and the last one reported on the plant from southwest Algeria.2 In these five publications, the chirality issues, namely, the signs of the optical rotation or the absolute configurations of the major chiral compounds in the EO, were not addressed. Chirality issues are of prime importance, since EOs could be viewed as a sustainable source of valuable optically pure compounds.8High‐performance liquid chroma-tography (HPLC) on a chiral stationary phase (CSP) with polarimetric detection has proven useful to isolate pure enan-tiomers of terpenes from crude EOs without any sample pretreatment.9The comparison of calculated and experimental vibrational circular dichroism (VCD) spectra is a reliable method for the determination of the absolute configuration
of chiral molecules.10–15 Most VCD spectra of natural
products are performed on pure isolated compounds.16–18In line with our ongoing interest in chirality issues in EOs,19we combined the chiral HPLC with a polarimetric detection and the VCD approaches to obtain the sign and the absolute configuration of the major chiral molecules in B. graveolens EOs (leaf and flower).
2 | M AT E R I A L S A N D M E T H O D S
2.1 | Plant material
Samples 1 and 2 of B. graveolens aerial part were collected from the region of Bechar (latitude: 31° 54′ 59″ N; longitude: 2° 18′ 0″ W; altitude: 870 m); sample 3 was collected in the region of Ain Sefra (latitude: 32° 37′ 33″ N; longitude: 0° 24′ 39″ W; altitude: 1238 m) in southwest Algeria during April 2013 and 2014 at the flowering stage. A voucher specimen is deposited at the Herbarium of the POSL Laboratory (University of Bechar, Algeria) under Accession No. CA 00/14. Specimens were then dried in the open air for 15 days and stored in a cool place before extraction.
2.2 | Essential oil extraction
EOs were obtained by hydrodistillation (6 h) from the leaves or flowers (800 g). The EOs were dried over anhydrous sodium sulfate, filtered, and stored in a sealed vial in the dark at 4°C until analysis.
2.3 | Gas chromatography / mass spectrometry (GC/
MS) analysis
An Agilent Technologies (Palo Alto, CA) GC instrument equipped with a GC 7890A gas chromatograph system, an MS 5975C VL MSD mass spectrometer detector, and an HP‐5MS capillary column from J&W Scientific (Folsom,
CA) (30 m × 0.25 mm; film thickness 0.25 μm) was used.
The data acquisition and processing were performed using
the MSD Chemstation E.01.01.335 (Agilent) software. One μL of diluted EO (0.05 g in 1.5 ml of CH2Cl2) was injected.
The experimental conditions were: solvent delay, 2 min; column temperature program, 2 min at 80°C, then 80 to 200°C (5°C/min), then 200 to 260°C (20°C/min), and held at the final temperature for 5 min; temperature injector (split ratio 60) and detector were 250°C; carrier gas was helium at a flow rate of 1.2 ml/min; ionization voltage 70 eV; electron multiplier, 1 kV. The identification of the components was based on the comparison of their mass spectra with those of the Wiley and NIST libraries as well as by comparison of their retention indices with those of authentic samples. Oil chemical relative composition was determined by peaks area for compounds contributing more than 0.1% of the total composition.
2.4 | HPLC analysis
The analytical separations were performed on a Lachrom‐Elite unit composed of a L‐2130 pump, a L‐2200 autosampler, a L‐2350 oven, and a L‐2455 DAD‐detector. Semipreparative separations were performed on a Knauer unit with pump, UV detector, and software to collect the different fractions. Chiralpak IA, IE, IB, IC, ID are columns from Chiral Technologies Europe (Illkirch, France). They were installed in a screening unit and a mobile phase composed of a mixture of 2‐PrOH (5% in hexane, v/v) was used for all experiments at 1 mL/min. The separations were monitored with a Jasco (Tokyo, Japan) OR‐1590 online polarimeter detector and UV (220 nm) for test samples.
2.5 | NMR analysis
Nuclear magnetic resonance (NMR) spectra were measured on a Bruker Avance 400 (Billerica, MA) equipped with a
QNP probe. Compounds were dissolved in CDCl3(20 mg
in 0.5 ml of solvent, tube diameter of 5 mm). The1H‐ and
13
C–NMR spectra were recorded at room temperature.
The acquisition time and relaxation delay were set at 5.45 and 2 sec, respectively, the spectral width was 400 MHz,
and the number of scans was set at 32 for 1H–RMN. For
13
C–RMN, the acquisition time and relaxation delay were
set at 1.82 and 2 sec, respectively, the spectral width was 100 MHz, and the number of scans was set at 64.
2.6 | IR and VCD spectroscopies
IR and VCD spectra were measured on a Vertex70 Fourier transform infrared spectrometer coupled with a PMA 50
accessory. The VCD spectra were recorded with CaF2
windows with a constant pathlength (200 μm) for 3 h at a resolution of 4 cm−1at room temperature. The concentrations of each sample are presented in Supplementary Table S5. CCl4was selected as the solvent, for best solubility and weak
absorption in the region of interest. Baselines of the VCD and IR spectra were corrected with the solvent spectrum obtained
under the same experimental conditions. Spectra were col-lected in the mid‐IR region, 1800–1050 cm−1. Calculations were performed on all diastereomers that are not enantiomers of chrysanthenyl acetate 1, of oxocyclonerolidol 2, and of acetyloxychrysanthenyl acetate 3. As usual, the VCD spectra were calculated for each populated conformation and the resulting calculated VCD spectra were averaged according to a Boltzmann distribution. The populations of the different conformations can be found for each compound in the Supporting Information. The geometry optimizations, vibra-tional frequencies, IR absorption, and VCD intensities were calculated with Density Functional Theory (DFT) using B3LYP functional combined with 6‐31G(d,p) basis set. The average effects of the solvent (CCl4) were modeled using
the implicit solvation model IEFPCM/SMD.20,21 Computed
harmonic frequencies are generally larger than the fundamen-tals observed experimentally. They were calibrated using a scaling factor of 0.98. IR absorption and VCD spectra were constructed from calculated dipole and rotational strengths assuming Lorentzian band shape with a half‐width at half‐ maximum of 10 cm−1.
2.7 | Isolation of (−)‐cis‐chrysanthenyl acetate (−)‐(1) and (−)‐cis,cis‐acetyloxychrysanthenyl acetate (−)‐(3) (−)‐1 and (−)‐3 were isolated from flower EO of sample 1 using semipreparative Chiralpak IE column (250 × 10 mm), heptane/isopropanol, 90/10 (v/v), 5 mL/min, 130 injections of 100μL every 6 min. The collection was done according to the polarimeter signal. After evaporation of the elution solvent, 260 mg of (1) and 35 mg of (3) were obtained from 400 mg of crude EO and with a GC purity of 95% and 99%, respectively. The recovered amount was consistent with GC analysis of the crude oil (Table 2). Retention factor (k): k(1) = 0.36 and k(3) = 0.96; UV detector:λmax(1) = 213 nm ,λmax(3) = 206 nm;
(90/10 v/v hexane/isopropanol, on Chiralpak IE).
Semipreparative chiral HPLC with polarimetric detection is thus a convenient method to isolate valuable optically pure compounds 1 and 3 from crude essential oil in good yield. In
another experiment, (−)‐3 was isolated from flower EO
(sample 3) by liquid chromatography (LC) over silica gel with heptane/ethyl acetate (80/20, v/v) as eluent. After evaporation of the elution solvent, 74.3 mg of (−)‐(3) (Rf 0.27) was obtained from 328.6 mg of crude EO with a GC purity of 97%. UV detector:λmax= 206 nm. 1: 1H NMR (400 MHz, CDCl3, δ): 0.85 (s, 3H, CH3), 1.43 (dd, J = 16.0, 2.0 Hz,1H, CH), 1.51 (dd, J = 16.0, 2.4 Hz,1H, CH), 1.60 (q, J = 1.9 Hz,3H, CH3), 2.01 (s, 3H, CH3), 2.42 (m, 1H, CH), 3.10 (m, 1H, CH), 4.45 (s, 1H, CH), 5.25–5.26 (m, 1H, CH).13C NMR (100 MHz, CDCl3, δ): 20.99 (C14), 21.17 (C13), 25.69 (C11 + C12), 27.88 (C4), 32.15 (C7), 44.65 (C5), 52.78 (C1), 66.54 (C6), 118.60 (C3), 135.40 (C2), 170.98 (C = O). [α]D25°=−22.3
(c 1.016, CHCl3) for the collected fraction
3: 1H NMR (400 MHz, CDCl3, δ): 1.00 (s,3H, CH3), 1.72–1.73 (m, 3H, CH3), 2.09 (s, 3H, CH3), 2.11 (s, 3H, CH3), 2.32 (dd, J = 16.8, 2.1 Hz, 2H, CH2), 2.34 (dd, J = 2.5, 1.0 Hz, 1H, CH), 2.35 (d, J = 1.0 Hz,1H, CH), ), 4.56 (s, 1H + 2H, CH + CH2), 5.33–5.34 (m, 1H, CH).13C NMR (100 MHz, CDCl3, δ): 17.68 (C15), 21.00 (C18), 21.51 (C16), 22.51 (C17), 31.23 (C4), 40.82 (C6), 41.81 (C5), 48.11 (C1), 70.93 (C11), 79.90 (C7), 118.61 (C3), 140.90 (C2), 170.72 (C = O), 171.42 (C = O). NOESY
experiments confirmed the stereochemical relationship
of the bridge methyl group and acetyloxymethylene.
[α]D25° =−28.6 (c 0.826, CHCl3) for the collected fraction
2.8 | Isolation of (+)‐oxocyclonerolidol (+)‐(2) by LC (+)‐2 was isolated from leaf EO (sample 1) by LC over silica gel with heptane/ethyl acetate (80/20, v/v) as eluent. After
evaporation of the elution solvent, 64.3 mg of (+)‐6‐
oxocyclonerolidol (Rf 0.41) was obtained from 133.2 mg of crude EO and with a GC purity of 91%. UV detector: λmax= 212 nm. 2: 1H NMR (400 MHz, CDCl3,δ): 1.35 (s, 3H, CH3), 1.38 (s, 3H, CH3), 1.59 (s, 3H, CH3), 1.66 (s, 3H, CH3), 1.63–1.77 (ddd, J = 5.0, 11.5, 13.8 Hz, each 2H, CH2), 1.92–1.97 (m, 2H, CH2), 2.05–2.15 (ddd, J = 14.1, 10.5, 5.3 Hz, J = 14.1, 5.3, 5.0 Hz, 2H, CH2), 2.41–2.45 (ddd, J = 5.0, 16.4, 5.5 Hz, J = 16.4, 10.4, 5.0 Hz, 2H, CH2), 5.12 (t, J = 1.3 Hz, 1H, CH), 5.21–5.43 (dd, J = 1.3, 10.6 Hz, J = 1.3, 16.9 Hz, 2H, CH2), 5.94 (dd, J = 10.7, 17.0 Hz, 1H, CH). 13C NMR (100 MHz, CDCl3, δ): 17.4 (C11), 22.20 (C8), 25.55 (C17), 26.00 (C12), 28.80 (C16), 33.70 (C5), 35.20 (C4), 40.10 (C7), 73.60 (C6), 79.20 (C2), 112.40 (C15), 121.90 (C9), 128.00 (C10), 144.70 (C14), 212.00 (C = O). [α]D25°= +40.8 (c 0.26, CHCl3) 3 | R E S U LT S A N D D I S C U S S I O N
3.1 | Chemical composition of the leaf and flower EOs
of B. graveolens
The oil yields for the three samples analyzed in this study
were 0.13–0.15 w/w % for leaf and 0.32–0.47 w/w % for
flower (see Supporting Table S1). The chemical composi-tions of B. graveolens EOs (leaf and flower) were
investi-gated using GC and GC/MS. Thirty‐three compounds,
which represented between 93.3% to 98.5% of the total oil composition, were identified using retention indices (RIs) and by comparison of their mass spectral data with those of a commercial library (see Supporting Table S2). Oxocyclonerolidol 2 and the recently disclosed cis,cis‐ acetyloxychrysanthenyl acetate 3, not present in commercial libraries, were isolated by LC and preparative chiral HPLC. Their 1D‐ and 2D–NMR were in agreement with the already reported NMR spectra for these compounds.3
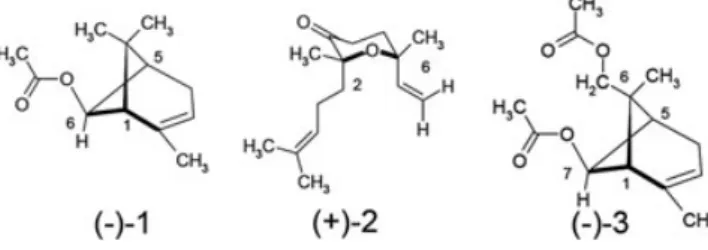
The three major compounds were oxygenated terpenes (Figure 1) and noticeable differences were observed between leaf and flower EOs.
The oils obtained from the leaves were characterized by two major compounds: oxocyclonerolidol 2 (49.4 to 55.6%) and cis‐chrysanthenyl acetate 1 (9.6–16.3%) depending on the sample. The EOs obtained from the flowers were charac-terized by a high amount of cis‐chrysanthenyl acetate 1
(35.9–74.8%) and cis‐acetyloxychrysanthenyl acetate 3
(10.1–34.3%) depending on the sample. It is worth noting that the chiral compounds represent between 92.1% to 96.7% of the total composition for the three investigated samples. The chemical compositions of leaf EOs are in agreement with those previously reported by Cristofari et al.3 for B. graveolens from southeast Morocco in which compound 2 (74.9%) was the major constituent. For flower EO, compounds 1 and 3 were reported by Cristofari et al.3 as the two main compounds (13.4 and 48.5%, respectively). In contrast to the Cristofari et al.’s EOs, the samples of Algerian origin from the region of Bechar (samples 1 and 2) have a higher content of 1 (from 54 to 74.8%) than the con-tent of 3 (from 10.0–13.3%). Interestingly, compounds 1 and
3 are found in similar amounts (~35%) in sample 3 from
the region of Ain Sefra. As stated in the introduction, few other previous studies deal with the chemical tion of B. graveolens and the reported chemical composi-tions in these previous studies are basically different from those of our samples and Cristofari et al.’s samples. A first report dealt with the flowering part of B. graveolens col-lected in the Sinai.4 According to the available abstract on the publication site,4the“major” identified components were 2‐(2‐keto‐4‐methylcyclohexyl)‐6,7‐dimethyl‐5‐hydroxy‐3,5‐ octadiene (8.62%) and L‐carveol (6.07%). A second study reported the chemical composition of EOs obtained from the leaves and flowers collected in southwest Algeria. The
major identified compounds were 2,6‐dimethyl‐1,6‐
heptadien‐4‐yl acetate (19.4%), trans‐chrysanthenyl acetate (18.7%), eucalyptol (16.5%), and δ‐cadinol (13.9%) in the flower EO and eucalyptol (21.5%), δ‐cadinol (19.1%), and
δ‐cadinene (12.4%) in the leaf EO.2
2,6‐Dimethyl‐1,6‐ heptadien‐4‐yl acetate, trans‐chrysanthenyl acetate and δ‐ cadinene were considered as sensors to distinguish flower
EO from leaf EO. These last results are intriguingly very dif-ferent from those of our samples, despite that the samples are from the same geographical origin.
In summary, three main compounds, 1, 2, and 3, are by far the main constituents of our samples in accordance with Cristofari et al.’s report, even though sharp differences were noticed in the relative composition. Noteworthy, leaf and flower EOs present drastic differences in their main chiral constituents: oxycyclonerolidol 2 is the main chiral
com-pound of leaf EO together with a small amount of cis‐
chrysanthenyl acetate 1. while cis‐chrysanthenyl acetate 1 is the main chiral constituent of flower EO together with a var-iable amount of cis,cis‐acetyloxychrysanthenyl acetate 3, depending on the sample origin. The chirality issues, which have up to now been ignored, deserve further characterization for these three major compounds.
3.2 | Chiral signature of crude EOs by chiral HPLC
with online polarimetric detection
The crude flower and leaf EOs of samples 1, 2, and 3 were analyzed by HPLC on CSP using UV and polarimetric detec-tion. The HPLC on Chiralpak IE using UV detection pro-vided the respective signatures for the flower and leaf EOs (Figure 2).
The HPLC chromatograms on Chiralpak IE, using UV detection, were quite similar for leaf and flower Eos, but even so the GC chemical composition indicated a sharp differenti-ation based on the amount of cis‐chrysanthenyl acetate 1 and oxocyclonerolidol 2 for these two EOs. Quite unexpectedly for a CSP in which molecular recognition is at the origin of the separation, two structurally different compounds such as 1 and 2 coeluted using a classical mixture 95:5 hexane/2‐ PrOH as eluent.
Pleasantly, on line of chiroptical detection allowed a clear differentiation of the two chromatograms (Figure 3): polarimetric detection showed that the major 2 enantiomer is (+) in the leaf oil and the major 1 enantiomer is (−) in the flower EO.
These signs were acquired in the mobile phase with a Jasco 1590 online polarimeter that weighs the deviations at several wavelengths between 350 and 900 nm.22To our sur-prise, compounds 1 and 2 were, as well, not separated on Chiralpak IA, IB, IC, and ID; polarimetric detection was again the unique tool to distinguish 1 from 2. The Supple-mentary Information provides an overlay of the leaf and flower crude EO chromatograms with polarimetric detection on IA, IB, IC, and ID columns.
Chiral HPLC has been used for the separation of mole-cules to assign their absolute configuration using the VCD.23,24
The HPLC chromatogram on a CSP with a polarimetric detection provided for the first time a chiral signature for the flower and leave EOs.
FIGURE 1 Chemical structures of the three major chiral compounds (−)‐1, (+)‐2, and (−)‐3 isolated from B. graveolens essential oils (leaf or flower). Note: the molecules are displayed with the absolute configuration determined in this work
3.3 | Absolute configuration of (−)‐cis‐chrysanthenyl acetate 1, (+)‐oxocyclonerolidol (2) and (−)‐cis,cis‐
acetyloxychrysanthenyl acetate(3) by VCD
3.3.1 | (−)‐cis‐chrysanthenyl acetate (1)
The absolute configuration of (−)‐cis‐chrysanthenyl acetate 1 [(1S,5R,6S)‐(−)‐2,7,7‐trimethylbicyclo[3.1.1]hept‐2‐en‐6‐yl acetate] was established in the 1970s by a chemical
correla-tion method on a sample isolated from Centipeda
cunninghamii EO.25
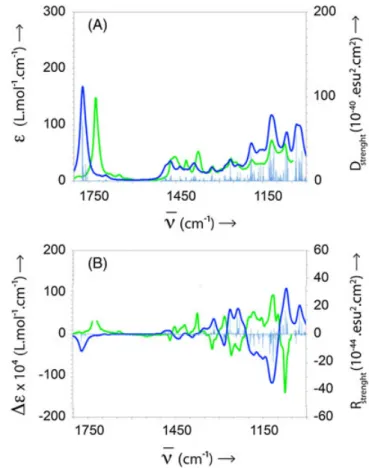
IR and VCD spectra of (−)‐cis‐chrysanthenyl acetate
were recorded in CCl4 in the region 1050–1800 cm−1.
(Figure 4, green line) Calculations were performed for each significantly populated conformation of one enantiomer of cis‐chrysanthenyl acetate [(1R,5S,6R)‐2,7,7‐trimethylbicyclo [3.1.1]hept‐2‐en‐6‐yl acetate] and one enantiomer of trans‐ chrysanthenyl acetate [(1R,5S,6S)‐2,7,7‐trimethylbicyclo [3.1.1]hept‐2‐en‐6‐yl acetate].
The averaged calculated IR and VCD spectra are reported in Figure 4 for (1R,5S,6R)‐2,7,7‐trimethylbicyclo[3.1.1]hept‐ 2‐en‐6‐yl acetate enantiomer (Figure 4, blue line). Compari-son of the experimental and calculated spectra (blue vs. green line) shows a reasonable mirror image relationship between
the experimental and calculated spectra. Comparison
between the averaged calculated trans‐chrysanthenyl acetate spectra and the experimental one is very poor (see Supporting Information). It can be concluded that (−)‐cis‐chrysanthenyl acetate is [(1S,5R,6S)‐(−)‐2,7,7‐trimethylbicyclo[3.1.1]hept‐
2‐en‐6‐yl acetate], in agreement with the previous
assignment.25
3.3.2 | (+)‐oxocyclonerolidol (2)
The experimental IR and VCD spectra of pure (+)‐
oxocyclonerolidol 2 are reported in Figure 5A. (Note that Cristofari et al. named 2 as 6‐oxocyclonerolidol, while the ketone is in position 3 according to the ACD ChemSketch name: (2R,6R)‐6‐ethenyl‐2,6‐dimethyl‐2‐(4‐methylpent‐3‐
en‐1‐yl)dihydro‐2H‐pyran‐3(4H)‐one.) Calculations were
performed for one enantiomer of each of the diastereomers. The averaged calculated IR and VCD spectra for (2S,6S)‐ oxocyclonerolidol are reported in Figure 5B. The fitting of the calculated and experimental IR spectra is good. The
FIGURE 3 HPLC chromatograms on Chiralpak IE (250 × 4.6 mm) of leaf and flower crude EOs of sample 1 with a polarimetric detection (95/5 v/v hexane/isopropanol, 1 mL/min, 25°C, Jasco OR‐1590). A: Nonretained chiral molecules. B: (+)‐oxocyclonerolidol 2 (top) and (−)‐cis‐chrysanthenyl acetate 1 (bottom). C (−)‐cis,cis‐acetyloxychrysanthenyl acetate 3
FIGURE 2 HPLC chromatograms on Chiralpak IE (250 × 4.6 mm) of leaf and flower crude EOs of sample 1 with UV detection (95/5 v/v hexane/ isopropanol, 1 mL/min, 25°C, UV 220 nm). A: Nonretained chiral molecules. B: (+)‐ oxocyclonerolidol 2 and (−)‐cis‐chrysanthenyl acetate 1. C: (−)‐cis,cis‐acetyloxychrysanthenyl acetate 3
calculated and experimental VCD spectra clearly show a nice enantiomeric relationship.
The fitting with the other diastereomer is unambiguously poorer (see Supporting Information) The absolute configura-tion of (+)‐oxocyclonerolidol can thus be safely assigned for
the first time as being (2R,6R)‐(+)‐oxocyclonerolidol
((2R,6R)‐(+)‐6‐ethenyl‐2,6‐dimethyl‐2‐(4‐methylpent‐3‐en‐ 1‐yl)dihydro‐2H‐pyran‐3(4H)‐one).
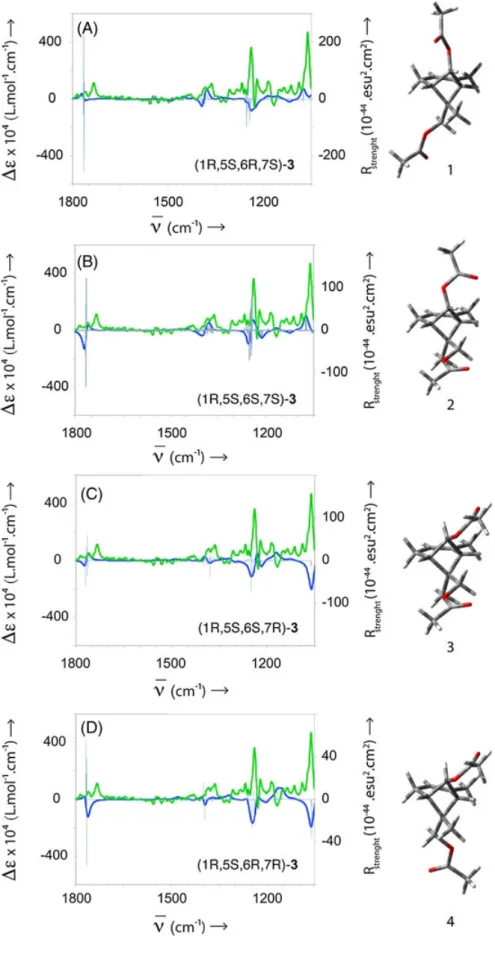
3.3.3 | (−)‐acetyloxychrysanthenyl acetate (3)
The experimental VCD spectrum of (−)‐3 is reported in
Figure 6.
Calculations were performed for each significantly popu-lated conformation of the four diastereomers (1R,5S,6R,7S), (1R,5S,6S,7R), (1R,5S,6R,7R), and (1R,5S,6S,7S) of 3, which are not enantiomers and describe the cis trans stereochemical relationship in positions 6 and 7 while positions 1 and 5 were chosen as being (1R,5S). The four averaged calculated VCD spectra are reported in Figure 6. It turned out that VCD clearly differentiates the cis‐trans relationship for the acetyloxy group bound to the cyclobutane ring, and thus the structures 1 and 2 can be eliminated. However, the cis‐ trans stereochemical relationship for the acetyloxymethylene
group is not obvious when one compares the calculated VCD spectra for structures 3 and 4. Both calculated VCD spectra for diastereomers 3 and 4 are consistent with the opposite configuration of the experimental one, but the actual configuration of the carbon bearing a methyl group and an acetyloxymethylene group cannot be safely assigned from these calculations. ECD experiments were performed in n‐hexane; however, here again the calculated spectra for 3 and 4 are consistent with the opposite configuration of the calculated one but, the ECD are not sufficiently different to make a distinction between 3 and 4 by that technique (data not shown).
The stereochemical relationship at carbon 6 was proposed by Cristofari et al. according to NOESY experiments, which were unfortunately not reported in the original article. NOESY experiments were again performed on our pure iso-lated compound and they confirm without doubt a cis
rela-tionship between the 6‐methyl group and the 2‐methyl
group. (see Supporting Information). In particular, a strong correlation is found between the protons of methyl group (δ = 1 ppm) and the facing proton (δ = 5.34 ppm) of the dou-ble bond. Diastereomers 1 and 4 can thus be eliminated and it follows that the actual stereoisomer is 3.
FIGURE 4 A, IR measured spectrum of (−)‐cis‐chrysanthenyl acetate 1 (green). Averaged calculated VCD spectrum of (1R,5S,6R)‐1 (dark blue). The light blue spectrum is the corresponding calculated dipolar strength. B, Measured VCD spectrum of (−)‐1 (green). Averaged calculated VCD spectrum of (1R,5S,6R)‐1 (dark blue). The light blue spectrum is the corresponding calculated rotational strength
FIGURE 5 A, IR measured spectrum of (+)‐oxocyclonerolidol 2 (green). Averaged calculated VCD spectrum of (2S,6S)‐2 (dark blue). The light blue spectrum is the corresponding calculated dipolar strength. B, VCD measured spectrum of (+)‐2 (green). Averaged calculated VCD spectrum of (2S,6S)‐2 (dark blue). The light blue spectrum is the corresponding calculated rotational strength
Thus, (−)‐acetyloxychrysanthenyl acetate 3 is (1S,5R,6R,7S)‐(−)‐7‐(acetyloxy)‐2,6‐dimethylbicyclo[3.1.1] hept‐2‐en‐6‐yl]methyl acetate. Interestingly, the same stereo-chemical relationship (1S,5R) for the bridging carbon atoms
is found in (−)‐1 and (−)‐3. One may envision that in the enantiomer corresponding to (−)‐cis‐chrysanthenyl acetate
1, the methyl group facing the ester is selectively
acetyloxylated to yield optically pure (−)‐3. The same
FIGURE 6 A–D measured VCD spectrum of (−)‐acetyloxychrysanthenyl acetate 3 (green). Averaged calculated VCD spectrum of the four diastereomers of 7‐(acetyloxy)‐2,6‐
dimethylbicyclo[3.1.1]hept‐2‐en‐6‐yl]methyl acetate (dark blue). The light blue spectrum is the corresponding calculated rotational strength
stereochemical relationship (1S,5R) for the bridging carbon atoms in (−)‐1 and (−)‐3 indirectly supports the absolute con-figuration assignments.
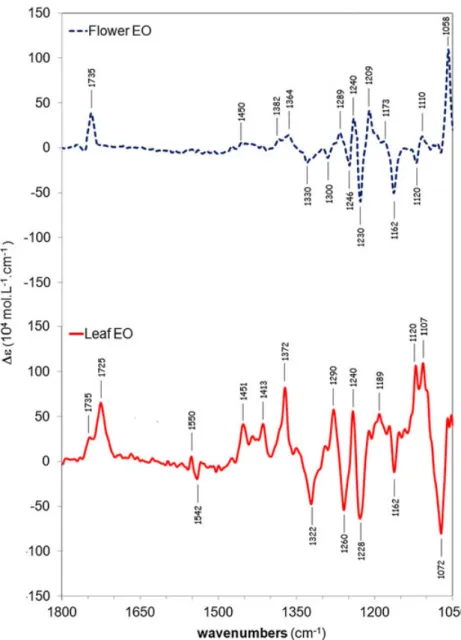
3.4 | VCD signatures of crude leaf and flower EOs
In accordance with the GC results (Supporting Information), the VCD spectra of flower and leaf crude EOs for sample 1 (Figure 7) are very different and present similar profiles as their main compounds: (−)‐cis‐chrysanthenyl acetate ((−)‐1) (Figure 4) for flower EOs and (+)‐oxocyclonerolidol ((+)‐2) (Figure 5) for leaf Eos, respectively.
The VCD spectrum of leaf EO (Figure 7), which are char-acterized by a high content of 2 (49.9 to 55.6%) and 1 (9.6 to 16.3%), showed characteristic bands at 1072, 1120, 1228, 1240, 1260, 1290, 1322, 1372, and 1725 cm−1 attributed to 2and at 1735 cm−1 relative to 1 and 3. On the other hand, the VCD spectrum of flower EO showed typical bands of 1 and 3 (1058, 1162, 1209, 1230, 1240, and 1735 cm−1) which
respectively represented 35.9–74.8% and 10.0–34.9% of the total composition of the flower EOs.
The Pearson correlation coefficients between CD spectra of EOs (leaf and flower, respectively) and major compounds were calculated. A good correlation was obtained between VCD spectra of flower EOs (samples 1, 2, and 3) and VCD
spectrum of (−)‐1 (0.86–0.92 depending on the sample),
indicating that (−)‐1 was the major compound in flower
EOs. Also, strong correlations (0.85–0.89) were founded
between VCD spectrum of (+)‐2 and VCD spectra of leaf
crude EOs depending on the sample, which confirmed that (+)‐2 was the main compound in leaf EOs. A tentative corre-lation between VCD spectrum of (−)‐3 and VCD spectra of flower EOs leads to 0.70–0.78 correlation coefficients. Such a correlation is not valid since most of the (−)‐3 VCD bands are also present in (−)‐1, the correlation between (−)‐1 and (−)‐3 being 0.81.
The composition in major chiral compounds being very different in leaf and flower EOs, the VCD signatures of crude
FIGURE 7 VCD chiral signatures in CCl4of
flower (dark blue) and leaf (red) crude EOs from sample 1
EOs are different and can thus be used to sort flower EO and leaf EOS mostly from the characteristic bands issuing from (−)‐1 or (+)‐2.
4 | C O NC LU S I O N
Three major chiral compounds found in leaf and flower EO of Bubonium graveolens were identified. Interestingly, the leaf and flower EO are very different in terms of major com-pounds. The nature of these isolated compounds is consistent with Cristofari et al.’s study in 2012, with a marked difference in the relative amounts. Our contribution addresses for the first time the chiral issues of these three major natural compounds and provides their absolute configuration by comparison of their VCD spectra with averaged calculated ones.25VCD spec-tra provide two chiral signatures of the crude leaf and flower EOs. Chiral HPLC with polarimetric detection revealed the sign of the optical rotation of the major compounds and can be employed to isolate optically pure (−)‐1, (+)‐2, and (−)‐3. These EOs can be used as a sustainable source of optically pure (1S,5R,6S)‐(−)‐2,7,7‐trimethylbicyclo[3.1.1]hept‐2‐en‐ 6‐yl acetate 1, (2R,6R)‐(+)‐6‐ethenyl‐2,6‐dimethyl‐2‐(4‐ methylpent‐3‐en‐1‐yl)dihydro‐2H‐pyran‐3(4H)‐one) 2, and (1S,5R,6R,7S)‐(−)‐7‐(acetyloxy)‐2,6‐dimethylbicyclo[3.1.1] hept‐2‐en‐6‐yl]methyl acetate 3 for further utilization.
AC K N OW L E D G M E N T S
LPSO (Algeria) is thanked for its collaboration. The Ministry of Higher Education and Scientific Research (Algeria) is thanked for a postgraduate grant (to S.M.). This work was supported by the computing facilities of the CRCMM “Centre Régional de Compétences en Modélisation Moléculaire de Marseille” and chiral chromatography plat-form (Dr N. Vanthuyne) of Aix‐Marseille University.
R E F E R E N C E S
1. Dobignard A, Chatelain C. Index synonymique et bibliographique de la flore d’Afrique du Nord. Switzerland: Éditions des Conservatoire et Jardin botaniques de la Ville de Genève; 2010–2011.
2. Cheriti A, Saad A, Belboukhari N, Ghezali S. The essential oil composition of Bubonium graveolens (Forssk.) Maire from the Algerian Sahara. Flavour Fragr J. 2007;22:286–286.
3. Cristofari G, Znini M, Majidi L, et al. Chemical diversity of essential oils from Asteriscus graveolens (Forssk.) less.: identification of cis‐8‐ Acetyloxychrysanthenyl acetate as a new natural component. Chem Biodivers. 2012;9:727–738.
4. Fahmy HS. Chemical composition and antimicrobial activity of the volatile oil of Nauplius graveolens (Forssk.) Less. J Environ Sci (Mansoura, Egypt). 2003;26:307 It is worth noting that the quotations of that reference in the pre-vious literature were in all cases either erroneous or misspelled. We were not able to access the original article and the abstract CAN140:318011 in Scifinder is poorly instructive. A more detailed abstract from which the reported composition was extracted may be found at the following address:
http://main.eulc.eg/eulc_v5/Libraries/start.aspx?fn=DigitallLibraryViewIssu es&ScopeID=1.1.&Item_id=11787622.29
5. Znini M, Cristofari G, Majidi L, et al. Antifungal activity of essential oil from Asteriscus graveolens against postharvest phytopathogenic fungi in apples. Nat Prod Commun. 2011;6:1763–1768.
6. Alilou H, Asdadi A, Idrissi Hassani LM, Gonzalez‐Mas MC, Amparo Blazquez M, Akssira M. Antifungal and antioxidant activity of Asteriscus graveolens subsp. odorus Essential Oil. J Nat Sci Res. 2014;4:1–10.
7. Znini M, Cristofari G, Majidi L, et al. Green approach to corrosion inhibition of mild steel by essential oil leaves of Asteriscus graveolens (Forsk.) in sulphuric acid medium. Int J Electrochem Sci. 2012;7:3959–3981. 8. Do TKT, Hadji‐Minaglou F, Antoniotti S, Fernandez X. Authenticity of
essential oils. Trends Anal Chem. 2015;66:146–157.
9. El Montassir D, Aamouche A, Vanthuyne N, et al. Attempts to separate (−)‐α‐thujone, (+)‐β‐thujone epimers from camphor enantiomers by enantioselective HPLC with polarimetric detection. J Sep Sci. 2013; 36:832–839.
10. Soloshonok VA, Ono T, Ueki H, et al. Ridge‐tile‐like chiral topology: synthe-sis, resolution, and complete chiroptical characterization of enantiomers of edge‐sharing binuclear square planar complexes of Ni(II) bearing achiral ligands. J Am Chem Soc. 2010;132:10477–10483.
11. Abbate S, Longhi G, Boladjiev S, Lightner DA, Bertucci C, Salvadori P. Analysis of vibrational circular dichroism data in the near infrared and visible range. Enantiomer. 1998;3:337–347.
12. Singh RD, Keiderling TA. Vibrational circular dichroism of six‐membered‐ ring monoterpenes. Consistent force field, fixed partial charge calculations. J Am Chem Soc. 1981;103:2387–2394.
13. Ren J, Li GY, Shen L, Zhang GL, Nafie LA, Zhu HJ. Challenges in the assignment of relative and absolute configurations of complex molecules: computation can resolve conflicts between theory and experiment. Tetrahe-dron. 2013;69:10351–1056.
14. Freedman TB, Cao X, Dukor RK, Nafie LA. Absolute configuration determi-nation of chiral molecules in the solution state using vibrational circular dichroism. Chirality. 2003;15:743–758.
15. Vanthuyne N, Roussel C, Naubron JV, et al. Determination of the absolute configuration of 1,3,5‐triphenyl‐4,5‐dihydropyrazole enantiomers by a com-bination of VCD, ECD measurements, and theoretical calculations. Tetrahedron: Asymmetry. 2011;22:1120–1124.
16. Polavarapu PL. Determination of the structures of chiral natural products using vibrational circular dichroism. In: Berova N, Polavarapu PL, Nakanishi K, Woody RW, eds. Comprehensive Chiroptical Spectroscopy. New York: John Wiley & Sons; 2012:387–420.
17. Felippe LG, Batista JM, Baldoqui DC, et al. VCD to determine absolute con-figuration of natural product molecules: secolignans from Peperomia blanda. Org Biomol Chem. 2012;10:4208–4214.
18. Batista JM Jr, da Silva Bolzani V. In: Atta‐ur‐Rahman. ed. Studies in Natural Products Chemistry. Vol.41 Amsterdam: Elsevier; 2014:383–417. 19. Said MEA, Vanloot P, Bombarda I, et al. Analysis of the major chiral
com-pounds of Artemisia herba‐alba essential oils (EOs) using reconstructed vibrational circular dichroism (VCD) spectra: en route to a VCD chiral signa-ture of EOs. Anal Chim Acta. 2016;903:121–130.
20. Malevich AV, Cramer CJ, Truhlar DG. Universal solvation model based on solute electron density and a continuum model of the solvent defined by the bulk dielectric constant and atomic surface tensions. J Phys Chem B. 2009;113:6378–6396.
21. Vanthuyne N, Roussel C. Chiroptical detectors for the study of unusual phe-nomena in chiral chromatography. Top Curr Chem. 2013;340:107–152. 22. Roussel C, Del Rio A, Pierrot‐Sanders J, Piras P, Vanthuyne N. Chiral liquid
chromatography contribution to the determination of the absolute configura-tion of enantiomers. J Chromatogr A. 2004;1037:311–328.
23. Tur E, Vives G, Rapenne G, et al. HPLC separation and VCD spectroscopy of chiral pyrazoles derived from (5R)‐dihydrocarvone. Tetrahedron: Asymmetry. 2007;18:1911–1917.
24. Pinhey J, Southwell I. Occurrence of (−)‐cis‐chrysanthenyl acetate in Centipeda cunninghamii. Aust J Chem. 1971;24:1311–1313.
25. Joseph‐Nathan P, Gordillo‐Roman B. Vibrational circular dichroism absolute configuration determination of natural products. In: Kinghorn AD, Falk H, Kobayashi J, eds. Progress in the Chemistry of Natural Products. Vol.100 Switzerland: Springer International Publishing; 2015:311–452.
S U P P O RT I N G I N F O R M AT I O N
Additional Supporting Information may be found online in the supporting information tab for this article.
How to cite this article: Said M E‐A, Bombarda I,
Naubron J‐V, Vanloot P, Jean M, Cheriti A, Dupuy
N, Roussel C. Isolation of the major chiral compounds from Bubonium graveolens essential oil by HPLC and absolute configuration determination by VCD. Chirality 2017;29:70–79. doi: 10.1002/chir.22672

![[PDF] Le langage SQL pdf | Cours informatique](data:image/gif;base64,R0lGODlhAQABAIAAAP///wAAACH5BAEAAAAALAAAAAABAAEAAAICRAEAOw==)