HAL Id: hal-02870071
https://hal.archives-ouvertes.fr/hal-02870071
Submitted on 25 Nov 2020HAL is a multi-disciplinary open access
archive for the deposit and dissemination of sci-entific research documents, whether they are pub-lished or not. The documents may come from teaching and research institutions in France or abroad, or from public or private research centers.
L’archive ouverte pluridisciplinaire HAL, est destinée au dépôt et à la diffusion de documents scientifiques de niveau recherche, publiés ou non, émanant des établissements d’enseignement et de recherche français ou étrangers, des laboratoires publics ou privés.
Cryptic speciation in gentoo penguins is driven by
geographic isolation and regional marine conditions:
Unforeseen vulnerabilities to global change
Luis Pertierra, Nicolás Segovia, Daly Noll, Pablo Martinez, Patricio Pliscoff,
Andrés Barbosa, Pedro Aragón, Andrea Raya Rey, Pierre Pistorius, Phil
Trathan, et al.
To cite this version:
Luis Pertierra, Nicolás Segovia, Daly Noll, Pablo Martinez, Patricio Pliscoff, et al.. Cryptic speci-ation in gentoo penguins is driven by geographic isolspeci-ation and regional marine conditions: Unfore-seen vulnerabilities to global change. Diversity and Distributions, Wiley, 2020, 26 (8), pp.958-975. �10.1111/ddi.13072�. �hal-02870071�
Cryptic speciation in gentoo penguins is driven by geographic isolation and regional marine conditions: unforeseen vulnerabilities to global change
Short title: Gentoo penguin speciation and niche diversification
Luis R. Pertierra1, Nicolás I. Segovia2,3, Daly Noll2,19, Pablo A. Martinez4, Patricio
Pliscoff5, Andrés Barbosa1, Pedro Aragón1,6, Andrea Raya Rey7,8,9, Pierre Pistorius10,
Phil Trathan11, Andrea Polanowski12, Francesco Bonnadonna13, Céline Le Bohec14,15,
Ke Bi16, Cynthia Y. Wang-Claypool16, Daniel Gonzalez-Acuña17, Gisele PM Dantas18,
Rauri C. K. Bowie16, Elie Poulin2, Juliana A. Vianna19
1- Museo Nacional de Ciencias Naturales, Departamento de Ecología Evolutiva, CSIC, C/José Gutiérrez Abascal, 2, 28006 Madrid, Spain.
2- Instituto de Ecología y Biodiversidad, Universidad de Chile, Departamento de Ciencias Ecológicas, Santiago, Chile.
3- Universidad Católica del Norte, Facultad de Ciencias del Mar, Departamento de Biología Marina, Coquimbo, Chile.
4- Universidade Federal de Sergipe, PIBi-Lab, Departamento de Ecologia, São Cristóvão, Sergipe, Brazil.
5- Pontificia Universidad Católica de Chile, Departamento de Ecología, Alameda 340, Santiago, Chile.
6- Universidad Complutense de Madrid, Facultad de Ciecias Biológicas, Departamento de Biodiversidad, Ecología y Evolución, Madrid, Spain
7-Centro Austral de Investigaciones Científicas – Consejo Nacional de Investigaciones Científicas y Técnicas (CADIC-CONICET), Bernardo Houssay 200, Ushuaia, Tierra del Fuego, Argentina.
8- Instituto de Ciencias Polares, Ambiente y Recursos Naturales, Universidad Nacional de Tierra del Fuego, Yrigoyen 879, Ushuaia, Argentina.
9- Wildlife Conservation Society, Amenábar 1595, Office 19,C1426AKC CABA, Buenos Aires, Argentina.
10- DST/NRF Centre of Excellence at the Percy FitzPatrick Institute for African
Ornithology, Department of Zoology, Nelson Mandela University, Port Elizabeth, 6031, South Africa.
11-British Antarctic Survey, High Cross, Madingley Road, Cambridge, UK CB3 0ET. 12- Australian Antarctic Division, 203 Channel Highway Kingston, Tasmania 7050, Australia.
13- CEFE UMR 5175, CNRS, Université de Montpellier, Université Paul-Valéry Montpellier, EPHE, 1919 route de Mende, 34293 Montpellier cedex 5, France. 14- Université de Strasbourg, CNRS, IPHC UMR 7178, 23 rue Becquerel, F-67000 Strasbourg, France.
15- Centre Scientifique de Monaco, Département de Biologie Polaire, 8 quai Antoine 1er, MC 98000 Monaco, Principality of Monaco.
16- Museum of Vertebrate Zoology and Department of Integrative Biology, 3101 Valley Life Science Building, University of California, Berkeley, CA 94720, USA.
17- Laboratorio de Parásitos y Enfermedades de Fauna Silvestre, Facultad de Ciencias Veterinarias, Universidad de Concepción Chillán, Chile.
18- Pontificia Universidade Católica de Minas Gerais, PPG in Vertebrate Zoology, Belo Horizonte, Brazil.
19- Pontificia Universidad Católica de Chile, Departamento de Ecosistemas y Medio Ambiente, Vicuña Mackenna 4860, Macul, Santiago, Chile.
Corresponding Author: Juliana A. Vianna, Pontificia Universidad Católica de Chile, Departamento de Ecosistemas y Medio Ambiente, Vicuña Mackenna 4860, Macul, Santiago, Chile, phone number: 56-223547210, jvianna@uc.cl
Abstract
Aim: The conservation of biodiversity is hampered by data deficiencies, with many new
species and subspecies awaiting description or reclassification. Population genomics and ecological niche modeling offer complementary new tools for uncovering functional units of phylogenetic diversity. We hypothesize that phylogenetically delineated lineages of gentoo penguins (Pygoscelis papua) distributed across Antarctica and sub-Antarctic Islands is subject to spatially explicit ecological conditions that have limited gene flow, facilitating genetic differentiation, and thereby speciation processes.
Location: Antarctica and sub-Antarctic area.
Methods: We identify divergent lineages for gentoo penguins using ddRAD-seq and
mtDNA, and generated species distribution models (SDMs) based on terrestrial and marine parameters.
Results: Analyses of our genomic data supports the existence of four major lineages of
gentoo penguin: (i) spanning the sub-Antarctic archipelagos north of the Antarctic Polar Front (APF); (ii) Kerguelen Island; (iii) South America; and (iv) across maritime Antarctic and the Scotia Arc archipelagos. The APF, a major current system around Antarctica, acts as the most important barrier separating regional sister-lineages. Our ecological analyses spanning both the terrestrial (breeding sites) and marine (feeding sites) realms recover limited niche overlap among the major lineages of gentoo penguin. We observe this pattern to correspond more closely with regional differentiation of marine conditions than to terrestrial macro-environmental features.
Main conclusions: Recognition of regional genetic lineages as discrete evolutionary
entities that occupy distinct ecological niches and also differ morphologically should be considered a priority for conservation. Gentoo penguins provide a good example of how conservation policy can be directly impacted by new insights obtained through the integration of larger genomic datasets with novel approaches to ecological modeling. This is particularly pertinent to polar environments that are among the most rapidly changing environments on earth.
1. INTRODUCTION
Evolutionary ecology aims to elucidate the spatial pattern of intraspecific genetic diversity and the evolutionary and ecological processes that underpin such patterns. These data enable policy makers to make informed decisions regarding biodiversity conservation and management. However, our understanding of the spatial patterns of biodiversity is often based on incomplete information (Hortal et al., 2015), with many new species and subspecies awaiting description or reclassification and an immense pool of intra-specific diversity having gone largely undocumented. As a result, biodiversity conservation is hampered by such data deficiencies that limit our understanding of the evolutionary patterns and processes that give rise to biodiversity, a situation referred to as the “Darwinian shortfall” (Diniz-Filho et al., 2013). In this context, new techniques for studying population-level genomics and spatial variation of the ecological niche offer complementary tools for uncovering functional units of phylogenetic diversity that have heretofore been obscured (Chen et al., 2019; Pahad et al., 2019).
Over the past decade, an increasing number of studies have revealed that the macrofauna of the Southern Ocean shows contrasting patterns of intra-specific diversity, from the existence of single evolutionary units distributed all the way around Antarctica (Cristofari et al., 2016; Díaz et al., 2011) and/or throughout sub-Antarctica, to a multitude of geographic clades, each restricted to a specific area (González-Wevar et al., 2019). Such endemism suggests that the isolation of populations has led to diversification through vicariance after colonization (Chenuil et al., 2018; Halanych & Mahon, 2018; Price, 2007). Oceanic fronts and the great geographical distance that separates Antarctica from the sub-Antarctic archipelagos and islands can limit dispersal and promote the divergence of evolutionary units within species (Clucas et al., 2018; Vianna et al., 2017). Moreover, this divergence may be greater when regional populations become exposed to dissimilar environments. Ultimately, the inter-regional differentiation of their ecological niches can result in shifts in allele frequency among populations that may lead to local adaptation, and given sufficient time, to speciation (De Queiroz, 2007; Graham et al., 2004).
Within the Southern Ocean marine ecosystem, seabirds represent key trophic components that are dependent on terrestrial environments for breeding and on marine habitats for feeding. For penguins, little or no population genetic structure has been reported for most species, including species distributed across the Antarctic, chinstrap Pygoscelis antarcticus (Freer et al. 2015, Korczak-Abshire et al 2012, Mura-Jornet et al., 2018), emperor Aptenodytes forsteri (Cristofari et al., 2016; Younger et al., 2017); and the sub-Antarctic, king A. patagonicus (Clucas et al., 2016; Cristofari et al., 2018), macaroni Eudyptes chrysolophus and royal penguins E. schlegeli (Frugone et al., 2019, 2018). In contrast, rockhopper penguins exhibit considerable population-level philopatry, leading to significant phylogeographic structure across both the Antarctic and sub-tropical oceans, and recently to the designation of three distinct species E. moseleyi, E. filholi and E. chrysocome (Frugone et al., 2018).
Molecular studies of the gentoo penguin P. papua have revealed old and cryptic lineage diversification across the Antarctic and sub-Antarctic. This deep genetic structure among populations can be explained by the Antarctic Polar Front (APF) separating colonies, by the large geographical distance among breeding colonies, and life history traits such as high natal philopatry and the coastal lifestyle of gentoo penguins limiting dispersal (Clucas et al., 2018; de Dinechin et al., 2012; Levy et al., 2016; Vianna et al., 2017). Diversification between gentoo penguin colonies from Crozet, Kerguelen, the Falkland/Malvinas Islands, and Antarctica, took place between 3.6 and 1.3 million years ago (Mya) (Vianna et al., 2017). The geographical distribution of the gentoo lineages as recovered using molecular DNA data (Vianna et al., 2017) are partially inconsistent with the present classification of subspecies using morphology: northern gentoo (P. papua papua) are distributed north of 60oS across the sub-Antarctic region, and southern gentoo (P. papua ellsworthii) are
distributed between 60o-65oS around Antarctica (Stonehouse, 1970). Diversification of
gentoo penguin clades (lineages) could be explained in terms of vicariance processes induced and/or reinforced by geographical barriers, followed by selective forces in response to local environmental variables. Penguin species require both terrestrial breeding areas with suitable conditions for thermoregulation that favor their reproduction and nearshore marine habitats that supply sufficient food resources. Understanding the association of each cryptic lineage with its local environment shows affinities or local
adaptation which may in turn be used to investigate the drivers and limitations of how lineages may respond to future environmental change. This is particularly relevant in species with deep intraspecific genetic structure to enable accurate designation of the conservation status of member of a species complex by for example IUCN or Birdlife International. The gentoo penguin is currently listed as a single species widely distributed across the sub-Antarctic region and part of the Antarctic Peninsula, whose category by IUCN is "Least Concern" due to its stable population trends. However, consideration of the spatial structure of P. papua lineages might necessitate revisiting the conservation status of the species.
In the present study we first explore the biogeographic extent and drivers of the global P. papua distributional range by modelling the respective marine and terrestrial ecological niches of this penguin species as a whole. Using mtDNA sequences and genome-wide SNP, we then establish the genetic relationships among a comprehensive sampling of gentoo penguin populations distributed across the range of the species. Our sampling includes previously unstudied colonies, such as from Marion, Martillo, Crozet Islands and Macquarie Island. In addition, we determine and compare the terrestrial and marine ecological niche and macro-environment envelopes that each lineage occupies. Finally, we investigate the role of ecology as a driver of lineage differentiation among gentoo penguin colonies.
2 METHODS
2.1 Species distribution modeling (SDM)
We evaluated the P. papua biogeographic range and associated spatial ecological niche drivers with a species distribution model (SDM; Fig 1, S1-S4). Available georeferenced data points for all known gentoo breeding colonies were compiled and supplemented with information on the spatial presence of penguins taken directly from XY-coordinated Maritime Antarctica monitoring sites (Woehler, 1993), from additional literature (e.g. Lescröel & Bost, 2006), and from governmental reports on South Atlantic and sub-Antarctic territory dependencies. All point data were filtered by the spatial resolution of
environmental data to a 5 arc-min resolution. Climatic and macroecological variables used as environmental predictors for SDMs were extracted from the databases WorldClim2 (terrestrial; Fick & Hijmans, 2017) and BIO-ORACLE 2.0 (marine) (Assis et al., 2017). We used a Pearson correlation test (r > 0.90) to examine collinearity between all pairs of variables offered by these repositories, and when these pairs had r > 0.90 we kept those with higher potential biological relevance. The final selection was composed of 7 variables for modeling the marine environment: sea ice cover maximum (o1), max/min primary productivity (o9/o10), max/min salinity (o11/o12), and max/min surface water temperature (o13/o14); and another set of 7 variables for modeling the terrestrial environment: mean diurnal temperature range (bio2), temperature isothermally (bio3), temperature annual range (bio7), mean temperature of the warmest calendar quarter (bio10), precipitation seasonality (bio15), mean precipitation of the wettest quarter (bio16), and mean precipitation of the warmest quarter (bio18). All SDMs were built with the MaxEnt algorithm (Phillips et al., 2006). Logistic MaxEnt outputs provided suitability gradients that helped us to visualize terrestrial and marine macro-environmental preferences for the species as a whole (Fig 1). Where the two habitats overlapped, we displayed the terrestrial output in “hybrid” cells and inferred marine suitability based on adjacent cells. We tested the models with a 30% random subset and calculated the True Statistic Skill (TSS) on the minimum training presence threshold as an indication of the robustness of the models.
2.2 Samples collection for genetic data
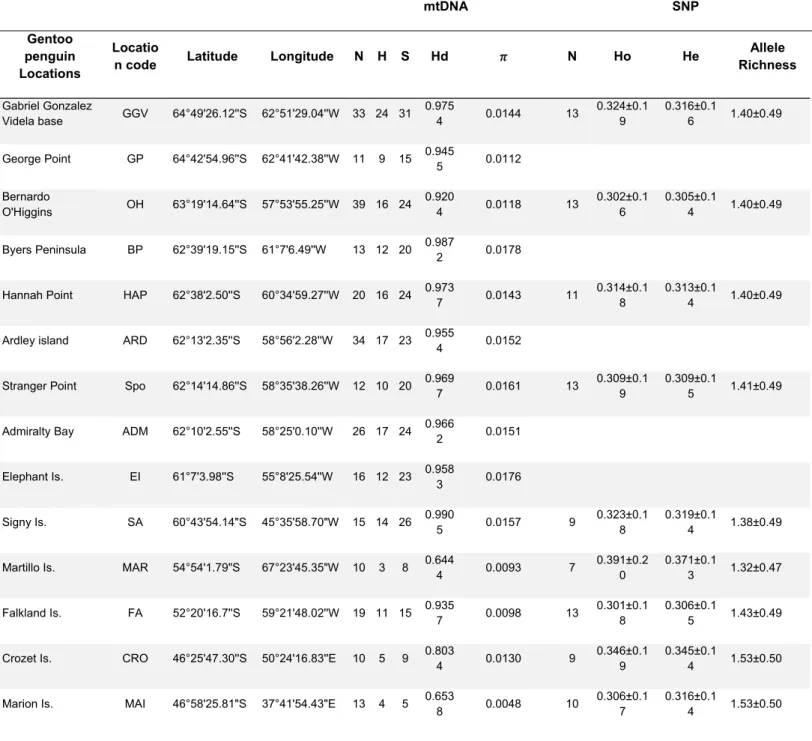
We evaluated genome-wide SNP using ddRAD data and the mtDNA control region for gentoo penguin across the Southern Ocean (Fig 2). For ddRAD data, we analyzed a total of 110 individuals, up to 13 individuals per population (Table 1). For mtDNA, we analyzed a total of 303 individuals from several locations in Antarctica and the Scotia Arc, from the islands of Kerguelen, Crozet, Marion and Falkland/Malvinas, Martillo and Macquarie Island distributed across the sub-Antarctica. The protocol used to capture penguins, sampling procedures, and permit details are provided in Appendix S1.
DNA was isolated from blood samples using the salt protocol from Aljanabi & Martinez (1997) with modifications described in Vianna et al. (2017), and from fecal samples using
the QIAamp DNA Stool kit (Qiagen). We evaluated degradation of genomic DNA through electrophoresis on a 1% agarose gel. Extractions were quantified using a Qubit fluorometer (Thermo Fisher Scientific, Waltham, MA, USA).
2.3 ddRAD library preparation
We prepared ddRAD libraries for gentoo penguins, following the protocol described in (Peterson et al., 2012). Genomic DNA (500 ng) of each individual was digested using 0.5 µL of EcoRI (0.1 U/ µL) and 0.5 µL of SphI-HF (0.1 U/ µL) at 37°C for three hours. Each sample was then ligated to one of 24 unique barcodes (P1 and P2). Pools of 24 samples were size selected for fragments between 300-400 base pairs (bp) using Pippen Prep (Sage Science, Beverly, MA, USA). After size selection, integrity and quantification of samples was assessed using the Agilent 2100 Bioanalyzer system (Agilent, Santa Clara, CA, USA). Each library was amplified using 8-10 PCR amplification cycles and dual-indexed using Illumina adapters (P5 and P7; Peterson et al., 2012). A final quantification was performed using the Qubit 2.0 fluorometer (Thermo Fisher Scientific, Waltham, MA, USA). Libraries were sequenced across three lanes of the Illumina HiSeq 4000 platform at the Vincent J. Coates Genomics Sequencing Laboratory (Q3B, University of California, Berkeley).
2.4 ddRAD data processing
SNP sets were produced from raw reads assembled to the gentoo penguin reference genome (Appendix SI) using STACKS version 2.2 (Catchen et al., 2013; Rochette et al., 2019). Quality filtering and demultiplexing was performed using process_radtags truncating all reads to 90 nucleotides to avoid the lower quality bases at the end of the read. For SNP calling we used a minor allele frequency of 5% and a site minimum count of 80% to restrict the presence of missing data (Ns) in the final dataset using samples with a minimum of 9x of average depth (Table S1). Before data analysis, we estimated Hardy-Weinberg Equilibrium (HWE) per locus and per population with Arlequin 3.5.2.2 (Excoffier & Lischer, 2010) using 10,000 permutations. After an FDR correction (q-value=0.05) SNP that appeared in HW disequilibrium in at least 30% of the populations
were filtered out. The ddRAD data are available at dataDryad (https://doi.org/10.5061/dryad.s7h44j140).
2.5 mtDNA sequencing
The mitochondrial control region (Hypervariable Region 1: HVR1) was PCR-amplified using primers tRNAGlu and AH530 from Roeder et al. (2002). All gentoo penguin mtDNA were Sanger sequenced with an ABI 3730xl at Macrogen (Korea), edited using Sequencher v. 5.1 (Gene Codes, Ann Arbor, MI, USA), and aligned using ClustalX v. 2.1 (Larkin et al., 2007). Polymorphic sites and haplotypes were identified using the program DNAsp v. 5.0 (Librado & Rozas, 2009).
2.6 Diversity Indices
We evaluated the differences in genetic diversity for whole genome-SNP coverage across the breeding colonies. This was done by calculating the expected heterozygosity (He), observed heterozygosity (Ho), and allelic richness (Ar) with rarefied allele counts, using the HIERFSTAT package version 0.04–22 (Goudet, 2005) in R v 3.5.1 (R Core Team, 2018).
For mtDNA HVRI sequences, we characterized the genetic diversity of each population for all species (Table 1). We used Arlequin v. 3.5.2.2 (Excoffier & Lischer, 2010) to calculate the following summary statistics: number of polymorphic sites (S), haplotype number (H), haplotype diversity (Hd), nucleotide diversity (π), and pairwise difference (П, average number of nucleotide differences between sequences).
2.7 Population Genetic Structure
To assess the influence of varying numbers of loci on determining population genetic structure, we generated 6 random subsets each of 50, 500, 1000, 2000, 3000 and 4000 loci (Fig S5). For each set of the above number of loci we performed a DAPC analysis (Jombart et al., 2010) in Adegenet (Jombart, 2008; Jombart and Ahmed, 2011) to estimate both, the number of genetic groups using the Bayesian Information Criterion (BIC), and to determine the genetic structure of each subset using a number of principal components equal to N/3 where N is the total number of individuals. We also calculated
the pairwise FST for the total number of SNP, and FST and ɸST for the mtDNA HVRI data,
among locations using Arlequin v. 3.5.2.2. We summarized the results from Arlequin graphically using the R functions for Arlequin XML files (Fig S6). Statistical significance of the estimates was determined with 10,000 permutations. The p-value for pairwise FST
and ɸST between populations was corrected using a FDR.
To determine the number of genetic groups using the total number of SNP after filtering procedures, a Bayesian clustering approach was implemented using STRUCTURE v 2.3.4 (Pritchard et al., 2000). Clusters (K) varyed from one to eleven, corresponding to the number of breeding colonies sampled plus one (Fig 2B). Ten replicate runs were performed in parallel using StrAuto (Chhatre & Emerson, 2017). For each run, the genetic ancestry of each individual was estimated based on the admixture model without any prior population assignment under a correlated frequency model, with 500,000 Markov chain Monte Carlo (MCMC) replicates and with a 10% burn-in period. The 10 replicates obtained for each value of K were summarized with CLUMPP (Jakobsson & Rosenberg, 2007) and plotted using DISTRUCT (Rosenberg, 2004). The optimal value of K was identified according to the Evanno’s method (Evanno et al., 2005) as implemented in Structure Harvester (Earl & vonHoldt, 2012).
2.8 Species Tree, phylogenetic reconstruction and divergence time
The species tree SNP data was generated in SNAPP version1.3.0 (Bryant et al., 2012) in BEAST2 version 2.4.7 (Suchard et al., 2018) using the full SNP dataset of a subset of five random individuals per sampled site (Fig 2A). Gamma prior distributions (2, 2000) were used for the ancestral population size parameter (h). We used a log-likelihood correction, and sampled the coalescent rate and the remaining parameters at default values. We ran two independent runs for each prior using different starting seeds for ≥1 million Markov chain Monte Carlo (MCMC) generations, sampling every 1,000 steps with 10% of trees as the burn-in period. We used TRACER 1.6 to check for convergence of the chains and that the effective sampling size (ESS) for all parameters were >500 (Rambaut et al., 2018). Replicated runs were combined using LogCombiner version 2.4.1 and Tree annotator v. 2.4.7 was used to generate a consensus tree. The likely species trees were displayed using DensiTree version 2.2.1 (Bouckaert, 2010).
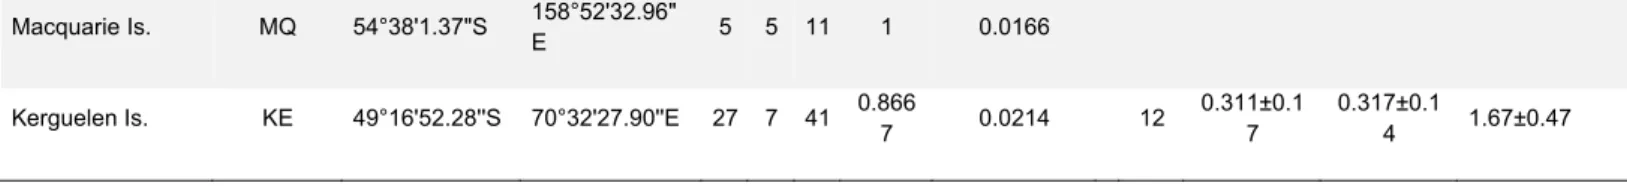
Bayesian phylogenetic reconstruction and divergence time estimation were implemented in the program BEAST v. 2.4.7. for mtDNA HVRI (Fig 2C, S7). Five Adélie penguin samples were sequenced and then incorporated into the phylogeny (KX925508−KX925512), and a sequence from the emperor penguin (Aptenodytes forsteri) was used as the outgroup (Li et al. 2014). The model of nucleotide substitution implemented was determined using jModelTest2 v. 2.1.10 (Darriba et al., 2012) and the Akaike’s Information Criterion (AIC). The best-fitting model of nucleotide substitution was HKY+I+G. Divergence time among gentoo penguin lineages was based on the placement of the fossil Pygoscelis grandis (7.6 ± 1.3 Mya, Walsh & Suárez, 2006), which was used to calibrate the node leading to Pygoscelis under a normal distribution. A strict molecular clock model was applied under a Yule process tree prior. Four independent runs were performed using 30 million generations with parameters logged every 1000 generations; a burn-in of 10% trees was used. The four independent runs were combined using LogCombiner v.2.4.1. The parameter analyses were assessed for convergence and Effective Sample Size (ESS) using Tracer v. 1.6. Finally, Tree annotator v. 2.4.7 was used to generate a consensus tree, and FigTree v1.4.4 (Rambaut et al., 2018) was used to visualize the tree.
2.9 Genomic-based species delimitation
Species delimitation hypotheses were tested using the SNP data with a species delimitation method that use Bayes factors (BFD*; Leaché et al., 2014) implemented in SNAPP. Alternative species delimitation scenarios were allowed to be compared with this method in an explicit MSC framework by calculating and comparing marginal likelihood estimates (MLE) for each evaluated model.
We conducted several independent runs in Path Sampler (Lartillot & Philippe, 2006) in BEAST with 12 steps each consisting of 100,000 MCMC generations. We used a burn-in of 10,000 generations, after which we sampled every 100 steps using an alpha value of 0.3. These settings were sufficient to ensure convergence and obtain ESS>500. The Bayesfactor (BF) test statistics were calculated, where BF is the difference in MLE (Marginal L-Estimate) between all competing models. Three competing species delimitation hypotheses were defined based on current taxonomy following Stonehouse,
(1970), geographic distribution of putative species, and our phylogenomic analyses. To avoid over-parametrization we ran each model using a gamma distribution (2, 2000) as prior distribution for the ancestral population size parameter (h); i.e., the “intermediate population size” scenario used for SNAPP analyses.
2.10 mtDNA Species delimitation
Two different species delimitation methods were employed to evaluate the importance of mtDNA lineage structure across the geographic range of gentoo penguins, the Automatic Barcoding Gap Discovery (ABGD) method (a non-tree-based method) and Generalized Mixed Yule Coalescent (GMYC) method (a single locus, tree-based method). The ABGD method uses genetic distance to detect a ‘barcoding gap’ between candidate species based on genetic distance values that are not overlapping among intra- and interspecific comparisons and are independent of tree topology. The ABGD method was performed on the online web-server (http://wwwabi.snv.jussieu.fr/public/abgd/) and was run with the default settings (Pmin = 0.001, Pmax = 0.1, Steps = 10, X (relative gap width) = 1.5, Nb bins = 20). The mtDNA HVRI sequences alignment (without outgroup) was used to compute a matrix of pairwise distances using simple uncorrected distance. The GMYC method was implemented in R package SPLITS (Ezard et al. 2009). This method is based on an ultrametric phylogenetic tree such as one calibrated using a molecular clock with dissimilarities of branching rates used to infer species boundaries following a Yule process and neutral coalescent events.
2.11 Quantification of ecological niche overlap
We examined the ecological niche overlap between the main genetic clusters delineated by SNP by applying the ordination techniques proposed by Broennimann et al. (2012) using the Ecospat R package (Di Cola et al., 2017) where we tested Schoener’s D index as a measure of niche overlap ranging from 0 (no overlap) to 1 (complete overlap). We built comparative SDMs through raw individual MaxEnt models on each of these clusters in both the marine and terrestrial environments of the breeding areas. We ran equivalence tests to evaluate whether the genetic clades occupy non-identical ecological niches, and subsequently ran Schoener’s D index similarity tests to evaluate niche similarity, i.e.
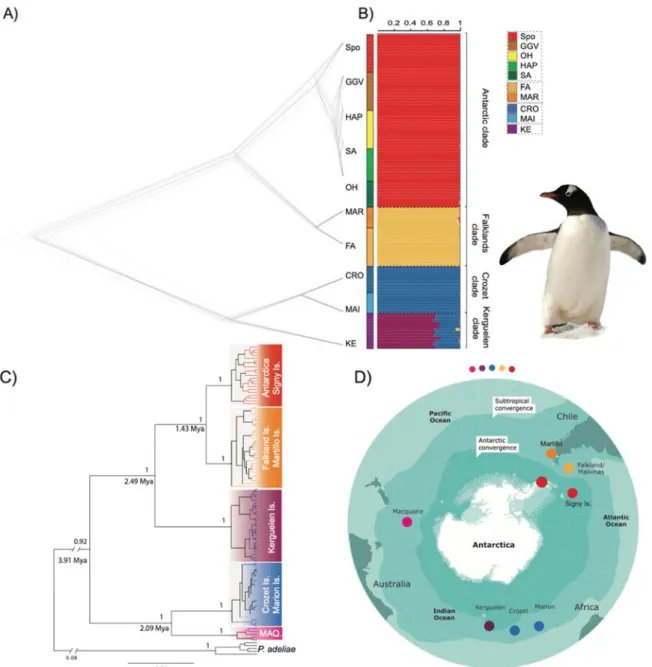
whether a clade resembled others at more than a random level (i.e., differed from null expectations). For both tests we conducted 100 null model simulations to compare observed and simulated D distributions between each pair of clades (6 permutations) on the overlap of their niches at both at the terrestrial and marine levels. Niche occupancy results for each clade are displayed as density clouds in spatial Principal Component Analyses (sPCA, Fig 3).
2.12 Bioclimatic variables and population genetic structure
To determine the relative contribution of geographical position and each bioclimatic or ecological variable to the genetic structure of the neutral genotypes, we carried on a genotype association analyses with a partial Redundancy Analysis (RDA; Fig 4) in the VEGAN package (Oksanen et al 2019). For this, first the spatial genetic structure was estimated using the geographic coordinates of the sampling sites based on distance-based Moran’s eigenvector maps, dbMEMs (Dray et al., 2006; Legendre & Legendre, 2012). dbMEMs were determined by converting latitude and longitude into cartesian coordinates using the SoDa package in R 3.22 and with these, a matrix of Euclidean distances was calculated using the dist function in Vegan in R (Oksanen et al., 2019). Using this matrix, a rectangular matrix was created with the dbMEMs associated to latitude (dbMEM2) and longitude (dbMEM1) using the create.dbMEM.model function in the ADESPATIAL package. Prior to the analysis, genotype data were standardized by removing the broad scale trend using the decostand function with the Hellinger’s method in VEGAN. A partial RDA was used to evaluate the environmental variables as fixed factors and dbMEM vectors as co-variables to control the effect of the spatial distribution in the genetic structure. We determined the optimal model with respect to the environmental factors that best explained the genetic variability using the ordistep function in VEGAN according to their significance, F-ratio, and AIC. We used a marginal ANOVA with 10,000 permutations to evaluate the significance of each fixed factor considered.
To estimate the relationship between genetic, geographic, and environmental (terrestrial and marine) distances, all values of matrices were first standardized (x-mean(x)/SD(x)). For each set of environmental variables we performed a Principal Component Analysis
(PCA) using the prcomp function in R. Using the first component of each analysis (PC1), we calculated the multi-variable environmental distances between localities on the PC axes. Resulting values were summarized as multi-variable environmental distance matrices for terrestrial, marine, and total environment occupied by gentoo penguins, respectively.
We then performed (1) a Partial Mantel test using genetic distance (i.e. FST) and
geographical distance between colonies, using environmental distances (marine, terrestrial and combined) as covariates and, conversely, (2) we performed a Partial Mantel test using genetic distance and environmental distances with geographical distances as a covariate (Fig 5, S8). Partial Mantel test were carried out using the ECODIST package in R (Goslee and Urban, 2007). Finally, to estimate the joint effect of geographic and environmental distances we performed a Multiple Matrix Regression with Randomization analysis (MMRR) (Wang, 2013) using the package PopGenReport (Adamack and Gruber, 2014; Gruber and Adamack, 2015). For each set of variables, we previously performed a Mantel test to evaluate the correlation with the geographical distance in order to fulfill the no-correlation assumption of the MMRR analysis (Wang 2013). With the weight of their relative contribution on genetic differentiation as measured by MMRR analysis, we constructed a new distance matrix and conducted a Mantel test between the genetic distance and the combined effects of geographic distances and environmental distance.
3 RESULTS
3.1 Species distribution modeling
Gentoo penguins are widely distributed across the Southern Ocean and inhabit many of its islands and coasts. Our SDM approach allowed us to identify preferred conditions in both the terrestrial and marine environments inhabited by gentoo penguins during the breeding season. Predictive performance (TSS) was high for both marine (0.85) and terrestrial (0.96) models. Gentoo penguins have a strong preference for breeding around waters of high primary productivity across a range of temperature and salinity levels, with
summer temperatures at breeding colonies oscillating around a few degrees above zero, a limited diurnal range of temperatures, and moderate summer precipitation levels (Fig 1, S1-S4).
3.2 Genetic structure and lineages
Using a reduced genome approach (ddRAD) after HWE filtering (see methods) we obtained 4,429 SNP for 110 individuals across the Southern Ocean, with a median coverage of 97.33x (Table S1) and a mean quality score of 35. Using mitochondrial DNA, we identified a total of 145 haplotypes from 303 gentoo penguins. Genetic diversity was similar across populations (SNP He=0.32-0.41; mtDNA Hd=0.64-1.0; Table 1).
The SNP data showed agreement across the 6 random subsets of data comprising different numbers of loci for DAPC analyses (Fig S5) and our coalescent-based trees generated using SNAPP with the total number of SNPs revealing four main clusters of gentoo penguins (Fig 2 A-D): i) a clade comprising individuals from Crozet, and Marion Island; ii) a Kerguelen clade (Kerguelen Island); iii) a South American clade (Falkland Islands [Malvinas] and Martillo Islands); and iv) an Antarctic clade (Antarctica and Scotia Arc). Both methods were also able to distinguish the Crozet Island population from the Marion Island population as well as the Martillo Island population from penguins on the Falkland Islands (Malvinas). Bayesian phylogenetic reconstruction (BA) based on mtDNA supported the existence of the same four divergent clades mentioned above, with lineage divergence dated to about 3.91 Mya (2.06 - 5.43 Mya). In the mtDNA data, individuals sampled from Macquarie Island were identified as a distinct monophyletic clade sister to individuals sampled from Marion and Crozet Islands, diverging about 2.09 Mya (1.00 - 2-99 Mya; Fig 2C, Fig S7); these lineages were sister to the Kerguelen lineage (2.49 Mya, 1.26 - 3.52 Mya), and in turn the above two clades were sister to two clades comprising individuals sampled from Antarctica and the Scotia Arc, and those from the Falkland Islands (Malvinas) and Martillo Islands (1.43 Mya, 0.66 - 1.98 Mya; Fig 2C & Fig S7). However, the position of the Kerguelen clade differs in the genomic and mtDNA phylogenetic trees (Fig 2 A & C).
STRUCTURE analyses revealed the same four genetic clusters: (1) Antarctica and the Scotia Arc; (2) the Falkland (Malvinas) and Martillo Islands; (3) Crozet and Marion Islands; and (4) Kerguelen Island (Fig 2B).
All FST comparisons for SNP were significantly different from zero ranging from 0.012 to
0.042 between Antarctic locations, 0.10 between Martillo and the Falkland (Malvinas) Islands, and 0.052 between Crozet and Marion Islands; with between-clade values varying from 0.21 to 0.66. Significant ФST-values for mtDNA were found between clades
and for a few pairwise comparisons within clades (Fig S6).
Species delimitation of gentoo penguins was evaluated using SNP data for three different models: 1) current taxonomy reflected by subspecies designations, 2) results from the phylogenomic analyses, and 3) geographic distribution. Path Sampler found that the bestfitting model according to SNAPP is the one defined by the four mtDNA clades (MLE= -19,760.218), which is superior to the model which considered each population as a different group (MLE= -19,850.589); the most poorly-fitted model reflects the current taxonomy of one species and two subspecies (MLE= -22,515.567).
The methods for species delimitation pointed to the existence of five groups consistent with the genetic clades with the inclusion of the clade from Macquarie Island. The ABGD analysis showed five groups for the first four partitions, with prior maximal intraspecific distances (P) ranging from 0.001 to 0.005. The GMYC analysis suggested six clusters and seven entities (including the two species incorporated as outgroups with high probability [confidence interval (CI) = 5–24, lnL of null model = 1633.632, ML of GMYC model = 1657.17, P= 5.99e-11]) and the threshold time of 0.95 Mya. These results support the existence of four main clades, along with the colony from Macquarie Island as a distinct lineage.
3.3 Environmental niche overlap
Once we observed the genetic structure between regional gentoo populations, we examined the question of what could be the underlying macro-ecological driver of lineage divergence. Niche overlap techniques indicate the degree of ecological characteristics shared by two or more functional groups (Broennimann et al., 2012). Our environmental
niche overlap analysis performed independently for the terrestrial and marine environments shows that all pairwise combinations of the ecological niches belonging to the four clades differ significantly in terms of equivalence (i.e. all have non-identical macro-ecological envelopes) for both the terrestrial and marine environments (Table 2). The observed overlap in D-values were very low, ranging from 0% to 5% in the marine environment where only the Kerguelen clade had a small overlap with the Antarctic (1%) and South American (5%) clades. In the terrestrial environment, the overlap was also relatively small but always present, reaching a high of 15% between the Antarctic and north APF clades. The north APF clade evaluated here comprises gentoo penguins from Crozet, Marion and Macquarie Islands, not including Kerguelen island which lies on the APF. Notably, the Kerguelen, Antarctic and South American clade overlapped with each other by 6% and 7% respectively. These findings indicate that the ecological segregation between clades is consistently stronger in the marine than the terrestrial environment. Since all marine and terrestrial niches of the four clades are non-equivalent, we explored the niches in relation to one another (Warren et al., 2008). We found no evidence of niche evolution (dissimilarity) for any pairwise comparison. However, our niche similarity tests revealed significant results for the analyses conducted in the context of niche conservation (i.e. the niche for one clade showing greater relatedness to that of another clade than to a random simulation; Table S2). Here, both the Antarctic and South American clades had significant similarities to each other in the terrestrial environment (p=0.04 and p=0.03, respectively, Table S2, suggesting that these two recently diverged lineages are retaining some common ecological features from the shared ancestral macroclimatic niche, i.e. they have not fully differentiated into their respective environments. In contrast, we did not find evidence of niche conservation (similarity) between the north AFP and Kerguelen clades despite their genetic relationship as sister-lineages (p=0.39 and p=0.28, respectively, on terrestrial environment similarity, and p=0.19 and p=0.23, respectively, on marine environment similarity; Table S2). Therefore, clade niches are more highly differentiated among the oldest sister populations (Crozet vs Kerguelen), and reduced on the recent diverged ones (Antarctica and South America).
Consistent with the niche overlap scores, the results of our spatial PCA show a stronger segregation of the multivariate ellipsoids in the marine environment. As shown on the first axis in Fig 3A, the increasing temperature and salinity of the marine environment for northern populations such as the Falkland (Malvinas) Islands contrast with the marine environment of the southernmost Antarctic populations, which show a higher extent of sea ice. The second axis (Fig 3A) shows a strong positive effect for primary productivity, with the latitudinal extremes (Antarctica and South America) sharing similar tendencies to occupy higher productivity areas. The north APF clade and Kerguelen breeding sites have lower productivity values, possibly related to the observed mismatch of the locally preferred marine and terrestrial environments (seen in Fig 1 insets), where the most favorable (greener) feeding areas are distant from the breeding coastlines. Terrestrial PCA effects are less evident (Fig 3B). Axis 1 shows a positive effect for higher summer temperatures, effectively segregating non-Antarctic populations; the locations from north of APF clade and South American sites sustain higher precipitation in the same warmer period. Variation in seasonal distribution of temperature is higher in the Antarctic and South America than to the north of the APF clade, suggesting a small oceanic effect. Axis 2 indicates higher isothermality and diurnal temperature ranges, but this effect cannot be attributed to any clade in particular.
3.4 Environmental and genetic redundancy analyses
Optimal models of RDAs for the marine and bioclimatic factors, were in general consistent with the niche overlap results described above. The first two axes of the RDA explain 80.3% and 74.1% of the total variance for the terrestrial bioclimatic (F=4.4715) and marine model (F=4.113) respectively, making both the general models highly significants (p=0.001, Fig 4). The best-fit model for bioclimatic variables included temperature and precipitations (Table S3, Fig 4). Both variables were mainly associated with the Falkland/Malvinas group (Falkland/Malvinas and Martillo Island) and Crozet/Marion group, respectively. Our modeling using ordistep for marine variables, revealed the best-fit models included sea water temperatures, salinity, and primary productivity, which were strongly associated with populations from the Falkland/Malvinas Islands and Antarctic populations, whereas primary productivity was associated with localities north of APF
such as Crozet Island (Table S3; Fig 4). The lower latitude locations such as Crozet and the Falkland (Malvinas) Islands were segregated by the significant and positive effects of higher summer temperatures, whereas Antarctica, Signy Island (S. Orkney) and Martillo Island (S. America) were in turn associated mainly with reduced precipitation regimes (Fig 4).
The Partial Mantel test was highly significant (p < 0.05) for distance as a response variable (Fig 5A) only differing in the r-values when all variables were used (R=0.71), terrestrial bioclimatic (R=0.40) and marine (R=0.76) as co-variates. The marine model was the best-fit based on the results of a Multiple Matrix Regression with Randomization analysis (MMRR) and Mantel R values. A Partial Mantel test between genetic distance and environmental marine distance, controlling for geographic distance, was also highly significant (R=0.77, p=0.005; Fig 5B). Geographic and marine (environmental) distance were not correlated (R=0.304, p=0.064). In turn, a positive and significant correlation were found for both, geographic and bioclimatic distance (R=0.304, p=0.064) as well as using total environmental distance (Marina and Bioclimatic (R=0.45, p=0.002; Fig S5). For that reason, we only used environmental marine distance from the MMRR analysis to test the influence of the joint effect of geographic distance and environmental distance. In this context, a Mantel test with the jointed effect weighed through a MMRR was the best-fit model (R=0.84, p=0.002). However, observing the distributions of each point, correlations were mainly explained by the influence of the distinct genetic groups (Figure 5C).
4. DISCUSSION
Conservation focuses on protecting species and their habitats while inherently assuming a strong degree of niche conservation (Wiens et al., 2009). The wide geographical distribution of gentoo penguins around the Southern Ocean and part of the South Atlantic spans diverse marine and terrestrial abiotic conditions and suggests that the species, seen as a whole, has a wide tolerance of climatic regimes. Nonetheless, our data indicates that the species is divided into several distinct regional lineages that have adapted to exploit local environmental conditions. These lineages are spread over large
distances in the Southern Ocean and subjected to spatially dynamic changes in environmental conditions associated with climate change (Swart et al., 2018). Changing conditions in the Southern Ocean as coastal water becoming less salty in fjord systems and ocean acidification are expected to produce major impacts on the Antarctic biota (Convey & Peck, 2019). The growth trend of gentoo penguins as a whole is not to be taken as a representative fate for each of the genetic and ecologically different clades we identify. Changes in the Southern Ocean will likely affect more intensively peripheral colonies situated at the edges of the distribution range where the species are at the limit of their tolerances (Forcada & Trathan, 2009). However, this issue remains to be explored in depth. Such rapid changes in environmental conditions means that at least some, if not all, breeding habitat will be at risk of becoming suboptimal over time. This raises important questions about the ecological resilience of previously overlooked cryptic lineages, which lack broad dispersal capabilities and occupy specialized niches. Thus, some of these lineages may not be equally able to adapt to the currently changing macro-ecological conditions and could be under local risk of extinction (Thomas et al., 2004).
Unveiling cryptic diversification events is essential to implementing informed conservation management strategies. Here we employed multiple methods centered on using a combination of molecular (genome-wide SNP and mtDNA) and ecological data (niche models and overlap analyses) to detect pronounced diversification among gentoo penguin colonies across the Southern Ocean and to explore the underlying processes that may have led to the observed extent of lineage differentiation. High ecological variability has been described for gentoo penguins across their biogeographic range, with resulting impacts on feeding and breeding biology including laying time, chick growth (Williams 1995), expression of color ornaments (Barbosa et al., 2012), the duration of foraging trips, and the availability of prey among colonies (Lescröel et al., 2009). Some of these traits, such as the timing of laying, have a genetic basis, as genotypes may be selected to match resource availability and chick rearing requirements (Charnov & Krebs, 1974), or by photoperiod-, climatic-, or resources-related plasticity (Lambrechts et al., 1997).
The behavior of gentoo penguins may provide support for the existence of genetic differences because limited gene flow among colonies promotes differentiation and diversification. Gentoo penguins have a greater propensity for being sedentary during the non-breeding period than do other pygoscelid penguin species (Dodino et al., 2018; Friesen et al. 2007; Williams, 1995), which partly explains the degree of isolation among colonies. The gentoo penguin is a resident inshore forager (Dimitrijevic et al., 2018; Lescröel & Bost, 2005; Lescröel et al., 2004), an attribute that may limit its dispersal, in contrast with the pelagic behavior of other penguin species which facilitates inter-colony gene flow (Clucas et al., 2018). Moreover, natal philopatry may explain the population genetic structure detected from genomic data among breeding colonies within each clade we studied. Hence, natural selection may operate across different environments at sea, enabling local adaptation, isolation, and over time speciation.
At a regional scale, using SNP data, Clucas et al. (2018) identified three main gentoo penguin clusters (i.e. Kerguelen, Falklands Is., Antarctica and South Georgia). However, the study by Clucas et al. (2018) lacked samples from Crozet and Marion, and Macquarie Islands, which are inhabited by additional lineages as described in this study. Our results reinforce the idea that the APF acts as an important barrier between sister-clades (South America versus Antarctica; and Crozet, Marion, and Macquarie Islands versus Kerguelen Island) which historically (e.g. Kerguelen; Gersonde et al., 2005) or currently lie on either side of the APF and show both ecological and genetic differentiation. Climatic and trophic features can induce morphological changes as seen in the relationship between water temperature and body size. Indeed, morphological differences have been historically reported for at least two subspecies of gentoo penguin: P. p. ellsworthii distributed across the South Orkneys, the South Shetland Islands, and the Antarctic Peninsula, which has smaller body sizes and bill proportions than P. p. papua from the northern parts of the species’ distribution across the sub-Antarctica (Stonehouse, 1970). However, spatial variation in morphometrics is also evident in other populations, with a tendency of decreasing size towards the south of the gentoo penguin distribution (Stonehouse, 1970) and within Antarctica (Valenzuela-Guerra et al., 2013). Gentoo penguins from Macquarie Island were first described as a distinct subspecies (P. papua taeniata; Mathews, 1927) from those distributed across the rest of the sub-Antarctic. The subspecies, P. papua
taeniata was later grouped with individuals from Heard, Kerguelen and Marion Island (Peters, 1934), but the penguin population from Crozet Island was not evaluated. Gentoo penguins from Crozet have been reported in the literature as being larger than their counterparts from other locations (Falla, 1937; Stonehouse, 1970), and to resemble those from Marion Island (Crawford, 1952), which are consistently identified in this paper as part of the same genetic clade.
The divergence time estimated between the gentoo penguin clades (3.91 – 1.43 Mya) were similar to those estimated by Vianna et al. (2017) and the dates are similar to those estimated among species within other penguin genera (Cole et al., 2019). Our results suggest taxonomic recognition for the following four clades based on prior descriptions of morphology, type location, genomic, and trophic data: 1) the Southern gentoo penguin, P. p. ellsworthii, distributed across Antarctica, South Orkneys, the South Shetlands Islands and South Georgia; 2) the Northern gentoo penguin, P. p. papua, restricted to the Falkland/Malvinas Islands and Martillo Island; 3) the Eastern gentoo penguin, P. p. taeniata, first described for Macquarie but which should also include the populations on Crozet and Marion Island within the same mtDNA clade (although mtDNA show historical divergence between Macquarie from Crozet and Marion Islands, further evaluation using genomic data is necessary to support the possibility of two different taxa); and 4) the Southeastern gentoo penguin, a subspecies from Kerguelen Island, which requires formal description.
Mitochondrial DNA and genomic data support the existence of highly divergent/differentiated clades; however, the Kerguelen clade occupies a different phylogenetic position in each dataset. In the phylogenetic hypothesis constructed using genomic data, the Kerguelen clade is sister to the clade comprising individuals from Crozet and Marion Island, and in the mtDNA to individuals sampled from Antarctica and the Falkland (Malvinas) and Martillo Islands. Different tree topologies between biparentally inherited SNP and maternal mtDNA may be explained by the distinct coalescence times of the markers, sex-biased dispersal, and/or introgression between lineages (Funk & Omland, 2003; Maddison, 1997).
In terms of macroecology, gentoo penguin terrestrial niches are less differentiated than those in the marine environment, a distinction we attribute to the high intra-clade homogeneity of sea conditions within feeding areas, in particular locally stable water temperatures and salinity, with larger inter-clade differences across regions appearing to be caused by latitudinal gradients of ocean stratification. Terrestrial features of penguin rookeries are locally more variable within breeding areas due to changing weather conditions, and they sustain a more homogeneous inter-regional optimum driven by the general oceanic climate present across latitudes. This pattern, which reduces the degree of climatic differentiation across terrestrial regions while promoting a rich variety of marine ecosystems, is typical of the Southern Ocean territories. In the case of gentoo penguins, we attribute genetic differentiation primarily to conditions at sea, whereas land conditions are subjected primarily to more local characteristics related to topographic features that drive nesting habitat availability.
Equivalence tests indicate that the niches of all four clades of gentoo penguins differ in terms of both the marine and terrestrial macro-environment. Our results also suggest one instance of niche conservatism, but only in one of the terrestrial pairwise comparisons: Antarctica and South America. This could be explained by the recent age of these lineages, thereby retaining some common ecological features from the shared ancestral macroclimatic niche, i.e. each lineage has not yet diverged to occupy distinct terrestrial environments. This degree of niche conservationism could also explain why gentoo penguin populations in the Antarctic Peninsula are responding positively to a changing clime, increasing their population numbers and expanding southwards as the macroecological conditions become more favorable for them (Trivelpiece et al. 2011). By extrapolation, this similarity in niches would have eroded in clades that have experienced a longer time period of climatic variation enabling local selection to occur for optimal rookery selection, such as on Crozet and Kerguelen Islands. Interestingly, in the Antarctica versus South America comparison, the marine sPCA suggests that these sister-clades occurring at environmental extremes on the Scotia Arc, have sought to acquire greater marine feeding resources (seen from their position in areas of higher primary production), and diverged from the ancestral state (north of APF clade) which lies between cold and warm water adapted lineages. Thus, we postulate that the marine
evolutionary trade-off between thermal stress and gain in primary production, where the species expanded its niche towards broader temperature ranges thanks to a higher availability of resources at both thermal extremes. In contrast, our analyses suggest that the terrestrial macro-environment poses less of a challenge for gentoo penguins than for other penguin species, perhaps due to the species’ ability to withstand a wide variation in summer temperatures. Moreover, oscillations in temperature and precipitation are less apparent across breeding sites of sister-clades north and south of the APF than changes in the marine environment. This leads us to propose that an important mechanism driving diversification of gentoo penguin lineages, on top of isolation by distance, comes from a trade-off between dispersal (gene flow) and local adaptation to the spatially changing conditions in the marine environment (isolation by environment).
Overall, in the MMRR analyses we find that the genetic distances among gentoo penguin colonies are best explained by the combined effects of geographic distance and marine environmental distance. In the case of geographic distance, this is primarily expressed through the vast longitudinal distribution of oceanic islands and continental land masses across the Southern Ocean. In the case of environmental distances this is attributed to the rapid change of water conditions due to circulation patterns of oceanic currents that occur across a short latitudinal gradient. The profound environmental gradients and long distances between genetically distinctive regional clades of P. papua suggest that the unique functional units will be faced with varying challenges in the face of climate change and as such should be evaluated separately, and not lumped together for the species as a whole.
5. CONCLUSIONS
Given ongoing processes associated with global change, gentoo penguins face more significant challenges than other penguin species in maintaining healthy population numbers. This is because gentoo penguins are resident and do not migrate to more favorable habitats after breeding, instead relying upon habitats that must supply both summer and winter needs. Gentoo penguins have comparatively limited mobility and rely
on the availability of suitable coastal areas for breeding and feeding during the reproductive season (Kowalczyk et al. 2015). In the case of the Antarctic populations, an intra-regional expansion southward may be feasible, that is currently present, but other regional populations in the sub-Antarctic islands have narrower opportunities to shift ranges and maintain their present niche. For example, gentoo penguins north of the APF (Crozet and Marion Is.) might find niche refugia only on Kerguelen Island but need to rely on their migratory capacities for this purpose. We found limited genetic migrants between populations north of the APF and Kerguelen Island, suggesting that gentoo penguins are likely to encounter severe difficulties in colonizing new areas given the pace of global change. Colonies of small size, such as gentoo penguin populations on the islands of Crozet and Marion Islands or the Macquarie Island (Fig S9) might be under greater threat than populations in Antarctica given their degree of historical isolation. Overall, gentoo penguins comprise separate lineages distributed across Antarctica and the sub-Antarctic, and the local extinction of populations (lineages) would lead to a significantly loss of biodiversity. Exploring and documenting such cryptic diversity is of critical importance before such evolutionary unique lineages are irrevocably lost. This is particularly pertinent to polar environments that are among the most rapidly changing environments on earth.
Acknowledgments
Financial support was provided by INACH RT_12–14, Fondecyt Project 1150517, GAB PIA CONICYT ACT172065, the CNPq (482501/2013-8 and 431463/2016-6) and the PROANTAR, IPEV prog 354 ETHOTAAF and by the Spanish Research Agency (CGL2004-01348, CGL2007-60369, POL2006-06635 and CTM2015-64720-R). LRP was contracted by the NICHEAPPS project (CGL2014-56416-P) and recipient of an Antarctic Science Bursary (2017-18 scheme). PA was supported by ‘Ramón y Cajal’ contract (RYC-2011-07670, MINECO-MNCN). Olga Lopez Hilzinger is thanked for graphic designs.
Data Availability
The raw VCF of ddRAD and bioclimatic/oceanographic data are available at DataDryad (https://doi.org/10.5061/dryad.s7h44j140). All gentoo penguin mtDNA sequences were
deposited in Genbank (MK804771-MK804796) and compared with the other previously published (KU514439-KU514493, KF717669–KF717743 (Vianna et al., 2017).
REFERENCES Aljanabi, S. M., & Martinez, I. (1997). Universal and rapid salt‐extraction of high quality genomic DNA for PCR‐based techniques. Nucleic Acids Res, 25(22), 4692‐4693. doi: 10.1093/nar/25.22.4692 Adamack, A. T., & Gruber, B. (2014). PopGenReport: simplifying basic population genetic analyses in R. Meth. Ecology and Evolution, 5, 384–387. doi: 10.1111/2041‐210X.12158 Assis, J., Tyberghein, L., Bosch, S., Verbruggen, H., Serrão, E. A., & De Clerck, O. (2017). Bio‐ORACLE v2.0: Extending marine data layers for bioclimatic modelling. Global Ecology and Biogeography, 27(3), 277‐284. doi: 10.1111/geb.12693 Barbosa, A., Palacios, M. J., Valera, F., & Martinez, A. (2012). Geographic variation in beak colouration in gentoo penguins Pygoscelis papua. Polar Biology. 35, 725–731. doi:10.1007/s00300‐011‐1117‐8 Bouckaert, R. R. (2010). DensiTree: making sense of sets of phylogenetic trees. Bioinformatics, 26(10), 1372‐1373. doi:10.1093/bioinformatics/btq110 Broennimann, O., Fitzpatrick, M. C., Pearman, P. B., Petitpierre, B., Pellissier, L., Yoccoz, N. G., . . . Guisan, A. (2012). Measuring ecological niche overlap from occurrence and spatial environmental data. Global Ecology and Biogeography, 21(4), 481‐497. Bryant, D., Bouckaert,k R., Felsenstein, J., Rosenberg, N. A., & RoyChoudhury, A. (2012). Inferring species trees directly from biallelic genetic markers: bypassing gene trees in a full coalescent analysis. Mol Biol Evol. 2012 Aug;29(8):1917‐32. doi: 10.1093/molbev/mss086. Catchen, J., Hohenlohe, P. A., Bassham, S., Amores, A., & Cresko, W. A. (2013). Stacks: an analysis tool set for population genomics. Molecular Ecology, 22(11), 3124‐3140. doi:10.1111/mec.12354
Charnov, E. L., & Krebs, J. R. (1974). On clutch‐size and fitness. IBIS, 116, 217‐219. doi:http://dx.doi.org/10.1007/BF00216598
Chen, Y‐C, Nazarizadeh, M., Lei F‐M, Yang, X‐J, Yao, C‐T, Dong, F., . . . Hung, C‐M. (2019). The niches of nuthatches affect their lineage evolution differently across latitude. Molecular Ecology, 28(4): 803‐817. doi: 10.1111/mec.14980 Chenuil, A., Saucede, T., Hemery, L. G., Eleaume, M., Feral, J. P., Ameziane, N., . . . Havermans, C. (2018). Understanding processes at the origin of species flocks with a focus on the marine Antarctic fauna. Biol Rev Camb Philos Soc, 93(1), 481‐504. doi:10.1111/brv.12354 Chhatre, V. E., & Emerson, K. J. (2017). StrAuto: automation and parallelization of STRUCTURE analysis. BMC Bioinformatics, 18(1), 192. doi:10.1186/s12859‐017‐1593‐0
Clucas, G. V., Younger, J. L., Kao, D., Emmerson, L., Southwell, C., Wienecke, B., . . . Hart, T. (2018). Comparative population genomics reveals key barriers to dispersal in Southern Ocean penguins. Molecular Ecology, 27(23), 4680‐4697. doi:10.1111/mec.14896
Clucas, G. V., Younger, J. L., Kao, D., Rogers, A. D., Handley, J., Miller, G. D., . . . Hart, T. (2016). Dispersal in the sub‐Antarctic: king penguins show remarkably little population genetic differentiation across their range. BMC Evol Biol, 16(1), 211. doi:10.1186/s12862‐016‐0784‐z
Cole, T. L., Ksepka, D. T., Mitchell, K. J., Tennyson, A. J. D., Thomas, D. B., Pan, H., . . . Waters, J. M. (2019). Mitogenomes Uncover Extinct Penguin Taxa and Reveal Island Formation as a Key Driver of Speciation. Mol Biol Evol, 36(4), 784‐797. doi:10.1093/molbev/msz017
Convey, P., & Peck, L. S. (2019). Antarctic environmental change and biological responses. Science Advances, 5(11), eaaz0888. doi:10.1126/sciadv.aaz0888
Crawford, A. B. (1952). The birds of Marion Island, South Indian Ocean. Emu, 52, 73‐85.
Cristofari, R., Bertorelle, G., Ancel, A., Benazzo, A., Le Maho, Y., Ponganis, P. J., . . . Trucchi, E. (2016). Full circumpolar migration ensures evolutionary unity in the Emperor penguin. Nat Commun, 7, 11842. doi:10.1038/ncomms11842 Cristofari, R., Liu, X., Bonadonna, F., Cherel, Y., Pistorius, P., Le Maho, Y., . . . Trucchi, E. (2018). Climate‐ driven range shifts of the king penguin in a fragmented ecosystem. Nature Climate Change, 8(3), 245‐251. doi:10.1038/s41558‐018‐0084‐2 Darriba, D., Taboada, G. L., Doallo, R., & Posada, D. (2012). jModelTest 2: more models, new heuristics and parallel computing. Nat Methods, 9(8), 772. doi:10.1038/nmeth.2109 De Queiroz, K. (2007). Species concepts and species delimitation. Systematic Biology, 56(6), 879‐886. doi: 10.1080/10635150701701083 de Dinechin, M., Dobson, F. S., Zehtindjiev, P., Metcheva, R., Couchoux, C., Martin, A., . . . Jouventin, P. (2012). The biogeography of Gentoo Penguins (Pygoscelis papua). Canadian Journal of Zoology‐ Revue Canadienne De Zoologie, 90(3), 352‐360. doi:10.1139/z2012‐016 Di Cola, V., Broennimann, O., Petitpierre, B., Breiner, F. T., D’Amen, M., Randin, C., . . . Guisan, A. (2017). ecospat: an R package to support spatial analyses and modeling of species niches and distributions. Ecography, 40, 774‐787.
Díaz, A., Féral, J.‐P., David, B., Saucède, T., & Poulin, E. (2011). Evolutionary pathways among shallow and deep sea echinoids of the genus Sterechinus in the Southern Ocean. Deep Sea Research II, 587, 205‐211. doi:10.1016/j.dsr2.2010.10.012
Diniz‐Filho, J. A., Loyola, R. D., Raia, P., Mooers, A. O., & Bini, L. M. (2013). Darwinian shortfalls in biodiversity conservation. Trends Ecol Evol, 28(12), 689‐695. doi:10.1016/j.tree.2013.09.003 Dimitrijevic, D., Paiva, V. H., Ramos, J. A., Seco, J., Ceia, F. R., Chipev, N., Valente, T., Barbosa, A., & Xavier, J. C. (2018). Isotopic niches of sympatric Gentoo and Chinstrap Penguins: evidence of competition for Antarctic krill? Polar Biology 41:1665‐1669. Dodino, S., Hart, T., Harris, S., & Rey, A. R. (2018). Year‐round colony attendance patterns for the Gentoo Penguin (Pygoscelis papua) at Martillo Island, Tierra del Fuego, Argentina. The Wilson Journal of Ornithology, 130(2), 493‐501.
Dray, S., Legendre, P., & Peres‐Neto, P. R. (2006). Spatial modelling: a comprehensive framework for principal coordinate analysis of neighbour matrices (PCNM). Ecological Modelling, 196(3), 483‐ 493. doi:https://doi.org/10.1016/j.ecolmodel.2006.02.015
Earl, D. A., & vonHoldt, B. M. (2012). STRUCTURE HARVESTER: a website and program for visualizing STRUCTURE output and implementing the Evanno method. Conservation Genetics Resources, 4(2), 359‐361. doi:10.1007/s12686‐011‐9548‐7
Evanno, G., Regnaut, S., & Goudet, J. (2005). Detecting the number of clusters of individuals using the software STRUCTURE: a simulation study. Mol Ecol, 14(8), 2611‐2620. doi:10.1111/j.1365‐ 294X.2005.02553.x Excoffier, L., & Lischer, H. E. (2010). Arlequin suite ver 3.5: a new series of programs to perform population genetics analyses under Linux and Windows. Mol Ecol Resour, 10(3), 564‐567. doi:10.1111/j.1755‐ 0998.2010.02847.x Ezard, T., Fujisawa, T., & Barraclough, T. (2009). splits: SPecies' LImits by Threshold Statistics. R package version 1.0‐11/r29 15: http://R‐Forge. Falla, R. A. (1937). Birds (Vol. 1): Rep. Brit., Aust., N.Z. Antarct. Res. Exped. (series B). Fick, S. E., & Hijmans, R. J. (2017). WorldClim 2: new 1‐km spatial resolution climate surfaces for global land areas. International Journal of Climatology, 37(12), 4302‐4315.