HAL Id: hal-00297730
https://hal.archives-ouvertes.fr/hal-00297730
Submitted on 31 Jan 2005HAL is a multi-disciplinary open access
archive for the deposit and dissemination of sci-entific research documents, whether they are pub-lished or not. The documents may come from teaching and research institutions in France or abroad, or from public or private research centers.
L’archive ouverte pluridisciplinaire HAL, est destinée au dépôt et à la diffusion de documents scientifiques de niveau recherche, publiés ou non, émanant des établissements d’enseignement et de recherche français ou étrangers, des laboratoires publics ou privés.
Global uptake of carbonyl sulfide (COS) by terrestrial
vegetation: Estimates corrected by deposition velocities
normalized to the uptake of carbon dioxide (CO2)
L. Sandoval-Soto, M. Stanimirov, M. von Hobe, Vivien Schmitt, J. Valdes, A.
Wild, J. Kesselmeier
To cite this version:
L. Sandoval-Soto, M. Stanimirov, M. von Hobe, Vivien Schmitt, J. Valdes, et al.. Global uptake of carbonyl sulfide (COS) by terrestrial vegetation: Estimates corrected by deposition velocities normal-ized to the uptake of carbon dioxide (CO2). Biogeosciences Discussions, European Geosciences Union, 2005, 2 (1), pp.183-201. �hal-00297730�
BGD
2, 183–201, 2005
Global terrestrial COS sink strength L. Sandoval-Soto et al. Title Page Abstract Introduction Conclusions References Tables Figures J I J I Back Close
Full Screen / Esc
Print Version Interactive Discussion EGU Biogeosciences Discussions, 2, 183–201, 2005 www.biogeosciences.net/bgd/2/183/ SRef-ID: 1810-6285/bgd/2005-2-183 European Geosciences Union
Biogeosciences Discussions
Biogeosciences Discussions is the access reviewed discussion forum of Biogeosciences
Global uptake of carbonyl sulfide (COS)
by terrestrial vegetation: Estimates
corrected by deposition velocities
normalized to the uptake of carbon
dioxide (CO
2
)
L. Sandoval-Soto1, M. Stanimirov2, M. von Hobe3, V. Schmitt4, J. Valdes5,
A. Wild4, and J. Kesselmeier1
1
Max Planck Institute for Chemistry, Biogeochemistry Dept., Joh.-J.-Becher-Weg 27, 55128 Mainz, Germany
2
University of Applied Sciences Solothurn, Institute for Automation, 4600 Olten, Switzerland
3
Research Centre J ¨ulich, Institute of Chemistry and Dynamics of the Geosphere (IGG-I), 52425 J ¨ulich, Germany
BGD
2, 183–201, 2005
Global terrestrial COS sink strength L. Sandoval-Soto et al. Title Page Abstract Introduction Conclusions References Tables Figures J I J I Back Close
Full Screen / Esc
Print Version Interactive Discussion
EGU
4
Institute for General Botany, University of Mainz, M ¨ullerweg 6, 55128 Mainz, Germany
5
National University, Atmospheric Chemistry Laboratory, 86-3000, Heredia, Costa Rica
Received: 14 January 2005 – Accepted: 26 January 2005 – Published: 31 January 2005 Correspondence to: J. Kesselmeier ([email protected])
BGD
2, 183–201, 2005
Global terrestrial COS sink strength L. Sandoval-Soto et al. Title Page Abstract Introduction Conclusions References Tables Figures J I J I Back Close
Full Screen / Esc
Print Version Interactive Discussion
EGU Abstract
COS uptake by trees, as observed under dark/light changes and under application of the plant hormone abscisic acid, exhibited a strong correlation with the CO2 assimila-tion rate and the stomatal conductance. As the uptake of COS occurred exclusively through the stomata we compared experimentally derived and re-evaluated deposition
5
velocities (Vd) for COS and CO2. We show that Vd of COS is generally significantly larger than that of CO2. We therefore introduced this attribute into a new global esti-mate of COS fluxes into vegetation. The global COS uptake by vegetation as estiesti-mated by the new model ranges between 0.69–1.40 Tg a−1, based on the Net Primary Pro-ductivity (NPP). Taking into account Gross Primary ProPro-ductivity (GPP) the deposition
10
estimate ranges between 1.37–2.81 Tg a−1 (0.73–1.50 Tg S a−1). We believe that in order to obtain accurate and reliable global NPP-based estimates for the COS flux into vegetation, the different deposition velocities of COS and CO2must be taken into account.
1. Introduction
15
Carbonyl sulfide (COS) is a substantial source for stratospheric sulfate aerosol and plays an important role in stratospheric ozone chemistry (Crutzen, 1976; Andreae and Crutzen, 1997). According to Watts (2000) and Kettle et al. (2002) total global sources and sinks are balanced within the uncertainties of the estimates. Deposition to vege-tation and soils represents the main sink for this trace gas (Logan et al., 1979; Brown
20
and Bell, 1986; Chin and Davis, 1993, 1995). Soils have been recognized as a global sink for COS only recently and the uncertainty is rather large as parameterization of the uptake has been performed with only one soil type to date (Kesselmeier et al., 1999), which clearly warrants further studies. The role of vegetation as a major global tropospheric sink for COS has been studied for 20 years and is undisputed, but the
un-25
BGD
2, 183–201, 2005
Global terrestrial COS sink strength L. Sandoval-Soto et al. Title Page Abstract Introduction Conclusions References Tables Figures J I J I Back Close
Full Screen / Esc
Print Version Interactive Discussion
EGU
the estimate of the global COS sink strength were reported. The estimate by Brown and Bell (1986) is based on the deposition velocity of COS and its atmospheric concentra-tion. Another approach is described by Chin and Davis (1993) who used the correlation between the COS deposition and the CO2assimilation, assuming the same deposition velocities for CO2and COS. Recent estimates refer to this method (Kesselmeier et al.,
5
1993; Andreae and Crutzen, 1997; Watts, 2000; Kettle et al., 2002). However, a sim-ple 1:1 relation for the uptake ratio of COS/CO2 appears insufficient as a preferential uptake of COS on a leaf as well enzymatic basis has been reported (Kesselmeier and Merk, 1993; Protoschill-Krebs et al., 1996). Therefore, we studied the stomatal uptake of COS separately. Moreover we investigated the close correlation between the rate of
10
photosynthesis and the COS uptake for several European tree species and considered the differences in deposition velocities for CO2 and COS. The observed ratios of the deposition velocities were used to improve global estimates of the COS vegetation sink based on Net Primary Production.
2. Materials and methods
15
2.1. Plant material and growth
For all experiments young trees (3–4 years old) from German and English tree nurs-eries were used. Tree species investigated were Holm oak (Quercus ilex L.), European beech (Fagus sylvatica L.), Norwegian spruce (Picea abies) and Scots pine (Pinus sylvestris). The trees were kept in 20 l pots with gardener’s compost for the years
20
1997–2000 and fertilized with commercially available fertilizer (Baumfit, Spiess-Urania, Germany). For the Mediterranean tree species Quercus ilex sand was mixed with the soil in a 1 to 2 ratio. The trees were grown in a greenhouse at 25◦C under a 12/12 h light-dark regime with a light intensity of 600 µmol m−2 s−1 of photons (PAR) and a relative humidity of 70% under 350 ppm CO2.
25
BGD
2, 183–201, 2005
Global terrestrial COS sink strength L. Sandoval-Soto et al. Title Page Abstract Introduction Conclusions References Tables Figures J I J I Back Close
Full Screen / Esc
Print Version Interactive Discussion
EGU
2.2. Purification of ambient air
Compressed air was purified by passing it (6 l min−1) through multistage gas purifica-tion system consisting of (1) silica gel (Merck, Germany), (2) molecular sieve (0.5 nm, Merck, Darmstadt), (3) charcoal (Merck,Germany), and soda lime (Merck, Germany), 3 l each. COS and CO2 mixing ratios were adjusted to desired values by mixing the
5
purified compressed air with known gas mixtures produced from a permeation device (Haunold, Germany) with COS permeation tubes (VICI Metronics, Santa Clara, Califor-nia) and CO2 from a pressurized bottle (Messer-Griesheim, Germany). All flows were regulated by mass flow controllers (MKS, Massachusetts, USA).
2.3. Enclosure system (cuvettes) and exchange measurements
10
Gas exchange of enclosed tree branches was investigated using a dynamic (flow-through) Teflon-film-cuvette system consisting of a plant measuring and an empty ref-erence cuvette with all inner surfaces made of Teflon to avoid interfref-erence with the investigated trace gases. All experiments were performed in a climate chamber with identical conditions as compared to the growth chamber. Trace gas sampling was
15
accompanied by measurements of ambient CO2, CO2 exchange and transpiration by an infra-red gas analyzer. For details see Kuhn et al. (1999, 2000) and Kuhn and Kesselmeier (2000). The enclosures were constantly flushed with 1 l min−1 of purified and conditioned ambient air (see above) which was artificially moistened (r.H. >70%) before entering the cuvettes. COS was quantified in the ppt range by an automated
20
analytical system according to Von Hobe et al. (2000) by consecutive sampling at both cuvettes. All trace gas exchange rates were calculated by concentration differences between the branch enclosing cuvette and the empty reference. Accuracy and preci-sion of the analytical system were better than 2% plus any uncertainties introduced by the cuvette sampling, mainly by the accuracy of mass flow controllers. The stomatal
25
BGD
2, 183–201, 2005
Global terrestrial COS sink strength L. Sandoval-Soto et al. Title Page Abstract Introduction Conclusions References Tables Figures J I J I Back Close
Full Screen / Esc
Print Version Interactive Discussion
EGU
2.4. Induction of stomatal closure
Stomatal closure was induced by infiltration of abscisic acid (ABA) to an oak branch cut from the tree two days before this application. The ABA treatment was performed by cutting a small branch of Quercus ilex under water (to prevent air from penetrating into the water-conducting elements) and dipping it into a nutrient solution of 1.0 mM
5
KCl, 0.1 mM NaCl , 0.1 mM CaCl2. Measurements of CO2-exchange and water vapor transpiration proved the unrestricted viability of this sample branch. ABA was applied by exchanging the nutrient solution against a fresh one containing additional 0.1 mM ABA, which was transported into the leaves by the transpiration stream. For details see Gabriel et al. (1999).
10
3. Results
3.1. Stomatal uptake
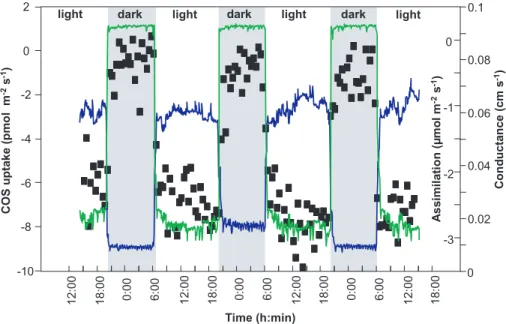
The automated analytical COS analyzer allowed a dense protocol to follow the ex-change behavior with high time resolution. Figure 1 shows the COS uptake by an enclosed branch of Fagus sylvatica (European beech) in relation to assimilation and
15
stomatal conductance over nearly three days of measurements. The COS-uptake closely followed the light/dark cycle. This behavior can be related to the calculated stomatal aperture and consequently directly compared to the exchange of CO2, i.e. net photosynthetic assimilation rate. Low uptake rates were found under dark condi-tions. As the stomata did not completely close in the dark and a respiration activity was
20
detectable, the low COS exchange may be understood as a physiological consump-tion at a lower rate. On the other hand we do not exclude fluctuaconsump-tions caused by the non-simultaneous COS sampling at the sample and reference cuvette due to switching of the automated system from one cuvette to the other. Nevertheless, a clear relation to light and stomatal aperture is obvious, though the enzymatic pathway of COS
con-25
BGD
2, 183–201, 2005
Global terrestrial COS sink strength L. Sandoval-Soto et al. Title Page Abstract Introduction Conclusions References Tables Figures J I J I Back Close
Full Screen / Esc
Print Version Interactive Discussion
EGU
sumption by carbonic anhydrase itself is generally light independent (Protoschill-Krebs et al., 1996).
The close relation between light and COS uptake in contrast to the light independent consumption by the enzyme carbonic anhydrase supports the assumption of an exclu-sively stomatal uptake pathway, as light represents a considerable trigger of stomatal
5
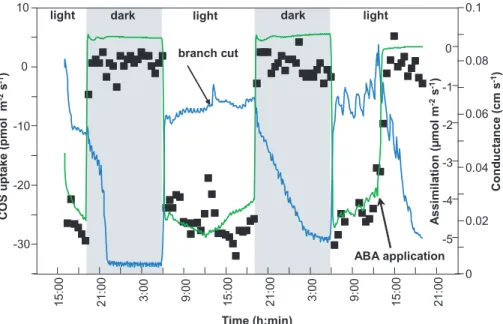
movement. The final proof for a stomatal related exchange was demonstrated by the application of abscisic acid (ABA), a plant hormone which causes stomatal closure. Treatment with ABA was performed by cutting a small branch of Quercus ilex and in-cubating the stem into a vial filled with a buffer solution. Under these conditions, the branch was performing a normal behavior of gas exchange and COS uptake (Fig. 2)
10
as followed for two light/dark episodes. In the course of the third light phase we infil-trated ABA and observed a fast decline of CO2exchange down to zero (no respiration measurable) closely accompanied by the decrease of COS uptake (Fig. 2). Stomatal conductance also showed a decrease to night values under the influence of ABA under light conditions, though with some delay which may be understood as inhomogeneous
15
stomatal apertures or slight water condensation on the cuvette walls interfering with the water vapor measurements. However, the prompt decline of assimilation to a zero-exchange of CO2under light is a most convincing argument for the strict regulation of this trace gas exchange by stomatal aperture.
3.2. Deposition velocities of COS and CO2
20
As described above, an exclusive uptake of COS via the stomatal pathway in close re-lation to the CO2exchange could be demonstrated. The simultaneous measurements of the CO2-exchange during all enclosure studies has the potential for a better quantifi-cation of the COS uptake. We could directly link the uptake rates of COS and CO2by comparing the deposition to the leaves after normalization by the ambient atmospheric
25
concentration of each trace gas, i.e. by comparing deposition velocities (Vd). The ob-tained COS and CO2 deposition velocities for F. sylvatica, Q. ilex, P. sylvestris and P. abies are summarized in Table 1. A clear preference for COS deposition is indicated
BGD
2, 183–201, 2005
Global terrestrial COS sink strength L. Sandoval-Soto et al. Title Page Abstract Introduction Conclusions References Tables Figures J I J I Back Close
Full Screen / Esc
Print Version Interactive Discussion
EGU
by the uptake ratios of Vd COS versus Vd CO2 and was found for all tree species in-vestigated. The results reflect a significantly pronounced uptake of COS over CO2by a factor between 1.4 and 3.4.
In order to widen our basis for further calculations, deposition velocities as reported in or calculated from published data sets were additionally taken into account. In some
5
cases we were able to re-estimate data on the basis of the published figures and tables. For our own data sets published recently, we calculated on the basis of the original data. The results are shown in Table 2. The Vd-ratios are sensitive to the rate of CO2 uptake taken into account. In case of enclosure measurements we used the net exchange as measured with the enclosed branch or leaf (Net Primary Productivity;
10
NPPcuvette) in order to compare with other published data. However, in case of one
data set (spruce forest, Xu et al. 2002) from flux studies above the forest, a correction might be necessary, as this flux value is representing the net exchange as a result of gross photosynthesis minus autotrophic (=NPP) and heterotrophic (soils) respiration. For the enclosure related data we found a range of Vd
COS/VdCO2 between 1.3 and 5.5
15
with the exception of 0.4 for non fertilized pea plants (Kesselmeier and Merk, 1993), 7.0 for young corn plants (Hoffmann, 1993) and 8.7–10.3 for a spruce enclosure study (Huber, 1994). These extraordinary numbers may be subject of further speculation. 3.3. Corrected estimate of a global sink strength for COS
The data presented above on the uptake of COS normalized to the net assimilation or
20
gross assimilation, respectively, allows a new global sink strength to be estimated for the vegetation (Table 3). Our calculations were based on deposition velocity (Vd) ratios of COS versus CO2fluxes according to Eq. (1).
JCOS=JCO
2× [COS]/[CO2] × VdCOS/VdCO2 (1)
with
25
JCOS global COS uptake (mol m−2 s−1) JCO
2 global CO2uptake (mol m
−2
s−1) 190
BGD
2, 183–201, 2005
Global terrestrial COS sink strength L. Sandoval-Soto et al. Title Page Abstract Introduction Conclusions References Tables Figures J I J I Back Close
Full Screen / Esc
Print Version Interactive Discussion
EGU
[COS] atmospheric COS mixing ratio (mol m−3) [CO2] atmospheric CO2mixing ratio (mol m−3) Vd
COS COS deposition velocity (m s
−1
) Vd
CO2 CO2deposition velocity (m s
−1
).
For global CO2fluxes we considered net primary productivity (NPP). NPP dry matter
5
data according to Whittaker and Likens (1975) and Lieth (1975) were recalculated to NPP carbon according to Larcher (1994). Based on our observations of different depo-sition velocities we assigned ecotype related Vd-ratios and recalculated the COS sinks adequately. For each ecotype we tried to take into account the exchange behavior of typical plant species. Based on our compilation in Table 2 we were able to assign a
10
Vd-ratio for each ecotype except for “Extreme desert” and “Swamp and marsh”. In-stead a best guess was used. The results show that tropical and boreal forests, as well as savannas, are of highest significance for a global estimate of the vegetation sink strength. A ranking of ecotype-significance for the global budget shows that trop-ical rainforest contributes most, followed by troptrop-ical seasonal forest, savannah, boreal
15
forest, cultivated land, temperate deciduous and evergreen forest, to an overall NPP based total COS sink strength of 0.686–1.404 Tg a−1.
4. Discussion
The close relation of COS uptake to photosynthesis and the clear consumption pathway via stomatal uptake allowed a recalculation of the COS uptake by terrestrial vegetation.
20
We regard this Vd-ratio-corrected estimate of the COS sink strength to be necessary when estimating a COS sink strength from NPP and regard earlier estimates not tak-ing such a correction into account as to be too low. Furthermore, it has to be kept in mind, that this estimate is based on a NPP related CO2 deposition according to Whittaker and Likens (1975). This NPP value represents only around 50% of the total
25
respira-BGD
2, 183–201, 2005
Global terrestrial COS sink strength L. Sandoval-Soto et al. Title Page Abstract Introduction Conclusions References Tables Figures J I J I Back Close
Full Screen / Esc
Print Version Interactive Discussion
EGU
tion by the photoautotrophic biological organism itself, has been subtracted from the Gross Primary Productivity (GPP). In contrast, the data resulting from the enclosure measurements represent a net exchange based on the gross uptake of CO2minus the respiration of the leaves and some branches only. This loss is small as compared to the overall respiration of a whole tree with stem and roots. Hence, in a first attempt we
5
doubled the number for the COS sink in order to relate to the real gross CO2flux which was the basis for the NPP calculated by Whittaker and Likens (1975). This correction leads to an estimate of a COS sink strength between 1.372–2.808 Tg a−1, equivalent to 0.732–1.498 Tg a−1on a sulfur basis.
Table 4 gives an overview, comparing the different estimates as reported within the
10
last years. Different procedures have been used based on several parameters such as atmospheric COS concentration, deposition velocity, leaf and ground area as well as the relation of COS deposition to the uptake of CO2. The highest estimates between 2 and 5.6 Tg a−1were calculated not taking into account the close relation to CO2 as-similation, thus excluding any diurnal and seasonal effect. Much lower values, between
15
0.2 and 1.0 Tg a−1, supported by a modeling study with similar low estimates (Kettle et al., 2002), were obtained by relating the deposition of COS to the CO2 assimilation data bases. The latter group, however, did not take into account the preferred uptake and enzymatic consumption of COS as related to the CO2assimilation. Including such a preference by correction with the deposition velocity ratios, the new data presented
20
here show that this new procedure results in a significant increase of the COS sink strength calculation again, as productivity, seasonality as well as the preferred uptake is taken into account.
Nevertheless, uncertainties remain large and depend on a still limited data set. Based on a set of enclosure studies we report the net uptake of CO2in relation to the
25
net uptake of COS. However, under normal atmospheric concentrations of both gases this means to compare the one-directional COS uptake and consumption with the bi-directional exchange of CO2, i.e. COS gross uptake with CO2net uptake. This causes an unknown uncertainty as this number is highly dependent on the actual respiration
BGD
2, 183–201, 2005
Global terrestrial COS sink strength L. Sandoval-Soto et al. Title Page Abstract Introduction Conclusions References Tables Figures J I J I Back Close
Full Screen / Esc
Print Version Interactive Discussion
EGU
rates. A better way would be to relate to gross primary production, i.e. gross photo-synthesis. To achieve this goal we need exchange studies covering longer episodes and day/night studies in order to estimate autotrophic respiration for enclosure studies and autotrophic plus heterotrophic respiration for flux studies. Furthermore, we need a better experimental data set especially for tropical and boreal forest trees, as both
5
ecotypes may represent a dominant contribution to the global terrestrial sink strength for COS.
Acknowledgements. We acknowledge the financial support of L. Sandoval-Soto by DAAD as
well as the fundamental support by the Max Planck Society in the course of the PhD-studies of L.S.-S. The authors thank J. Williams for his help with the manuscript.
10
References
Andreae, M. O. and Crutzen, P. J.: Atmospheric aerosols – Biogeochemical sources and role in atmospheric chemistry, Science, 276, 1052–1058, 1997.
Brown, K. A. and Bell, J. N. B.: Vegetation – the missing sink in the global cycle of carbonyl sulfide (COS), Atmos. Environment, 20, 537–540, 1986.
15
Chin, M. and Davis, D. D.: Global sources and sinks of OCS and CS2 and their distribution,
Global Biogeochem. Cycles, 7, 321–337, 1993.
Chin, M. and Davis, D. D.: A reanalysis of carbonyl sulfide as a source of stratospheric back-ground sulfur aerosol, J. Geophys. Res., 100, 8993–9005, 1995.
Crutzen, P. J.: The possible importance of CSO for the sulfate layer of the stratosphere,
Geo-20
phys. Res. Lett., 3, 73–76, 1976.
Gabriel, R., Sch ¨afer, L. Gerlach, C., Rausch, T., and Kesselmeier, J.: Factors controlling the emissions of volatile organic acids from leaves of Quercus ilex L. (Holm oak), Atmos. Envi-ronment, 33, 1347–1355, 1999.
Goldan, P. D., Fall, R., Kuster, W. C., and Fehsenfeld, F. C.: Uptake of COS by growing
vege-25
tation – a major tropospheric sink, J. Geophys. Res.-Atmospheres, 93, D11, 14 186–14 192, 1988.
BGD
2, 183–201, 2005
Global terrestrial COS sink strength L. Sandoval-Soto et al. Title Page Abstract Introduction Conclusions References Tables Figures J I J I Back Close
Full Screen / Esc
Print Version Interactive Discussion
EGU und Atmosph ¨are: Interpretation von Versuchen im Freiland in Verbindung mit
mechanistis-chen Experimenten im Labor, Dissertation, Fachbereich Biologie, Universit ¨at Mainz, 1993.
Huber, B.: Austausch fl ¨uchtiger Schwefelverbindungen in land- und forstwirschaftlichen
¨
Okosystemen, Dissertation Techn. Univ. M ¨unchen, 1993. Schriftenreihe des Fraunhofer-Instituts f ¨ur Atmosph ¨arische Umweltforschung, Bd 26, Wissenschaftsverlag Dr. W. Maraun,
5
Frankfurt/M, ISBN 3-927548-65-0, 1994.
Kesselmeier, J. and Merk, L.: Exchange of carbonyl sulfide (COS) between agricultural plants and the atmosphere: Studies on the deposition of COS to peas, corn and rapeseed, Biogeo-chemistry, 23, 47–59, 1993.
Kesselmeier, J., Meixner, F. X., Hofmann, U., Ajavon, A., Leimbach, St., and Andreae, M. O.:
10
Reduced sulfur compound exchange between the atmosphere and tropical tree species in southern Cameroon, Biogeochemistry, 23, 23–45, 1993.
Kesselmeier, J., Teusch, N., and Kuhn, U.: Controlling variables for the uptake of atmospheric carbonyl sulfide (COS) by soil, J. Geophys. Res.-Atmospheres, 104, D9, 11 577–11 584, 1999.
15
Kettle, A. J., Kuhn, U., von Hobe, M., Kesselmeier, J., and Andreae, M. O.: The Global Budget of Atmospheric Carbonyl Sulfide: Temporal and Spatial Modulation of the Dominant Sources and Sinks, J. Geophys. Res., 107, D22, 4658, 2002, doi:10.1029/2002JD002187.
Kluczewski, S. M., Brown, K. A., and Bell, J. N. B.: Deposition of S-35-Carbonyl Sulfide to vegetable crops, Radiation Protection Dosimetry, 11, 3, 173–177, 1985.
20
Kuhn, U., Wolf, A., Ammann, C., Meixner, F. X., Andreae, M. O., and Kesselmeier, J.: Carbonyl sulfide exchange on an ecosystem scale: Soil represents a dominant sink for atmospheric COS, Atmos. Environm., 33, 995–1008, 1999.
Kuhn, U., Gries, C., Nash III, T. H., and Kesselmeier, J.: Field measurements on the exchange of carbonyl sulfide between lichens and the atmosphere, Atmos. Environ., 34, 28, 4867–
25
4878, 2000.
Kuhn, U. and Kesselmeier, J.: Environmental parameters controlling the uptake of carbonyl sulfide by lichens, J. Geophys. Res., 105, 22, 26 783–26 792, 2000.
Larcher, W.: ¨Okophysiologie der Pflanzen, 5. Auflage, Eugen Ulmer Verlag, Stuttgart, 129,
1994.
30
Lieth, H.: Modeling the primary productivity of the world, in: Primary productivity of the bio-sphere, edited by Lieth, H. and Whittaker, R. H., Springer Verlag, Berlin, 237–283, 1975.
Logan, J. A., McElroy, M. B., Wofsy, S. C., and Prather, M. J.: Oxidation of CS2 and COS:
BGD
2, 183–201, 2005
Global terrestrial COS sink strength L. Sandoval-Soto et al. Title Page Abstract Introduction Conclusions References Tables Figures J I J I Back Close
Full Screen / Esc
Print Version Interactive Discussion
EGU
Sources for atmospheric SO2, Nature, 281, 185–188, 1979.
Pearcy, R. W., Schulze, E. D., and Zimmermann, R.: Measurement of transpiration and leaf conductance, in: Plant Physiological Ecology, Chapman and Hall, New York, 141–142, 1989. Protoschill-Krebs, G., Wilhelm, C., and Kesselmeier, J.: Consumption of carbonyl sulfide by carbonic anhydrase (CA) isolated from Pisum sativum, Atmos. Environm., 30, 3151–3156,
5
1996.
Servant, J.: Les sources et les puits d’oxysulfure de carbone (COS) a l’echelle mondiale, At-mos. Res.. 23, 105–116, 1989.
Taylor, G. E., McLaughlin S. B., Shriner D. S., and Selvidge W. J.: The flux of sulfur containing gases to vegetation, Atmos. Environm., 17, 789–796, 1983.
10
Von Hobe, M., Kenntner, T., Helleis, F. H., Sandoval-Soto, L., and Andreae, M. O.: Cryo-genic Trapping of Carbonyl Sulfide without Using Expendable Cryogens, Analytical Chem-istry, doi10.1021/ac00058fCCC, 2000.
Watts, S. F.: The mass budgets of carbonyl sulfide, dimethyl sulfide, carbon disulfide and hy-drogen sulfide, Atmos. Environm., 34, 761–779, 2000.
15
Whittaker, R. H. and Likens, G. E.: The biosphere and man, in: The Primary Productivity of the Biosphere, edited by Lieth, H. and Whittaker, R. H., Springer Verlag, New York, 305–328, 1975.
Xu, X., Bingemer, H. G., and Schmid, U.: The flux of carbonyl sulfide and carbon disulfide between the atmosphere and a spruce forest, Atmospheric Chemistry and Physics, 2, 171–
20
181, 2002,
BGD
2, 183–201, 2005
Global terrestrial COS sink strength L. Sandoval-Soto et al. Title Page Abstract Introduction Conclusions References Tables Figures J I J I Back Close
Full Screen / Esc
Print Version Interactive Discussion
EGU Table 1. Leaf area based exchange and deposition velocities (Vd) of COS and CO2for Fagus
sylvatica and Quercus ilex, growing under 350 ppm CO2over 2–3 years. Three tree individuals
(T1–T3) were grown and investigated. COS-exchange data were obtained under an
atmo-spheric COS mixing ratio of 600 ppt. Pinus sylvestris and Picea abies were only measured in one year.
Plant Species COS Uptake
(pmol m-2 s-1 ) ± SD Vd COS (mm s-1 ) ± SD (n) CO2 Uptake (µmol m-2 min-1 ) ± SD Vd CO2 (mm s-1 ) ± SD (n) Vd COS / Vd CO2 F. sylvatica T1 13.8 4.8 0.551 0.211 19 171 12 0.199 0.022 >57 2.77 (1.54 – 4.31) Summer 1998 T2 12.5 3.0 0.441 0.168 21 193 8 0.225 0.021 >51 1.96 (1.11 – 2.99) T3 12.3 4.7 0.429 0.226 36 238 7 0.277 0.025 >69 1.55 (0.67 – 2.60) F. sylvatica T1 21.7 4.8 0.873 0.217 28 317 29 0.370 0.046 >84 2.36 (1.58 – 3.36) Summer 1999 T2 26.1 13.7 1.105 0.486 33 332 27 0.387 0.046 >99 2.86 (1.43 – 4.67) T3 19.1 8.5 0.994 0.268 43 354 25 0.290 0.078 >129 3.43 (1.97 – 5.95) F. sylvatica T1 11.3 5.1 0.460 0.221 54 204 6 0.238 0.022 >162 1.93 (0.92 – 3.15) Fall 1999 T2 11.5 6.4 0.470 0.271 71 241 17 0.281 0.031 >213 1.67 ( 0.64 – 2.96) T3 14.1 0.5 0.575 0.094 99 201 5 0.234 0.021 >297 2.46 (1.89 – 3.14) Q. ilex T1 15.1 6.9 0.612 0.279 27 283 44 0.330 0.059 >81 1.86 (0.86 – 3.29) Summer 1998 T2 12.9 4.9 0.542 0.210 50 197 14 0.229 0.026 >150 2.37 (1.30 – 3.70) T3 14.8 6.4 0.679 0.189 19 180 9 0.210 0.021 >57 3.23 (2.12 – 4.59) Q. ilex T1 16.4 4.6 0.751 0.166 33 347 25 0.404 0.045 >99 1.86 (1.30 – 2.55) Summer 1999 T2 14.4 2.7 0.514 0.164 44 308 22 0.359 0.040 >152 1.43 (0.88 – 2.13) T3 15.4 3.4 0.700 0.113 29 318 17 0.371 0.037 >87 1.89 (1.44 – 2.43) Q. ilex T1 25.8 2.1 0.673 0.372 120 179 16 0.208 0.026 >360 3.24 (1.29 – 5.74) Winter 1999/2000 T2 25.1 1.5 0.575 0.263 81 318 17 0.371 0.037 >243 1.55 (0.76 – 2.51) T3 23.1 2.5 0.733 0.219 94 289 23 0.336 0.039 >282 2.18 (1.37 – 3.21) P. sylvestris Fall 2002 T1 21.1 1.7 0.743 0.035 23 298 22 0.427 0.021 >69 1.74 (1.58 – 1.92) P. abies Fall 2002 T1 12.6 1.7 0.435 0.060 43 275 20 0.459 0.023 >129 0.95 (0.78 – 1.14) 196
BGD
2, 183–201, 2005
Global terrestrial COS sink strength L. Sandoval-Soto et al. Title Page Abstract Introduction Conclusions References Tables Figures J I J I Back Close
Full Screen / Esc
Print Version Interactive Discussion
EGU Table 2. Carbonyl sulfide (COS) deposition velocities (Vd) and normalized net uptake as
ex-pressed in the Vd – ratio of COS and CO2. Data as obtained in the course of this study by
measurements and recalculations from published data compared to available literature values.
Plant species COS deposition velocity Normalized relation COS/CO2 net uptake (VdCOS/VdCO2) Atmospheric
concentration Remarks Reference
(mm s-1
) (ppt)
CROPS
Allium cepa 0.29 – 0.35 4000 Lab.. light. encl. 1 Brassica campestris ssp. 0.47 – 0.56 4000 Lab.. light. encl. 1 Brassica napus 1.24 1.25 50 – 300 Lab.. light. encl. 7 Brassica oleracea ssp. 0.46 – 0.52 4000 Lab.. light. encl. 1
Glycine max 3.1 2000 Lab.. light. encl. 2
Glycine max 0.71 500 Lab.. light. encl. 3
Lactuca sativa 0.25 – 0.35 4000 Lab.. light. encl. 1
Lolium perenne 0.78 4000 Lab.. light. encl. 1
Lycopersicon esculentum 0.4 2000 Lab.. light. encl. 2
Medicago sativa 1.6 500 Lab.. light. encl. 3
Phaseolus vulgaris 1.4 2000 Lab.. light. encl. 2 Pisum sativum. non fert. 0.2 0.4 300 – 900 Lab.. light. encl. 7 Pisum sativum. fert. 1.1 3.8 300 – 900 Lab.. light. encl. 7 Pisum sativum. fert. 1.03&
3.1&
820 Lab.. light. encl 8
Raphanus sativus 0.57 4000 Lab.. light. encl. 1 Spinacia oleracea 0.4 4000 Lab.. light. encl. 1 Triticum aestivum 1.54 500 Lab.. light. encl. 3 Triticum aestivum (10 d) 1.08&
3.2&
360 Lab.. light. encl 8
Zea mays 1.14 500 Lab.. light. encl. 3
Zea mays 0.69 2.85 100 – 900 Lab.. light. encl. 7 Zea mays (9-12 d) 2.36&
7.0&
740 Lab.. light. encl. 8
TREES
Fagus sylvatica 0.66 ± 0.26 2.33 ± 0.62 600 Lab.. light. encl. This work Picea abies 0.4 – 1.8 <7§
atmospheric Field. light. REA 4
Picea abies 0.26 (0.5 max) 8.7 – 10.3&
300 – 650 Field. light. encl. 6
Picea abies 0.46± 0.023 0.95 700 Lab.. light. encl. This work Pinus sylvestris 0.43 ± 0.021 1.74 700 Lab.. light. encl. This work Porterandia cladantha 0.23 (max) 2.37§§
400 – 600 Field. light. encl. 9
Quercus agrifolia 0.44§
1.8§
300 – 500 Field. light. encl. 5
Quercus ilex 0.64 ± 0.09 2.18 ± 0.66 600 Lab.. light. encl. This work Sacoglottis gabonensis 0.04§§
1.74§§
400 – 600 Field. light. encl. 9
Sacoglottis gabonensis 0.09§§
5.49§§
400 – 600 Field. light. encl. 9
Note: No correction was applied to take into account the decrease of the measured net CO2 exchange by
respiration (Net uptake). Hence, considering a gross photosynthetic uptake by increasing the CO2 uptake
can lead to significantly reduced values for the normalized COS/CO2-uptake in case of data obtained by
flux studies above the forest with the influence of stem and soil respiration.
§
recalculated based on published fluxes and atmospheric mixing ratios of 500 ppt for COS and 350 ppm
for CO2
§§
recalculated considering maximal Vd -values only
&
calculated on actual data as given in the paper
Literature cited: 1 Kluczewski et al. (1985); 2Taylor et al. (1983); 3 Goldan et al. (1988); 4 Xu et al.(2002);
5
Kuhn et al. (1999); 6
Huber (1994); 7
Kesselmeier and Merk (1993); 8
Hofmann (1993); 9
Kesselmeier et al. (1993).
BGD
2, 183–201, 2005
Global terrestrial COS sink strength L. Sandoval-Soto et al. Title Page Abstract Introduction Conclusions References Tables Figures J I J I Back Close
Full Screen / Esc
Print Version Interactive Discussion
EGU Table 3. Estimate of global sink strength for carbonyl sulfide (COS) based on deposition velocity
(Vd) ratios of COS versus CO2of typical plant species and net primary productivity (NPP). NPP
dry matter data according to Whittaker and Likens (1975) and Lieth (1975) recalculated to NPP carbon according to Larcher (1994).
Ecosystem type Area (106 km²) NPP dry matter (g m-² a-1) NPP dry matter (109 t a-1) NPP C (1015 g a-1) NPP CO2 (1015 g/a) Vd ratios COS / CO2 min – max FCOS Tg /a min - max
Plant species related Vd
assigned (see Table 2)
Tropical rain forest 17 2200 37.40 16.46 60.34 1.7 – 3.6 0.246 – 0.508 S. gabonensis. P. cladantha
Tropical seasonal forest 7.5 1600 12.00 5.28 19.36 1.7 – 3.6 0.079 – 0.163 S. gabonensis. P. cladantha
Temperate evergreen forest 5 1300 6.50 2.86 10.49 1.5 – 2.9 0.037 – 0.071 Q. ilex, Q. agrifolia
Temperate deciduous forest 7 1200 8.40 3.70 13.55 1.7 – 3.0 0.054 – 0.095 F. sylvatica
Boreal forest 12 800 9.60 4.22 15.49 1 – 1.7 0.036 – 0.063 P. sylvestris P. abies Woodland and scrubland 8.5 700 5.95 2.62 9.60 1.5 – 2.9 0.034 – 0.065 Q. ilex, Q. agrifolia
Savannah 15 900 13.50 5.94 21.78 1.5 – 2.9 0.076 – 0.148 Q. ilex, Q. agrifolia
Temperate grassland 9 600 5.40 2.38 8.71 2.0 – 3.0 0.041 – 0.061 Z. mays, T. aestivum
Tundra and alpine 8 140 1.12 0.49 1.81 2.0 – 3.0 0.008 – 0.013 best guess
Desert and semi desert scrub 18 90 1.62 0.71 2.61 1.5 – 2.9 0.009 – 0.018 Q. ilex, Q. agrifolia
Extreme desert, rock, sand, ice 24 3 0.07 0.03 0.12 1.0 – 3.0 0.000 – 0.001 best guess
Cultivated land 14 650 9.10 4.00 14.68 1.3 – 3.8 0.043 – 0.130
Z. mays, T. aestivum, B. Napus, P. sativum
Swamp and marsh 2 3000 6.00 2.64 9.68 1.0 – 3.0 0.023 – 0.068 best guess
TOTAL 0.686 – 1.404
BGD
2, 183–201, 2005
Global terrestrial COS sink strength L. Sandoval-Soto et al. Title Page Abstract Introduction Conclusions References Tables Figures J I J I Back Close
Full Screen / Esc
Print Version Interactive Discussion
EGU Table 4. Estimates of the global COS sink strength for terrestrial vegetation.
Tg a-1 Source Parameters considered
2 – 5 Brown and Bell (1986) Vatmospheric conc. d, LAI, Area, COS
5.6 Servant (1989) Vatmospheric conc. d, LAI, Area, COS
0.2 – 0.6 Goldan et al. (1988)
RCOS = RCO2
atmospheric conc. CO2 uptake
0.93 ± 0.07 Kesselmeier and Merk. (1993)
Vd COS = Vd CO2
atmospheric ratios CO2 uptake
0.16 – 0.91 Chin and Davis (1993)
Vd COS = Vd CO2 atmospheric ratios CO2 uptake 0.56 ± 0.1 Watts (2000) Vd COS = Vd CO2 atmospheric ratios CO2 uptake 0.21 – 0.27 Kettle et al. (2002)
Surface flux model Vd COS = Vd CO2 atmospheric ratios CO2 uptake 1.37 – 2.81 This work Vd COS > Vd CO2 atmospheric ratios CO2 uptake
BGD
2, 183–201, 2005
Global terrestrial COS sink strength L. Sandoval-Soto et al. Title Page Abstract Introduction Conclusions References Tables Figures J I J I Back Close
Full Screen / Esc
Print Version Interactive Discussion EGU -10 -8 -6 -4 -2 0 2 12: 00 18: 00 0: 00 6: 00 12: 00 18: 00 0: 00 6: 00 12: 0 0 18: 00 0: 00 6: 00 12: 0 0 18: 00 0 0.02 0.04 0.06 0.08 0.1 COS u p take (p mo l m -2 s -1) C o nd uct a nce (cm s -1) A s s imila ti on ( µ mo l m -2 s -1) -3 -2 -1 0
dark light dark light
light dark light
Time (h:min)
Sandoval et al. Fig.1
Fig. 1. Exchange (negative=uptake) of carbonyl sulfide (COS, filled squares) in relation to
branch conductance (blue line) and CO2 exchange (green line) for European beech (Fagus
sylvatica L.).
BGD
2, 183–201, 2005
Global terrestrial COS sink strength L. Sandoval-Soto et al. Title Page Abstract Introduction Conclusions References Tables Figures J I J I Back Close
Full Screen / Esc
Print Version Interactive Discussion EGU -30 -20 -10 0 10 15: 00 21: 0 0 21: 00 3: 00 9: 00 15: 0 0 21: 0 0 3: 00 9: 00 15: 0 0 0 0.02 0.04 0.06 0.08 0.1 -5 -4 -3 -2 -1 0 A s s imila ti o n ( µ mo l m -2 s -1) branch cut ABA application
dark light dark light
light COS u p take (pmol m -2 s -1) C ond uct a nce (cm s -1) Time (h:min)
Sandoval et al. Fig.2
Fig. 2. Exchange (negative=uptake) of carbonyl sulfide (COS. filled squares) in relation to
branch conductance (blue line) and CO2exchange (green line) for Holm oak (Quercus ilex L.).