The Application of Failure
Mode and Effect Analysis to Evaluate Risks Associated
with Outsourcing Decisions
By
Jacquelyn M Nowicke
SUBMITTED TO THE DEPARTMENT OF MECHANICAL ENGINEERING IN PARTIAL FULFILLMENT OF THE REQUIREMENTS FOR THE DEGREE OF
BACHELOR OF SCIENCE IN MECHANICAL ENGINEERING AT THE
MASSACHUSETTS INSTITUTE OF TECHNOLOGY
JUNE 2008
© Jacquelyn M Nowicke. All Rights Reserved.
The author hereby grants to MIT permission to reproduce
and distribute publicly paper and electronic
copies of this thesis document in whole or in part
in any medium now known or hereafter created.
Signature of Author: (
Deparinent of Mech ical Engineering
May 9, 2008 Certified by:C
/
Warren P SeeringCytýirector of Leaders for Manufacturing Program Thesis Supervisor Accepted by:
John H. Leinhard V
Professor of Mechanical EngineeringMASSACHLSS Chairman, Undergraduate Thesis Commitee
AUG 1 2008
ARCH
The Application of Failure Mode and Effect Analysis to Evaluate Risks Associated
with Outsourcing Decisions
by
Jacquelyn M Nowicke
Submitted to the Department of Mechanical Engineering on May 9, 2008 in partial fulfillment of the requirements for the Degree of Bachelor of Science in
Mechanical Engineering ABSTRACT
The goal of this thesis is to develop a tool for analyzing the risks associated with outsourcing decisions for corporations. The thesis explores the current methods of choosing suppliers to outsource, as well as issues and risks that need to be considered in the decision. A need arose for a tool to standardize the process of choosing a supplier and help the decision team consider more aspects than the bid price.
This need gave the opportunity to develop a tool based on Failure Mode and Effect Analysis (FMEA). The typical FMEA was researched and analyzed for its ability to be an effective tool in outsourcing risk decisions. Small alterations on the typical FMEA were made to provide a relevant tool to analyze outsourcing risks. This new process, deemed Outsourcing Risk FMEA, was described in detail.
The Outsourcing Risk FMEA was put to the test through a case study. The case study analyzed Boeing Commercial Airline's 2003 decision to outsource a section of its 737 Vertical Fin production to Korea Aerospace Industries. This study provided an example of how the analysis could be applied. Further research into the proof of the analysis's effectiveness is necessary. This research can be conducted by receiving feedback from teams using this analysis in their outsourcing decisions. The feedback would then be used to improve the process. Outsourcing Risk FMEA provides a structured, standard solution to the problem of analyzing the risks associated with outsourcing.
This thesis was performed in conjunction with Leaders for Manufacturing graduate student Victor Mroczkowski's MBA and MS thesis.
Thesis Supervisor: Warren P Seering
ACKNOWLEDGEMENTS
I would like to take this page to acknowledge a few important people who have helped
me in the process of writing and completing this thesis. First and foremost, I would like to thank Prof. Warren Seering for his time and dedication. Prof. Seering was a huge help to me, first by
providing me with networking resources to find a thesis, and then as my advisor. Throughout the
process of finding my thesis, Prof. Seering stressed the importance that I find something that I
was interested in and passionate about, both engineering and management. After finding a
project I like, Prof. Seering graciously came on board as my advisor, even though he had no
connections with the project previously. While writing my thesis, Prof. Seering was a
motivating force in guiding me through the process of organizing my thoughts and findings. I am
greatly indebted to him for making this project possible.
I would also like to thank Victor Mroczkowski. As a graduating student in the Leaders
for Manufacturing program, Victor had a full schedule this term and his own thesis to write.
When I approached him about a possible project for myself, he willingly carved out a topic I
could research and develop from his own thesis. I thank him for his time and energy in
providing me with the opportunity to explore my interests in this thesis.
Finally, I would like to thank Pedzi Makumbe for his insight into my project. Pedzi
provided a wealth of knowledge into the outsourcing field, and willingly shared his findings for
his own thesis. He took time out of his schedule to provide feedback, suggestions and expertise
on my progress.
TABLE OF CONTENTS ACKNOWLEDGEMENTS ... 5 TABLE OF CONTENTS... 7 TA B LE O F FIG U RE S ... 11 1 IN TR O D U CTIO N ... 13 1.1 Outsourcing ... 13
1.1.1 Definition of Outsourcing and Process ... ... ... 13
1.1.2 Issues to Consider while Outsourcing... 14
1.1.3 Risks Resulting from Outsourcing ... 15
1.2 Importance of Issues and Risks in Outsourcing Decisions ... 16
1.3 Motivation for This Study... 17
1.4 Thesis O utline ... 17
2.1 Typical FM EA ... 18
2.1.1 Definition of FMEA... 18
2.1.2 Step 1: Assemble a Team... 18
2.1.3 Step 2: Complete Header of FMEA Worksheet ... ... . 19
2.1.4 Step 3: Identify Design Functions... 19
2.1.5 Step 4: Identify All Possible Failure Modes for Each Function ... 20
2.1.6 Step 5: Identify Potential Effects of the Failure Modes... .. 20
2.1.7 Step 6: Critical Characteristics... 20
2.1.8 Step 7: Severity Rating (S) ... 20
2.1.9 Step 8: Identify Potential Causes for Failure Modes ... 21
2.1.10 Step 9: Occurrence Rating (0)... 21
2.1.11 Step 10: Existing Control Mechanisms for Failure Modes... . 22
2.1.12 Step 11: Detection (D) ... . 22
2.1.13 Step 12: Risk Priority Number (RPN) ... ... 23
2.1.14 Step 13: Recommended Action ... 24
2.1.15 Step 14: Assign Responsible Person/Target Date... ... 24
2.1.16 Step 15: Action Taken ... 24
2.2 Current FM EA applications ... 24 2.2.1 Product/Design FM EA ... ... 24 2.2.2 System /Concept FM EA ... ... 25 2.2.3 Process FM EA ... ... 25 2.2.4 Application FM EA ... ... 25 2.2.5 Service FM EA ... ... 26 2.2.6 M achine FM EA ... 26
2.3 Boeing's Outsourcing Plan ... ... 26
2.3.1 Current Plan ... 26
2.3.2 Risk Tools ... 26
2.4 Potential of FMEA as Tool for Analyzing Outsourcing Risks ... . 27
2.4.1 Advantages... 27
2.4.2 Disadvantages ... 28
2.4.3 Current Ideas in this Area ... 28
3 DEVELOPM EN T OF OUTSOURCIN G RISK FM EA ... 30
3.1 Existing FM EA versus New FM EA ... 30
3.1.1 Existing FM EA ... 30
3.1.2 N ew FM EA ... 31
3.2 Development of Outsourcing Risk FMEA ... 31
3.2.1 Decision ... 31
3.2.2 Criteria ... ... 31
3.2.3 Process ... ... ... 32
3.3.1 Step 1: Gather Team ... ... 34
3.3.2 Step 2: Identify Issues ... ... 35
3.3.3 Step 3: Identify Risks... ... 36
3.3.4 Step 4: Identify Causes of Risks ... ... 37
3.3.5 Step 5: Identify Effects if Risk Occurs ... ... 38
3.3.6 Step 6: Severity Rating (S) ... 39
3.3.7 Step 7: Occurrence Rating (0)... 40
3.3.8 Step 8: Detection Rating (D)... 41
3.3.10 Step 10: Prioritize ... ... 42
3.3.11 Step 11: Plan of A ction... ... 43
3.3.12 Step 12: Analyze Feasibility ... 44
3.3.13 Step 13: Review Analysis ... ... 45
3.4 How to Use Results of Analysis ... 45
4 CASE STUDY: BOEING 737 VERTICAL FIN... .... ... 46
4.1 Background of Case... 46
4.2 Issues in Case ... ... 46
4.3 Risks Associated with Issues and the Logic for their Severity, Occurrence and Detection R ating ... 49
4.3.1 Better Fabrication Technology Emerges ... ... 49
4.3.2 KAI Does Not Produce Correct Parts RPN = 100 ... ... 49
4.3.3 KAI Unable to Handle Complexity ... 49
4.3.4 KAI Does Not Have the Capabilities to Produce... ... 50
4.3.5 KAI's Downstream Supply Base Fails ... ... 50
4.3.6 Competitive Pricing for Product Makes Manufacturing Unaffordable ... 50
4.3.7 Customers Do Not Want Outsourced Parts ... ... 50
4.3.8 Korea Shuts Production Down... 51
4.3.9 KAI Cannot Meet Demand for Product ... ... 51
4.3.10 KAI Production Time Increases... 51
4.3.11 Batch of Parts Does Not Meet Design Specifications ... 51
4.3.12 KAI Fails to Deliver On Time ... 52
4.3.13 KAI Does Not Have the Resources to Produce ... ... 52
4.3.14 Costs Increase Quickly ... 52
4.3.15 New Tariff Raised on Imported Goods... 52
4.3.16 KAI Deliberately Underperforms ... 53
4.3.17 KAI Goes Bankrupt ... 53
4.3.18 Intellectual Property is Stolen... 53
4.3.19 O il Prices Increase ... . 53
4.4 Discussion of Feasibility... 54
4.5 Reflection on Case Study ... . 54
5 .1 F uture P lan s ... 55 5.2 B enefits to B oeing... 55 5.3 R eflection on Learning ... ... 56 5.3.1 FM EA and Outsourcing ... ... 56 5.3.2 Accomplishment ... ... ... 56 5.4 Sum m ary ... 56 R E FE R EN C E S ... 59
APPENDIX A: SAMPLE RISKS AND QUESTIONS ASKED IN DEVELOPMENT OF A N A LY SIS ... 61
APPENDIX B: TEMPLATES FOR PRIORIZATION AND MITIGATION TABLES ... 62
APPENDIX C: INSTRUCTIONS FOR USING OUTSOURCING RISK FMEA ... 64
APPENDIX D: COMPLETED PRIORITIZATION AND MITIGATION TABLES FOR BOEING 737 VERTICAL FIN CASE STUDY ... 67
TABLE OF FIGURES
Figure 1. Example of Design FMEA Worksheet (Dyadem 11-10) ... . 19
Figure 2. Example of Detection Criteria for Design FMEA (Stamatis 141) ... 21
Figure 3. Example of Occurrence Criteria for Design FMEA (Stamatis 144) ... 22
Figure 4. Example of Detection Criteria for Design FMEA (Stamatis 149) ... 23
Figure 5. Author's Example of Boeing's Risk Analysis... ... 27
Figure 6. Example Analysis of Risk Outsourcing FMEA from Welborn's Paper (Welborn 18) 29 Figure 7. Outsourcing Risk FMEA Prioritization Table for Risk Analysis... 33
Figure 8. Outsourcing Risk FMEA Mitigation Table for Risk Analysis... . 34
Figure 9. Prioritization Table with Highlighted Issues Column... ... 35
Figure 10. Prioritization Table with Highlighted Risk Column ... 37
Figure 11. Prioritization Table with the Causes of Risk Column Highlighted... 38
Figure 12. Prioritization Table with Effects of Risk Column Highlighted ... 38
Figure 13. Prioritization Table with Severity Column Highlighted ... . 39
Figure 14. Severity Rating for Outsourcing Risk FMEA ... ... 39
Figure 15. Prioritization Table with Occurrence Column Highlighted ... 40
Figure 16. Occurrence Rating Outsourcing Risk FMEA... ... 40
Figure 17. Prioritization Table with Detection Column Highlighted ... 41
Figure 18. Detection Rating for Outsourcing Risk FMEA ... ... 42
Figure 19. Prioritization Table with RPN Column Highlighted... ... 42
Figure 20. Mitigation Table with Prioritized List Column Highlighted ... 43
Figure 21. Mitigation Table with Plan of Action Column Highlighted... 44
1 INTRODUCTION
This chapter presents the background for this thesis. Section 1.1 provides background on outsourcing, including the issues and risks companies consider. Section 1.2 describes why it is important to consider these risks and issues. Section 1.3 discusses the motivation for developing this risk decision tool for outsourcing. Finally, section 1.4 is a brief outline of the rest of the thesis.
1.1 Outsourcing
1.1.1 Definition of Outsourcing and Process
Outsourcing is the process of subcontracting parts of a company to a third-party. Virtually all areas of the company can be outsourced (except for upper-level
management). Some "functions are being outsourced with more regularity, such as computer services, benefits administration, telephone customer support, and records management" (Bragg xi). Outsourcing provides many benefits to companies including "the shift from domestic to global economy, from manpower to technopower, from company-led to consumer-driven market forces, from an industrial economy to a knowledge economy" (Brown xii).
The process to decide to outsource varies depending on the company. Each company conducts its own research about firms that could be good potential suppliers. After this is done, a common part in the process is a request for proposal (RFP).
The RFP gives the supplier background information about the company and its industry, describes the function it wishes to outsource, the specific tasks to be taken on by the supplier, current transaction volumes, the company's expectations for performance, and a deadline for when the RFP must be received at the
company (Bragg 15)
RFPs help the company by bringing in potential suppliers. Companies then evaluate these suppliers based on the bids they have received and any other attributes they deem appropriate.
1.1.2 Issues to Consider while Outsourcing'
As part of his doctoral thesis in Engineering Systems at the Massachusetts Institute of Technology, Pedzisayi Makumbe has been conducting interviews about the issues that companies consider when making the decision to outsource. These issues mostly come from the automotive industry, and were used in developing the risk decision tool.
Cost. The most important issue is that the supplier can make the part/provide the service
the company needs within the company's budget. This issue is most heavily considered (and sometimes the only issue that is considered) when making the outsourcing decision.
Elimination of Duplication. This issue exists for multi-national companies. Companies
do not want to be manufacturing the same product in two different places just because they have facilities in those two places. They can outsource domestic manufacturing to a foreign manufacturing site, especially if that site is already producing the product (just not to the same scale).
Capability. The company is concerned about the personnel at the supplier site. This
includes having the quantity of people to produce the parts needed and also the quality of people to understand the complications that may occur during production.
Manufacturing Capability. The company wants to ensure that the supplier has the
resources to run production of the subcontracted part.
Best Technology Available. If the supplier has a better way of producing the part, then it
is beneficial for the company to take advantage of that technology. The company cannot possibly be the leader in manufacturing of every part that goes into its complex products. Outsourcing a part to a supplier with lots of experience in that particular field is then a smart choice.
Quality. The company needs to make sure that the product being produced by the
supplier can meet specifications and standards.
Capacity. The company is concerned about the supplier's capacity to produce a product
as well as deliver a product on time.
Access to Customer Culture. Multinational corporations sell their products all over the
world. In this case, having a production center in a country where their product is being sold is valuable for learning about the customer to which they are marketing.
Historical Reasons. If the company has a history of outsourcing to a certain supplier that
has met their expectations, they have a strong reason to continue their relationship.
Reliability. The supplier must be reliable in their delivery of goods and in meeting
product specifications, short from any extenuating circumstances.
Business Negotiation. Most outsourcing contracts are rewarded through business deals.
The ability of the supplier to negotiate is useful for them in trying to obtain contracts.
Logistics. The difficultly of working with the supplier, whether that be communications
or delivery, is also taken into account when deciding when to outsource.
1.1.3 Risks Resulting from Outsourcing2
Along with these issues, there are many risks involved in outsourcing. Victor Mroczkowski is a graduate student in MIT's Leaders for Manufacturing (LFM) program. As part of his Masters of Mechanical Engineering and Business Administration, he developed a list of risks that are commonly associated with outsourcing. These risk were used in the development of the risk decision tool.
2 This section was paraphrased from Victor Mroczkowski's thesis, for which this thesis is a complement. See
Controllable. Controllable risks are those that a company can detect with some degree of
certainty before the event happens and can mitigate to some level. Controllable risks can occur on the strategic, operational and financial side in all parts of the business: supply side, company, and customer side.
Examples of strategic risks would be a relationship-specific investment for the supply side, intellectual property breach for the company, and labor dispute for the customer side. Examples for operational risks include supplier failure to deliver amount needed for the supply side, transportation delays for the company, and inaccurate
forecasts for the customer side. For the financial risks, examples are supplier bankruptcy for the supply side, higher cost of logistics for the company, and accounts receivable not reliable from the customer side.
Uncontrollable. Uncontrollable risks are those that the company cannot detect in any
way. They include freak accidents like natural disasters and terrorist acts. They also include political factors, such as turmoil in the country the supplier operates, exchange rate fluctuations, new regulation and/or legislation preventing the supplier from
delivering, and financial recession. These are all factors that the company cannot control, but they do affect their outsourcing relationship with the supplier.
1.2 Importance of Issues and Risks in Outsourcing Decisions
According to Steven Bragg in his book, Outsourcing, "the most common approach [for choosing a supplier] is to scan through the bids for the lowest price, and immediately award the
contract to that supplier. However, this approach ignores a number of factors that should be researched prior to awarding a contract" (Bragg 18-9). These "other" factors are the ones discussed above, as well as many others. If companies do not take these factors into account when making their decision to outsource, they are risking hiring an unfit supplier. These risks have the potential to cost the company more than what the next lowest bidder with better resources may have offered.
1.3 Motivation for This Study
The purpose of this thesis is to explore a way to aid companies in the risk area of the outsourcing decision process, so they do not fall into the trap of choosing the lowest bidder. This thesis is in conjunction with Mroczkowski's thesis for the LFM program, entitled Integrated
Decision Support Model for Global Sourcing. His focus is to develop an Integrated Decision
Support Model which companies will be able to use to aid their decision making process. In this model, the strategic, operational, financial, and risk factors of an outsourcing decision are taken into consideration. The tool provides a numerical method for deliberating these factors, and acts as a structured tool for discussion. He worked with The Boeing Company in their Commercial Airlines division (BCA) to develop this project.
My part in the project is to focus on the risk side of the Integrated Decision Support Model. By using information from Mroczkowski's thesis about BCA, I hope to develop a tool that will help guide BCA in their discussions about outsourcing. The tool I will be using is a modified version of Failure Mode and Effects Analysis (FMEA). FMEAs are typically used in design engineering. However, throughout this thesis, I will explore how the FMEA can be used in the outsourcing risk framework. I will also provide a detailed description of Outsourcing Risk FMEA, my modified FMEA application. Outsourcing Risk FMEA will be used in a case study about Boeing's 737 Vertical Fin, as a complement to Mroczkowski's case study in his thesis. From this case study, I will explore what can be improved upon for other uses as well as how this will benefit companies in their outsourcing decisions.
1.4 Thesis Outline
In Chapter 2, I will discuss the background of Failure Mode and Effects Analysis
(FMEA), as well as it's potential to be used in a risk framework. The Boeing Company's current practices are described, as a set up for the case study. In Chapter 3, I will outline the process of developing FMEA to apply to risk decisions. This chapter will also include a description of my version of FMEA for risk analysis. Chapter 4 will highlight a case study about BCA's 2003 decision to outsource their 737 vertical fin to Korea Aerospace Industries (KAI). This is an extension of Mroczkowski's case study. Chapter 5 will have conclusions about the process of this thesis and a summary of the paper.
2 FAILURE MODE AND EFFECT ANALYSIS (FMEA)
Chapter 2 includes a background look into FMEA. Section 2.1 will outline the steps taken in a typical FMEA process. Section 2.2 highlights some of the current applications of FMEA. Section 2.3 briefly discusses The Boeing Company's current framework for outsourcing decisions and risk analysis. Section 2.4 weighs the advantages and disadvantages of using this analysis as a tool for outsourcing decisions, as well as looks into similar work done in this application of FMEA.
2.1 Typical FMEA
2.1.1 Definition of FMEA
"Preventing process and product problems before they occur is the purpose of Failure Mode and Effect Analysis" (Beauregard 4). The technique was first seen in the aerospace industry in 1962 as a "method of reliability analysis, risk analysis and risk management" (Aldridge 387). It has since then broadened into other engineering disciplines, where it has been applied to products, services, and management. Dyadem Press has put out multiple guidelines for FMEA in various industries. They state that the three main focuses of FMEA are:
* The recognition and evaluation of potential failures and their effect; * The identification and prioritization of actions that eliminate the potential
failures, reduce their chances of occurring, or reduce their risks;
* The documentation of these identification, evaluation and corrective activities so that product quality improves over time. (Dyadem 5-1)
FMEA has a step-by-step process that a chosen team follows. There are many variations on the exact steps that are followed. The next sections provide an outline of the steps that are seen most often in each type of FMEA.
2.1.2 Step 1: Assemble a Team
The team is an important aspect of the FMEA process. It must include a variety of perspectives, and each person needs a solid understanding of the product being discussed. FMEA is never to be done by one person because of personal bias. According to
Stamatis, "discussion continues until the team reaches a decision that every member accepts and will implement...the team capitalizes on diversity among members to reach a better decision than they could produce independently" (Stamatis 97).
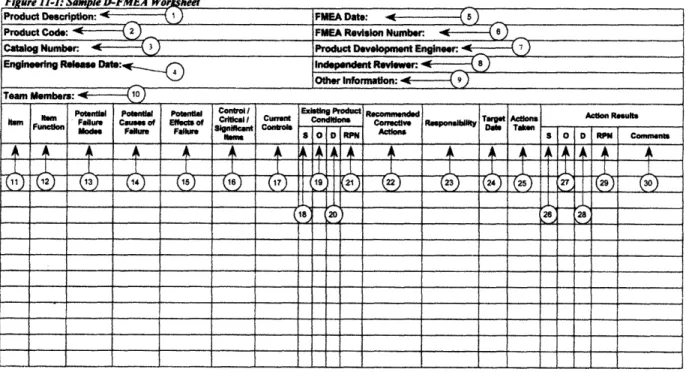
2.1.3 Step 2: Complete Header of FMEA Worksheet
This step is important in FMEA to correctly identify the part being looked at. It brings everyone one on the same page. Figure 1 shows an example of what the template might look like for an FMEA analysis.
Figure 11-1: Sample D-FMEA Workhheet
Product Code: * -2 FMEA Revision Number: Catalog Number: 4 Product Development Engineer: Engineering Release Date: Independent Reviewer: 8
Other Information: 9
Team Members: 10
Potential Pont PoentialI Control I Existingl Product Rconended An Rult
Im Failure Critical I CUrrent Conditionti Conw tlv Reponslbltty Taret ActionResults
momt D t( A cin sO D RPN Comments
( _ 1 1381 4 161 6 17 1 6 221 1231015 T_ - 1S29y127
-S 20
I 1
.
28
...
. .
, l
..
...
..
( !•
...
r
_7
+
,
Figure 1. Example of Design FMEA Worksheet (Dyadem 11-10)
2.1.4 Step 3: Identify Design Functions
In this step, the engineer outlines all the functions of the subsystem, part or process that the team is analyzing. "For the function to be effective, it must be identified in detail with a statement that is (1) concise, (2) exact, and (3) easy to understand"
(Stamatis 114).
2.1.5 Step 4: Identify All Possible Failure Modes for Each Function
The next step in the FMEA process is to identify how the function listed above can fail. There must be at least one failure mode for each function listed, but there is usually more than one failure mode. "The emphasis is on the engineer who must try to anticipate how the design being considered could possibly fail, not whether or not it will fail" (Stamatis 137).
2.1.6 Step 5: Identify Potential Effects of the Failure Modes
The next step in the process is to identify the potential effects of each failure mode. This step gets the team thinking about how the company will be affected by the failure mode, which will help the team decide on a severity rating.
2.1.7 Step 6: Critical Characteristics
This step is usually for design, product, or process FMEAs. The purpose of this column is to flag the team to a critical characteristic, such as meeting safety hazards, or compliance with government standards. Typically, a "Y" for yes, or "N" for no is placed in this column to indicate to the team that this mode needs to have a plan of action at the end of the analysis.
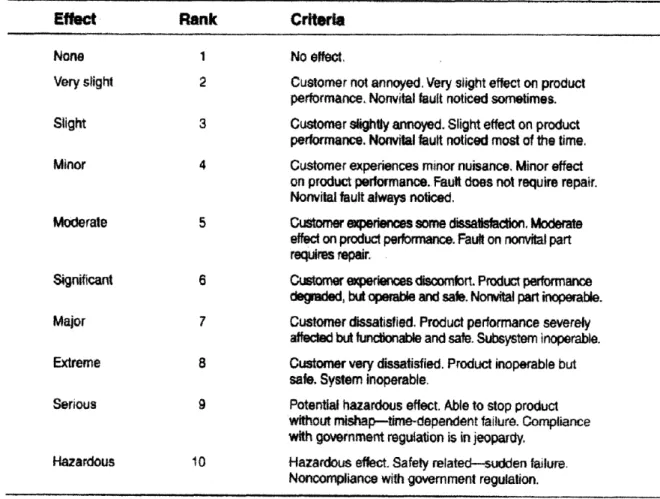
2.1.8 Step 7: Severity Rating (S)
From looking at the effects of each failure mode, the team can generate a severity rating score. The rating is on a 1-10 scale. An example for the severity score scale is shown in figure 2 below.
Effect Rank Criteria
None 1 No effect.
Very siight 2 Customer not annoyed, Very slight effect on product
performance. Nonvital fault noticed sometimes.
Slight 3 Customer slightly annoyed. Slight effect on product performance. Nonvital fault noticed most of the time.
Minor 4 Customer experiences minor nuisance. Minor effect
on product performance. Fault does not require repair.
Nonvital fault always noticed.
Moderate 5 Customer experiences some dissatisfaction. Moderate
effect on product performance. Fault on nonvital part
requires repair.
Significant 6 Customer experiences discomfort. Product performance
degded, but operable and safe. Nonvital part inoperable.
Major 7 Customer dissatisfied. Product performance severely
affected but functionable and safe. Subsystem inoperable.
Extreme 8 Customer very dissatisfied. Product inoperable but
safe. System inoperable.
Serious 9 Potential hazardous effect. Able to stop product
without mishap-time-dependent failure. Compliance
with government regulation is in jeopardy.
Hazardous 10 Hazardous effect. Safety related--sudden failure.
Noncompliance with government regulation.
Figure 2. Example of Detection Criteria for Design FMEA (Stamatis 141)
2.1.9 Step 8: Identify Potential Causes for Failure Modes
Identifying the potential causes for failure modes is as important as identifying the effects. It forces the team to think about what events act as a catalyst to the failure. From these causes, the team will have a better idea of how often the failure occurs, helping
them decide the Occurrence rating.
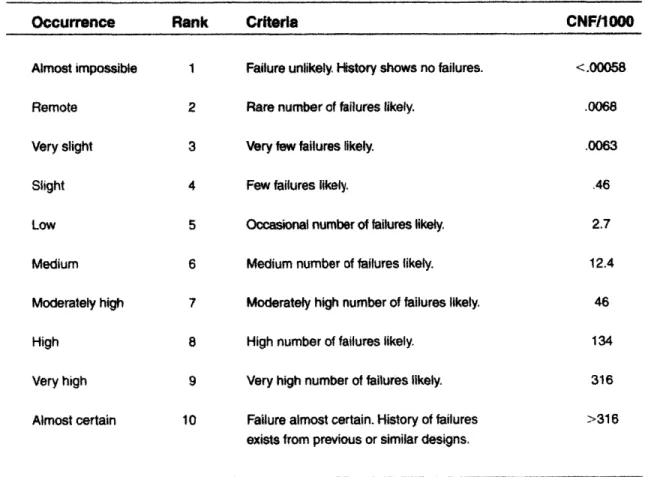
2.1.10 Step 9: Occurrence Rating (0)
After looking at what causes a failure mode, the team rates the likelihood of the failure mode taking place. The rating is on a 1-10 scale. An example of the occurrence
Occurmrence Rank Criteria CNF/1000
Almost impossible 1 Failure unlikely History shows no failures. <.00058
Remote 2 Rare number of failures likely. .0068
Very slight 3 Very few failures likely. .0063
Slight 4 Few failures likely. .46
Low 5 Occasional number of failures likely. 2.7
Medium 6 Medium number of failures likely. 12.4 Moderately high 7 Moderately high number of failures likely. 46
High 8 High number of failures likely. 134
Very high 9 Very high number of failures likely. 316
Almost certain 10 Failure almost certain. History of failures >316
exists from previous or similar designs.
Figure 3. Example of Occurrence Criteria for Design FMEA (Stamatis 144)
2.1.11 Step 10: Existing Control Mechanisms for Failure Modes
In this step, the team identifies ways the company can detect a failure mode before it fails and/or before it is sent to the customer. This is useful for the team to use as references in Step 11.
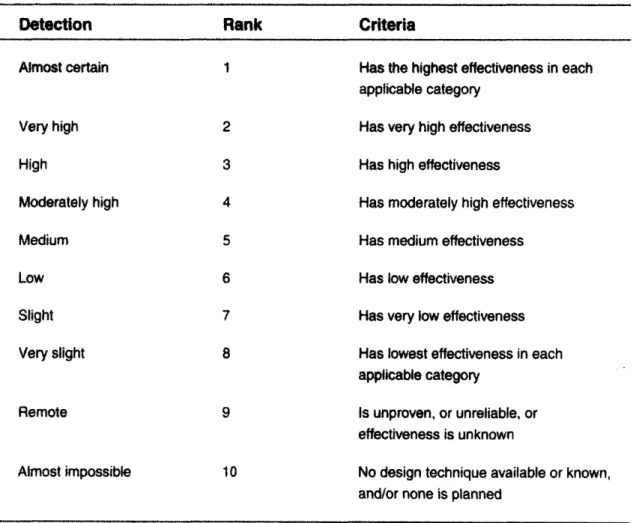
2.1.12 Step 11: Detection (D)
After going over the existing control mechanisms, the team rates how likely the controls will detect the failure before the product is released to the next step. The next
step could be taking the product to the customer, production, etc. The rating is on a 1-10 scale. An example of the detection score scale is shown in figure 4 below.
Detection
Rank
Criteria
Almost certain 1 Has the highest effectiveness in each
applicable category
Very high 2 Has very high effectiveness
High 3 Has high effectiveness
Moderately high 4 Has moderately high effectiveness
Medium 5 Has medium effectiveness
Low 6 Has low effectiveness
Slight 7 Has very low effectiveness
Very slight 8 Has lowest effectiveness in each
applicable category
Remote 9 Is unproven, or unreliable, or effectiveness is unknown
Almost impossible 10 No design technique available or known,
and/or none is planned
Figure 4. Example of Detection Criteria for Design FMEA (Stamatis 149)
2.1.13 Step 12: Risk Priority Number (RPN)
The next step is to calculate the Risk Priority Number. Equation (1) shows how the RPN is calculated.
RPN= Sx OxD
(1)
S refers to the Severity rating, 0 refers to the Occurrence rating, and D refers to the Detection rating. The RPN is calculated for each failure mode. The team then discusses each failure mode starting with the highest priority number. The highest RPN correlates itself to the highest risk failure mode.
2.1.14 Step 13: Recommended Action
The next step in the FMEA process is to brainstorm actions that will mitigate the risk of each failure mode. The team discusses what the company can do to improve the RPN (lowering the number). The team must keep in mind the resources of the company. "Example actions include DOE (design of experiments), design revision, and test plan revision" (Breyfogle 368).
2.1.15 Step 14: Assign Responsible Person/Target Date
A member(s) of the team is then assigned to complete the plan of action. This is an important step in accountability for the FMEA. A target date is also selected for the team to meet again and discuss the actions taken.
2.1.16 Step 15: Action Taken
At the next meeting, the plan of action teams report their activities and the resulting action taken for each failure mode is documented.
2.1.17 Step 16: Recalculate RPN
After the FMEA team discusses the new actions that were taken, they brainstorm new Severity, Occurrence, and Detection ratings. They revise the RPN; it should be
lower than the previous RPN now that actions have been taken to mitigate this failure. This completes the FMEA process.
2.2 Current FMEA applications 2.2.1 Product/Design FMEA
This is the most common application of FMEA. It uses FMEA as a way of looking at the full design of a product and trying to find its failure modes before it is put into its first production run. "The threshold of the first production run is important, because up to that point modifying and/or changing the design is not a major problem. After that point, however, the customer gets involved through...some... kind of formal notification" (Stamatis 129). For this type of analysis, Stamatis recommends a team of
engineers (system, reliability, test, material, process, design) and a marketing representative.
2.2.2 System/Concept FMEA
This application of FMEA is used for analyzing the subsystems of a product in the early stages of design and provides a good check for the design in terms of redundancy. The result of this analysis is the input for the Design FMEA. "The goal of system FMEA is to define and demonstrate a proper balance among operational (in other words,
effectiveness and performance) and economic factors" (Stamatis 108). For this process, Stamatis recommends a smaller team of engineers (system, reliability, test, and design) and a marketing representative.
2.2.3 Process FMEA
Process FMEA analyzes where failures may occur in the manufacturing and assembly processes. This helps to indentify necessary manufacturing controls before problems cause large bottlenecks. "The process FMEA should ideally commence with the design FMEA available...the design intent can be transferred through to the
manufacturing stage...with an already determined process route and early enough to allow time to implement any specific controls" (Aldridge 398). The results of process
FMEA is another process, which may have to be iterated through another FMEA until it
is refined enough (Stamatis 158). The recommended team for this analysis includes slightly different engineers (quality, reliability, tooling, process, design) as well as any responsible manufacturing operators (Stamatis 182).
2.2.4 Application FMEA
Application FMEA is used both upstream and downstream of the product production cycle (Dyadem 13-1). The downstream supplier side uses this analysis to identify failures that would occur when sending the product specifications to suppliers. The upstream side looks at customer applications of the product and how the company can eliminate confusion.
2.2.5 Service FMEA
In this application of FMEA, the team analyzes the services available to the customer before they are actually put in use. This is important so that the service
responds efficiently when necessary. "The goal, purpose, and/or objective of the service FMEA is to define, demonstrate, and maximize solutions in response to quality,
reliability, maintainability, cost, and productivity as defined by the design specifications and the customer" (Stamatis 189). The recommendations for this team are a department head and supervisor as well as personnel involved with the service (Stamatis 208).
2.2.6 Machine FMEA
Machine FMEAs are used by suppliers to identify the possible failure modes of the machines used to make the parts required. The supplier uses this to identify how a product may have potential failure modes due to a machine failing in the process of making it.
2.3 Boeing's Outsourcing Plan
2.3.1 Current Plan3
The Boeing Company has a subdivision called Global Partners that is responsible for making outsourcing decisions for the company. Global Partners recent focus is on developing long term strategic relationships with a close group of suppliers.
Currently Boeing's outsourcing plan includes a heavy emphasis on cost factors. They use accounting-based cost metrics to make their sourcing decisions, while keeping the minimum requirements for quality and delivery in mind. However, there is no one
single cost plan. For different decisions, different costs are considered. Boeing's plan also lacks consideration for those factors that are not quantitatively measured in a cost
manner.
2.3.2 Risk Tools
3 This section was paraphrased from Victor Mroczkowski's thesis, for which this thesis is a complement. See References.
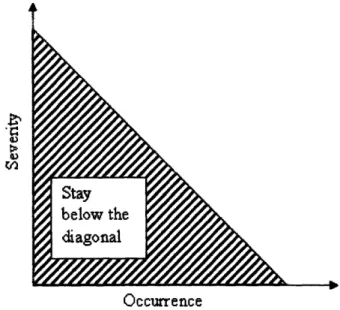
In discussions with Mroczkowski, I have found that Boeing does have a system of detecting risk that is based on the severity and occurrence of that risk. They use this to control their process steps in manufacturing, if they reduce this rating below a certain level. The design is considered successful and not looked at again. Figure 5 shows what a risk diagram might look like for Boeing (this diagram is based on my own rendering and not the material of the Boeing Company).
a,
Occurrence
Figure 5. Author's Example of Boeing's Risk Analysis
2.4 Potential of FMEA as Tool for Analyzing Outsourcing Risks
2.4.1 Advantages
There are multiple advantages to using the FMEA for analyzing risks with
outsourcing. FMEA is a tool that is used in many engineering applications. Boeing is an engineering company and has probably used this tool, or something similar in the past, so there is a level of familiarity. FMEA also has similar criteria to one of Boeing's existing processes for risk analysis, with the severity and occurrence ratings being something that Boeing already uses. This analysis would provide Boeing with a systematic, structured way of approaching the risks associated with outsourcing. Currently, they do not have a method of doing this. So not only does this method force the company to address the risks (especially the more qualitative ones), it also provides a standard method that the
company can use across all disciplines. The outcome of the analysis is a prioritized list. It inherently does not make decisions for the company, but instead lets the company know which areas should be considered more when making these decisions. The team atmosphere of FMEA is also very helpful. FMEA gathers multiple people for various views on the product being analyzed. Instead of a decision being made by only one person, or with multiple people in the same discipline, more employees are involved in the decision with multiple viewpoints that will enhance the process. FMEA also forces the team to collect data, so that they can better understand the issues. This data can be referenced in other decisions, as well as provide justification to the decision that was made.
2.4.2 Disadvantages
While there are a lot of reasons why this analysis would be beneficial in making outsourcing decisions, there are also some disadvantages. The analysis has not
previously been used in this manner at The Boeing Company. Therefore, it could be prone to rejection as it is a new analysis in a company that relies heavily on past protocol. The process described in the second part of this thesis will probably need more
refinement to cater to the company's needs. In that respect, immediate adoption of the analysis would be impossible. FMEA also does not provide a decision tool. It only gives a list of factors are the most important in making the decision. If the company wants a conclusive decision tool, this would not be able to provide that.
2.4.3 Current Ideas in this Area
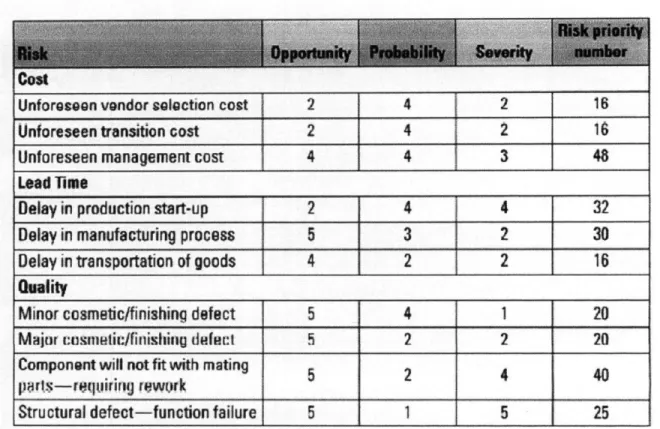
There is an article about applying FMEA in an outsourcing risk framework. Cliff Welborn, an associate professor at Middle Tennessee State University in Murfreesboro, published an article in the Quality Progress August 2007 issue about using FMEA to help make outsourcing decisions. He uses the same process described in Section 2.2 for a typical FMEA. However, he argues that using a 1-5 scale rather than a 1-10 scale is easier for the team. An example of his analysis is shown in figure 6 below.
Unforeseen vndor solection cost
2
4
2
16
Unforeseen tranition cost
2
4
2
1i
Unforeseen management cost
4
4
3
48
Lead Time
Delay in production start-up
2
4
4
32
Delay in manufacturing process
5
3
2
30
Delay
in transportation of
goods
4
2
1
2
16
Quality
Minor cosmetic/finishing defect
5
4
1
20
Major ctstic/finishing... defect . 5 2 2 20
Componnt
will not fit
with
mating
5
2
4
40
parts-requiring rewurkStructural defect-function failure
5
1
5
25
Figure 6. Example Analysis of Risk Outsourcing FMEA from Welborn's Paper (Welborn 18)
While Welborn does present the initial idea to use the FMEA framework to evaluate outsourcing risks, he does not justify his ideas to use a 1-5 scale or to not change any other part of the FMEA process. My analysis will build upon his idea to use this, but with the justification for the changes I have made to the FMEA process.
3 DEVELOPMENT OF OUTSOURCING RISK FMEA
This chapter goes into depth of the development process for Outsourcing Risk FMEA. Section 3.1 weighs the pros and cons of using the existing FMEA framework or developing a new one. Section 3.2 discusses the deviations from the existing FMEA framework. It describes the decisions made at the beginning of the development process and the justifications for the deviations from the typical FMEA. Section 3.3 gives a detailed description of the procedure of performing an Outsourcing Risk FMEA. Section 3.4 discusses the results a company should expect with this FMEA, and how to use the results.
3.1 Existing FMEA versus New FMEA 3.1.1 Existing FMEA
The main advantage of using the existing framework is familiarity. In the engineering world, FMEA is consistently used in new product development. It provides a safety check to designers so that they can prevent obvious failures from occurring in the product. Another advantage is that FMEA is being used more frequently in the process side of engineering. Whether it is a manufacturing process or a customer service process, there are now many applications of this analysis. Adding an application of FMEA for outsourcing decisions is not as implausible with the advent of process- and service-oriented FMEAs.
However, the distinct disadvantage of using existing FMEA is that it may not be asking the right questions about the issues addressed. Failure modes of products are very different than risks involved in outsourcing. A product has measurable and physical failure modes, such as crack propagation and time to obsolescence. However, risks, such
as strategic positioning and delivery failure, do not have concrete measurements. The question then becomes whether Severity, Occurrence, and Detection are the right criteria to use to judge these risks. It might also be a hard adjustment for engineers working on the analysis to change their frame of reference from product design to outsourcing decisions.
3.1.2 New FMEA
The main advantage of a new FMEA structure is that the criteria can be redefined. Severity, Occurrence and Detection can be altered in both the type of the criterion and how they are scored to create a new analysis. The team can then know for certain that they are evaluating their outsourcing decision on criteria customized to this type of risk
analysis.
The disadvantage of a new FMEA is confusion. Because engineers are familiar with the existing frameworks for FMEAs, they would probably jump to conclusions
about how to go through this analysis without paying careful attention to the directions. Also new tools for decision making are hard to introduce to a company because they are accustomed to practicing a certain type of decision making.
3.2 Development of Outsourcing Risk FMEA 3.2.1 Decision
After weighing the advantages and disadvantages, I decided to create an
Outsourcing Risk FMEA that held true to the existing FMEA framework, but with some minor changes. This decision was a compromise between the two ideas presented above. Sections 3.2.2 and 3.2.3 describe the similarities to existing FMEA frameworks and the small changes made for the Outsourcing Risk FMEA.
3.2.2 Criteria
As an exercise to make the decision of how to format this analysis, I took myself through the process of what needs to be considered when making outsourcing decisions.
I decided to look at three risks: political turmoil in country of production, quality of
produced part not within specifications, and delivery not on time. Appendix A outlines my thought process in analyzing these three risks. I thought about what questions needed to be asked about these issues. Looking over the questions being asked about this these issues, I saw some underlying themes. First off, these risks needed to be measured with
by the degree of consequences that resulted. Another theme was how frequently the risk
much consideration as a less serious risk that occurred very often. There was also a theme of having the information to understand the consequences of these risks.
These general themes coincided well with the criteria of existing FMEA. This made my decision very easy. I decided to use the same criteria for this analysis. The
only area of some dispute was with the Detection criterion. For product FMEA, Detection refers to the company's ability to expose a failure before it gets to the
customer. The company can detect failure modes in products by performing tests and by setting up controls. However, it is very difficult to detect an outsourcing risk before it happens. Controllable risks, such as labor relations or poor quality products, are a little easier to anticipate. Controls can be set to mitigate these risks (e.g. quality checks in production lines). However, with uncontrollable risks, such as natural disasters, it is extremely hard to perceive when these risks might occur.
For these reasons, the Detection criterion of the typical FMEA was reformatted for the Outsourcing Risk FMEA. In this analysis, the Detection criterion refers to a level of knowledge of the consequences. The team members performing the FMEA will think about their current level of understanding, as well as the availability of information to enhance their level of understanding. If they do not know a lot about the effects of a risk, and the information is not easy to obtain, that risk will have a high Detection rating. This criterion is aligned better with outsourcing risks than the old Detection criterion. The old version dealt with the company's ability to see the failure after the product existed in
some form. The new criterion deals with the company's ability to foresee the
consequences of risks. This aligns with the idea of this analysis being done prior to the outsourcing decision.
3.2.3 Process
When looking at the process for the existing FMEA, it was relatively
straightforward. Most of the steps made sense in terms of thinking about outsourcing risks. The only steps that did not make sense occurred at the end. The goal of product FMEA is to identify the main failure modes and mitigate them. The existing FMEA calls for the team to appoint a person in charge of mitigating the failure mode. The team then meets again at an agreed time and decides on a new RPN for the failure mode. The
Outsourcing Risk FMEA is performed before the outsourcing decision is made. The risks discussed are not realized. Therefore, it would be difficult to completely mitigate these risks, especially those that are uncontrollable (i.e. natural disasters, terrorism, etc.). Furthermore, the goal of Outsourcing Risk FMEA is only to figure out which risks need to be considered heavily in the outsourcing decision. Because of these differences, I decided to reformat the last steps of FMEA.
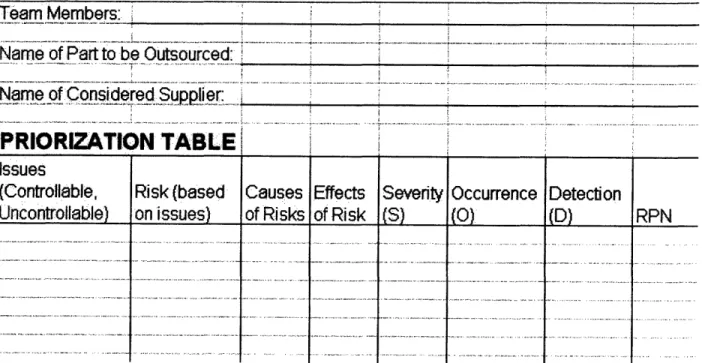
Instead of the typical mitigation and reevaluation, I choose to reorganize the FMEA worksheet. The first table is called the Prioritization Table. Figure 7 shows the table. Appendix B also contains both tables developed for Outsourcing Risk FMEA. It uses the first half of the FMEA framework, and then stops after the RPN has been calculated.
Team
Members:
.
Name of Part to be Outsourced:
Name of Considered Supplier:
.... . .. . .. .... .. ... .. ... . ... . . ... ... .... .... . . .. i ... . . . .. .. .... .÷i .. .. .. . ... ..
PRIORIZATION TABLE
Issues
(Controllable,
Uncontrollable)
Risk (based
on
issues)
. . ... ... ... ... ... ---Causes
of Risks
.. .. .... . .. ... . .Effects
of Risk
1 .... . . ... . ... ... .-Severity
Occurrence
(0)
Figure 7. Outsourcing Risk FMEA Prioritization Table for Risk Analysis
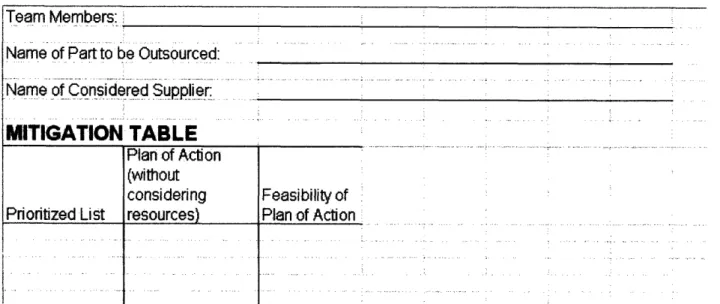
At this point in the regular analysis a person would be assigned to mitigate the risks. However, in my modified analysis, the team moves on to the next table. This is the Mitigation Table, shown in figure 8.
33
Detection
(D)
RPN
I ; I i i i i I 1 I tTeam Members:
Name of Part to be Outsourced: Name of Considered Supplier:
MITIGATION
TABLE
Prioritized List Plan of Action (without considering resources) Feasibility of Plan of ActionFigure 8. Outsourcing Risk FMEA Mitigation Table for Risk Analysis
This table lists the risks in order of highest RPN to lowest RPN. After listing, the team brainstorms all possible ways to mollify those risks, not taking the company's resources into account. By not taking the company's resources into account, the ideas will be the best conceivable plans of actions, not the best just for the company. After coming up with these actions, the team decides which of the actions are feasible based on the company's resources. The number of feasible mitigations will help the team decide the potential of this supplier.
3.3 Outsourcing Risk FMEA Procedure Description
Appendix C provides an instructional description of this procedure.
3.3.1 Step 1: Gather Team
The team is an essential part in this FMEA process. The company needs to assemble cross-discipline members that will be affected by the outsourcing decision. This includes supply chain analysts, design engineers for the product, assembly line engineers, budgeters, and people who understand the company's global positioning strategy (usually upper management). The team is not limited to these people. It would also be beneficial to have members from the company's suppliers on the team. These people would help the team understand the relationship the company has with its current
suppliers. However, having members of the supplier being analyzed is not beneficial, as they would probably create a conflict of interests. Having customer representatives on the team is also helpful; they can provide the downstream insight on how they would be affected if these risks were to occur.
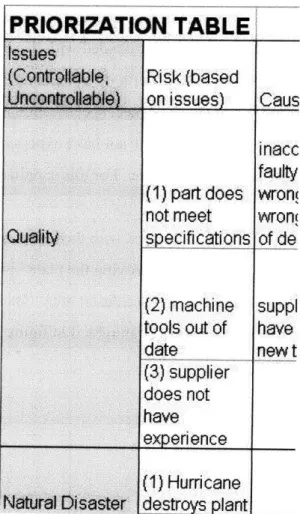
3.3.2 Step 2: Identify Issues
The next step in the process is to identify issues that are associated with outsourcing. These issues are similar to the ones discussed in the introduction of this thesis. In identifying these issues, both controllable and uncontrollable events are looked at. Each issue is listed in the first column of Prioritization Table. Figure 9 shows this table with the first column highlighted. It is the first tool of the Outsourcing Risk FMEA. This table will help organize the thoughts of the team and keep them on track with the analysis.
IPRIORIZATION TABLE
(based
sues)
art
does
leet
ifications
achine
out of
ipplier
not
ience
rricane
oys
plant
Caus
inacc
faulty
wron(
wront
of de
suppi
have
new t
Controllable issues, as discussed in Section 1.1.3, are any issues that can be mitigated easily. They include issues in the following 4 categories, but are not limited to them: cost, quality (technology, experience, reputation), delivery (capacity, reliability) and collaboration (communication, culture, information transfer).
Uncontrollable issues, also discussed in Section 1.1.3, are those that the company cannot foresee and cannot regulate. They do not have specific categories that they fall under, but include such things as natural disasters, acts of terrorism, exchange rate fluctuations, etc.
When identifying issues, it is important to keep in mind the supplier that is being analyzed. The issues identified should be consistent with what to expect. Some issues, such as quality failure, need to be universally addressed. However issues like natural disasters do not need to be considered if the supplier is in a mild climate.
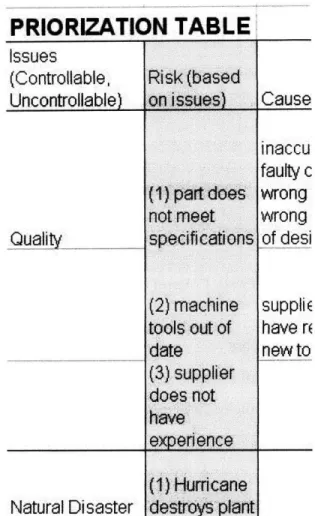
3.3.3 Step 3: Identify Risks
The next step is to then identify specific risks associated with these issues. Each issue may have a different number of risks associated with it. For example, with the quality issue, an acceptable risk may be "part does not meet specifications." However, the risks of "machine tools are obsolete" and "plant does not have experience in
producing this part" may also fall under the quality issue. For this supplier, there is more than one risk for the quality issue.
Another important point is that the risk associated with the issues must be relevant to the supplier. For example the risk of "hurricane destroying the plant" is not a relevant risk to the natural disaster issue if the plant is located in a desert area. These risks are placed in the next column of the Prioritization Table, highlighted in figure 10.
PRIORIZATION TABLE
Issues
(Controllable,
Uncontrollable)
Quality
Natural Disaster
Risk
(based
on issues)
(1) part does
not meet
specifications
(2) machine
tools out of
date
(3) supplier
does not
have
expenience
(1)
Hurricane
destroys plant
Figure 10. Prioritization Table with Highlighted Risk Column
3.3.4 Step 4: Identify Causes of Risks
The next step is to identify the causes of the risks that were just brainstormed. There may be multiple causes for each risk. They are placed in the third column of the Prioritization Table, highlighted in figure 11. The purpose of identifying the causes is to get the group thinking about what they already know and understand about the risks. The causes will also help the team come up with ways to mitigate the risks in the later section of the analysis. As an example, "product not up to specifications" could be caused by inaccurate tooling, where "inaccurate tooling" would be placed in the causes of risk column as well as any other potential cause.
P IR
TONTB
Cause
inaccu
faulty c
wrong
wrong
of desi
suppliEhave r(
new
to
PRIORIZATION
TABLE
Issues
(Controllable,
Uncontrollable)
Quality
Risk (based
on issues)
(1) part does
not meet
specifications
Causes of Risks
inaccurate tooling,
faulty controls,
wrong design sent,
wrong interpretation
of design
::ii~~i!!? i 'ii ii i i / / /¸ ¸ . .;il . ... ~i~~i#n_
··
f-Figure 11. Prioritization Table with the Causes of Risk Column Highlighted 3.3.5 Step 5: Identify Effects if Risk Occurs
In the fourth column, the effects of the risks are listed. This column is highlighted in figure 12. By identifying these risks, the team is more prepared to make decisions regarding the criteria of FMEA. They can reference these effects in their discussion of Severity, Occurrence and Detection. An example of a risk for "product does not meet specifications" could be parts do not fit correctly into larger assembly. "Parts do not fit correctly into larger assembly" would be written in the effects column.
PRIORIZATION TABLE
Issues
(Controllable,
Uncontrollable)
Quality
Risk (based
on
issues)
(1)
part does
not
meet
specifications,
Causes
of Risks
inaccurate tooling,
faulty controls,
wrong design
sent,
wrong interpretation
of
esign
Effects of
Risk
parts
do not fit
correctly into larger
assembly, need to
get rid of already
produced
parts,
production
stalls
more complex
Figure 12. Prioritization Table with Effects of Risk Column Highlighted
Effects o
parts do
correctly
assembl'
get
rid of
producer
producti(
more cnrSeve
(s)
i t •PRIORIZATION TABLE
3.3.6 Step 6: Severity Rating (S)
In the next column, the team rates the severity of the effects of the risk. This column is highlighted in figure 13, with this particular risk's score.
W 3J 5/J '1 IM L j
Issues
(Controllable,
Uncontrollable)
Quali8
Risk (based
on issues)
(1) part does
not meet
specifications
Causes of Risks
inaccurate
tooling,
faulty controls,
wrong design sent,
wrong interpretation
of
desi
Effects of Risk
parts do not fit
correctly
into larger
assembly, need
to
get rid of already
produced
parts,
production
stalls
more complex
Figure 13. Prioritization Table with Severity Column Highlighted
The Severity rating is ranked on a scale from 1-10. The meaning of each point scale is shown in figure 14. The numbers that are not specifically defined fall between those that are defined; they are up to the team's discretion. For example, "part does not meet specifications" may have a severity rating of 9 because the part produced will not sync with the assembled product, so all of the produced parts must be discarded.
Rating Meaning
1 company is not affected
2
3 company minimally affected, repaired easily 4
5 company affected, but repairable 6
7
8 company largely affected, repairable, but difficult 9
10 company is affected beyond repair
Figure 14. Severity Rating for Outsourcing Risk FMEA
Occ
(0o)
Severity
9
FRKIM
d.LL
I IJil IP 0ll..111
I"i•l•rt• ! ltJl•l i I•tIDLI• , I i3.3.7 Step 7: Occurrence Rating (0)
In the sixth column of the Prioritization Table, the team evaluates the likelihood of the risk occurring. This column is highlighted in figure 15, with this particular risk's score.
PRIORIZATION
TABLE
I
Issues (Controllable, Uncontrollable) Quality Risk (based on issues) (1) part does not meet specifications Causes of Risks inaccurate tooling, faulty controls, wrong design sent, wrong interpretationro
design
_
Effects of Risk parts do not fit correctly into larger assembly, need to get rid of already produced parts, production stalls more comolex Severity
(s)
9 Occurrence (0)22
De(D)
Figure 15. Prioritization Table with Occurrence Column Highlighted
The Occurrence rating is ranked on a scale from 1-10. The meaning of each point scale is shown in figure 16. The numbers that are not specifically defined fall between those that are defined; they are up to the team's discretion. For example "part does not
meet specifications" may have an occurrence rating of 2, because it is relatively unlikely that the plant would produce all parts not within specifications. Some parts may be incorrectly produced, but every part is unlikely to not be within specifications.
Rating Meaning
1 occurs very minimally (Probability < 0.10) 2 0.10 < Probability < 0.17
3 occurs a little amount (0.17 < Probability< 0.25) 4 0.25 < Probability < 0.32
5 occurs a substantial amount (0.32 < Probability < 0.40) 6 0.40 < Probability < 0.45
7 0.45 < Probability < 0.50
8 occurs rather frequently (0.5 < Probability < 0.55) 9 0.55 < Probability < 0.62
10 occurs very frequently (Probability > 0.7)
3.3.8 Step 8: Detection Rating (D)
The next column is where the team brainstorms the Detection rating. This column is highlighted in figure 17 with this particular risk's score.
DDIotDf7ATIf't TADI C! I ~ U E~I~ I ~
Issues
(Controllable, Uncontrollable) Quality Risk (based on issues) (1) part does not meet §specifications Causes of Risks inaccurate tooling, faulty controls, wrong design sent, wrong interpretationEffects of Risk parts do not fit correctly into larger
assembly, need to
get nd of already
produced parts, production stalls
mnr r mnin•y Figure 17. Prioritization Table with Detection Column Highlighted
This rating departs from traditional FMEA. The Detection rating refers to the company's ability to properly identify the risks they are discussing. The panel must reflect on their own level of understanding of the risk being analyzed and whether they have the information to understand it fully. In order to be completely certain, the company must already have the information necessary to make an informed decision about the risks involved. The criterion is ranked on a 1-10 scale, defined in figure 18. The numbers that are not specifically defined fall between those that are defined; they are up to the team's discretion. For example, "part does not meet specifications" may have a detection rating of 9 because the team would not have the knowledge to know if the supplier they are looking at would cause error in the production of every part. There is probably some error the team can assume will occur, but there is virtually no way of knowing if the supplier will ruin all the parts.
Detection (10)i•i) :
·-Is"
e
--
iii!iRF
Severity (S) 9 Occurrence (0) S 2Rating Meaning
1 certain understanding, already have available information 2
3 fair understanding, do not have information, fairly easy to obtain 4
5 mediocre understanding, do not have information, obtainable, but slightly difficult
6 7
8 unclear understanding, do not have information, will be rather difficult to obtain 9
10 no understanding, do not have information, not available
Figure 18. Detection Rating for Outsourcing Risk FMEA
3.3.9 Step 9: Calculate Risk Priority Number (RPN)
The last column of the Prioritization Table lets the team calculate the RPN, shown in figure 19, with this particular risk's RPN. Equation (1) is how to calculate the RPN, where S is the Severity rating, O is the Occurrence rating, and D is the Detection rating.
RPN = Sx OxD
(1)
This formula yields RPN values from 1-1000.
PRIORIZATION TABLE Issues (Controllable, Uncontrollable) Quality .. ... Risk (based on issues) (1) part does not meet specifications Causes of Risks inaccurate tooling, faulty controls, wrong design sent, wrong interpretation of design
Effects of Risk
parts do not fit
correctly into larger assembly, need to get nrid of already
produced pans, production stalls ...
more complex
Figure 19. Prioritization Table with RPN Column Highlighted
3.3.10 Step 10: Prioritize
The next step in the Outsourcing Risk FMEA is to move to the risks to the Mitigation Table. In the first column of the table, the team will list the risks in order of
Severity Occurrence (Q) Detection (D) RPN 162
(0)
,highest RPN to lowest RPN. The column is highlighted in figure 20. This allows to the team to look at the highest priority risks first.
MITIGATION TABLE
Plan of Acti(without considerinc Prioritized List resources)
(162) part does send empk
not meet help plant c
specifications track
find anothe to receive l
from
(13.3. 0) Step huic: Plane
destroys plant
(80) supplier
does not have expenrince
(63)
machine
Figure 20. Mitigation Table with Prioritized List Column Highlighted
3.3.11 Step 11: Plan of Action
In the next column of the Mitigation Table, the team will brainstorm all possible ways to eliminate each risk. The column is highlighted in figure 21. The resources of the company are not taken into account so that no idea is discounted and that the best
possible ideas are put forward. To continue the example, for the "part does not meet specifications risk" a possible plan of action would be to send a representative from the company to the supplier to provide support for the supplier in order to meet the
MITIGATION
TABLE
Prioritized
List
(162)
part does
not meet
specifications
( n1n)1 hi irric anaPlan of Action
(without
considering
resources)send employee
to
help plant get on
track
find another plant
to receive parts
from
Figure 21. Mitigation Table with Plan of Action Column Highlighted
3.3.12 Step 12: Analyze Feasibility
In the final column of the Mitigation Table, the team will discuss the feasibility of each plan of action. Now, the team can take into account the company's resources, and whether the company can allocate those resources to this cause. In this column,
highlighted in figure 22, the team would write out whether they think each plan of action is feasible and how. As a conclusion to our example, sending a company representative to the supplier would be pretty feasible. It would just force the company to reallocate some of their personnel. However, disabling their relationship with the company would not be very feasible as they would have to scramble to find another supplier.