ADAPTATION MEASURES - CASE STUDY: FLOODS
E. GIRON, H. JOACHAIN, A. DEGROOF and W. HECQ, CEESE-ULB I. CONINX and K. BACHUS, HIVA- KUL
B.J. DEWALS, J. ERNST and M. PIROTTON, HACH-ULg J. STAES and P. MEIRE, ECOBE- UA
CLIMATE
Promoters - Kris BACHUS (HIVA-KUL)
- Michel PIROTTON (HACH-ULg) - Patrick. MEIRE (ECOBE-UA)
- Renaat DE SUTTER (ARCADIS Belgium nv) - Walter HECQ, Coordinator (CEESE-ULB)
Authors
- E. GIRON, H. JOACHAIN, A. DEGROOF and W. HECQ, CEESE-ULB - I. CONINX and K. BACHUS, HIVA- KUL
- B.J. DEWALS, J. ERNST and M. PIROTTON, HACH-ULg - J. STAES and P. MEIRE, ECOBE- UA
- L. DE SMET and R. DE SUTTER, ARCADIS Belgium nv
(SSD)
FINAL REPORT
ADAPT - T
OWARDS AN INTEGRATED DECISION TOOL FOR ADAPTATION MEASURES- C
ASE STUDY:
FLOODSJanuary 2010
D/XXXX/XXXX/XX (to complete by Belspo) Published in 20XX by the Belgian Science Policy Rue de la Science 8 Wetenschapsstraat 8 B-1000 Brussels Belgium Tel: +32 (0)2 238 34 11 – Fax: +32 (0)2 230 59 12 http://www.belspo.be Contact person: XXXXXXXX +32 (0)2 238 3X XX
Neither the Belgian Science Policy nor any person acting on behalf of the Belgian Science Policy is responsible for the use which might be made of the following information. The authors are responsible for the content.
No part of this publication may be reproduced, stored in a retrieval system, or transmitted in any form or by any means, electronic, mechanical, photocopying, recording, or otherwise, without indicating the reference :
ADAPT - TOWARDS AN INTEGRATED DECISION TOOL FOR ADAPTATION MEASURES - CASE STUDY: FLOODS
Final Report. Brussels : Belgian Science Policy 2009 – xx p. (Research Programme Science for a Sustainable Development)
UTABLE OF CONTENT
17T117T 17TUSUMMARYU17T ______________________________________________________________________ 6 17TU1.1U17T 17TUContextU17T ____________________________________________________________________ 6 17TU1.2U17T 17TUObjectivesU17T _________________________________________________________________ 7 17TU1.3U17T 17TUMethodologyU17T _______________________________________________________________ 7 17TU1.3.1U1 7T 17TUEvaluation of flood hazardU17T ______________________________________________________________ 7 17TU1.3.2U1 7T 17TUImpacts analysisU17 T ______________________________________________________________________ 8 17TU1.3.3U1 7T 17TUEvaluation of adaptation optionsU17T ________________________________________________________ 10 17TU1.4U17T 17TUResultsU17T ___________________________________________________________________ 10
17TU1.4.1U1 7T 17TUSelected adaptation measures and flood risk impactsU17T _______________________________________ 10 17TU1.4.2U1 7T 17TURankingU17T ____________________________________________________________________________ 11 17TU1.4.3U1 7T 17TUExtended CBAU1 7T _______________________________________________________________________ 12 17TU1.5U17T 17TUConclusions and contribution to scientific policy supportU17T ___________________________ 13 17TU1.6U17T 17TUKeywordsU17T _________________________________________________________________ 14 17T217T 17TUINTRODUCTIONU17T _________________________________________________________________ 14
17TU2.1U17T 17TUObjective 1 (WP2.1) Evaluating primary impacts of global change induced flooding on
river basins: Hydraulic modelingU17T _______________________________________________ 15 17TU2.2U17T 17TUObjective 2 (WP2.2) Evaluating secondary impacts of global change induced flooding
on ecosystem and society: flood risk assessmentU17T __________________________________ 16 17TU2.3U17T 17TUObjective 3 (WP2.3): determining adaptation measuresU17T ____________________________ 16 17TU2.4U17T 17TUObjective 4 (WP2.4) : evaluating adaptation measures costsU17T ________________________ 17 17TU2.5U17T 17TUObjective 5 (WP2.5) : Evaluation of adaptation scenarios by means of an extended
cost benefits analysisU17T ________________________________________________________ 17 17TU2.6U17T 17TUObjective 6 (WP2.6): recommendations on adaptation of measuresU17T __________________ 17 17T317T 17TUMETHODOLOGY AND RESULTSU17T _____________________________________________________ 18
17TU3.1U17T 17TUORIGINAL FRAMEWORK DEVELOPED FOR ESTIMATING FLOOD RISK ALONG BELGIAN
RIVERSU17T ____________________________________________________________________ 18 17TU3.1.1U1 7T 17TUMethodology for hydraulic modelingU17T ____________________________________________________ 18
17TU3.1.1.1U17T 17TU1D flow modelU17T _________________________________________________________________ 18 17TU3.1.1.2U17T 17TUFully dynamic quasi-3D flow modelU17T ________________________________________________ 19 17TU3.1.2U1 7T 17TUMethodology for social impact analysisU17T __________________________________________________ 22 17TU3.1.2.1U17T 17TUNumber of affected people and affected valuable buildingsU 17T ____________________________ 23 17TU3.1.2.2U17T 17TUSocial flood impact intensityU17T ______________________________________________________ 23 17TU3.1.2.3U17T 17TUMethodology for estimation risk to loss of lifeU17T _______________________________________ 27 17TU3.1.3U1 7T 17TUMethodology for economic damage evaluationU17T ____________________________________________ 28 17TU3.1.3.1U17T 17TUInventorying elements-at-riskU17T _____________________________________________________ 28 17TU3.1.3.2U17T 17TUDamage cost assessmentU17T ________________________________________________________ 28 17TU3.1.3.3U17T 17TUExisting damage functions for housingU17T ______________________________________________ 29 17TU3.1.4U1 7T 17TUMethodology for ecological impact evaluationU17T _____________________________________________ 33 17TU3.1.4.1U17T 17TUIntroductionU17T ___________________________________________________________________ 33 17TU3.1.4.2U17T 17TUVegetation types and flood vulnerabilityU17T ____________________________________________ 34 17TU3.1.5U1 7T 17TUMethodology for integrating hydraulic modeling results with socio-economic damage and
ecological impactsU 17T ____________________________________________________________________ 35 17TU3.1.5.1U17T 17TUMicro-scale approachU17T ___________________________________________________________ 36 17TU3.1.5.2U17T 17TUOverview of the risk analysis procedureU17T ____________________________________________ 36
17TU3.1.5.3U17T 17TUHazard evaluationU17T ______________________________________________________________ 37 17TU3.1.5.4U17T 17TUAvailable data for vulnerability analysisU17T _____________________________________________ 37 17TU3.1.5.5U17T 17TUExposure AnalysisU17T ______________________________________________________________ 38 17TU3.1.5.6U17T 17TUMethodology based on available data in FlandersU17T ____________________________________ 39 17TU3.2U17T 17TUORIGINAL FRAMEWORK DEVELOPED FOR ASSESSING ADAPTATION MEASURESU17T ________ 39
17TU3.2.1U1 7T 17TUSelection of the adaptation measuresU 17T ____________________________________________________ 39 17TU3.2.2U1 7T 17TUMethodology for the evaluation of the direct costs of the adaptation measuresU 17T __________________ 39 17TU3.2.2.1U17T 17TUIntroductionU17T ___________________________________________________________________ 39 17TU3.2.2.2U17T 17TUCosts componentsU17T ______________________________________________________________ 40 17TU3.2.2.3U17T 17TULiterature reviewU 17T _______________________________________________________________ 42 17TU3.2.2.4U17T 17TUEnquiryU17T _______________________________________________________________________ 42 17TU3.2.3U1 7T 17TUDecision support modelU 17T _______________________________________________________________ 42 17TU3.2.3.1U17T 17TUDescription of the decision support modelU17T __________________________________________ 43 17TU3.2.3.2U17T 17TUDiscussion of the decision support modelU17T ___________________________________________ 47 17TU3.3U17T 17TURESULTS OF APPLICATION OF THE ORGINAL METHODOLOGY TO TWO CASE STUDIESU17T ____ 47
17TU3.3.1U1 7T 17TUCase study OurtheU17T ___________________________________________________________________ 47 17TU3.3.1.1U17T 17TUHydrological / Hydraulic characteristics – Baseline scenariosU17T ____________________________ 47 17TU3.3.1.2U17T 17TUSocio-economic characteristicsU17T ____________________________________________________ 49 17TU3.3.1.3U17T 17TUAdaptation scenariosU 17T ____________________________________________________________ 50 17TU3.3.1.4U17T 17TUConsidered adaptation measuresU17T __________________________________________________ 51 17TU3.3.1.5U17T 17TUPhysical impacts of the adaptation scenariosU1 7T ________________________________________ 57 17TU3.3.1.6U17T 17TUFlood risk evaluation for climate change scenarios (including base scenario)U17 T _______________ 61 17TU3.3.1.7U17T 17TUImpact of climate change on flood riskU17T _____________________________________________ 62 17TU3.3.1.8U17T 17TUEffectiveness of the scenariosU17T _____________________________________________________ 63 17TU3.3.1.9U17T 17TUDirect costs of the adaptation measures of the Ourthe case studyU17T _______________________ 64 17TU3.3.1.10U17T 17TUDamages function and benefits (avoided costs)U17T ______________________________________ 69 17TU3.3.1.11U17T 17TUApplication of MCA/CBA for ranking adaptation measuresU17T _____________________________ 71 17TU3.3.2U1 7T 17TUCase study DenderU1 7T ___________________________________________________________________ 75 17TU3.3.2.1U17T 17TUHydrological analysis study siteU17T ___________________________________________________ 75 17TU3.3.2.2U17T 17TUSocio-economic characteristicsU17T ____________________________________________________ 78 17TU3.3.2.3U17T 17TUEnvironmental characteristicsU17T_____________________________________________________ 79 17TU3.3.2.4U17T 17TUConsidered adaptation measuresU17T __________________________________________________ 81 17TU3.3.2.5U17T 17TUEvaluation of social flood impactsU17T _________________________________________________ 84 17TU3.3.2.6U17T 17TUEconomic impactsU17T ______________________________________________________________ 86 17TU3.3.2.7U17T 17TUEcological impactsU17T ______________________________________________________________ 86 17TU3.3.2.8U17T 17TUFlood risk evaluationU17T ____________________________________________________________ 87 17TU3.3.2.9U17T 17TUScenario evaluationU17T _____________________________________________________________ 90 17TU3.3.2.10U17T 17TUConclusion / comparative analysis of both case studiesU17T ________________________________ 93 17T417T 17TUPOLICY SUPPORTU17T ________________________________________________________________ 95
17TU4.1U17T 17TUIntroductionU17T _______________________________________________________________ 95 17TU4.2U17T 17TUAdded value of the projectU17T ___________________________________________________ 95 17TU4.2.1U1 7T 17TUProgress concerning the quality and the number of impacts assessed in a climate change contextU17T ___ 95 17TU4.2.2U1 7T 17TUProgress concerning the deliberation of adaptation measuresU17 T ________________________________ 96 17TU4.3U17T 17TUSpecific recommandationsU17T ___________________________________________________ 96
17TU4.3.1U1 7T 17TUImpact assessment methodsU17 T ___________________________________________________________ 96 17TU4.3.2U1 7T 17TUMapping and channelling uncertaintiesU 17T __________________________________________________ 97 17TU4.3.3U1 7T 17TUInvolvement of people and stakeholders in the assessment and optimisation of adaptation
scenariosU17T ___________________________________________________________________________ 97 17TU4.3.4U1 7T 17TUUse of the tools and methods by water managersU17T __________________________________________ 98 17TU4.3.5U1 7T 17TUSet up of a knowledge networkU17T _________________________________________________________ 98 17TU4.3.6U1 7T 17TULooking beyond the impact of climate changeU17T _____________________________________________ 99 17TU4.3.7U1 7T 17TUSearch for robust, no regret measures and strategiesU17T _______________________________________ 99 17T517T 17TUDISSEMINATION AND VALORISATIONU17T ________________________________________________ 99
17TU5.1U17T 17TUCommunication tools: website and summary sheetsU17T _____________________________ 100 17TU5.2U17T 17TUCommunicating the results to officials, scientists and stakeholdersU17T __________________ 100 17TU5.2.1U1 7T 17TUConferences and workshopsU 17T __________________________________________________________ 100 17TU5.2.2U1 7T 17TUFollow-up committeesU1 7T _______________________________________________________________ 103 17TU5.3U17T 17TUCreating a networkU17T ________________________________________________________ 104 17TU5.4U17T 17TUDissemination of the final resultsU17T _____________________________________________ 104 17T617T 17TUPUBLICATIONSU17T _________________________________________________________________ 105 17T717T 17TUACKNOWLEDGMENTSU17T ___________________________________________________________ 106 17T817T 17TUREFERENCESU17T ___________________________________________________________________ 107 17T917T 17TUAPPENDICESU17T ___________________________________________________________________ 112 17TU9.1U17T 17TUAPPENDIX 1: COPY OF THE PUBLICATIONSU17T ______________________________________ 112 17TU9.2U17T 17TUAPPENDIX 2: MINUTES OF THE FOLLOW-UP COMMITTEE MEETINGSU17T_________________ 112 17TU9.3U17T 17TUAPPENDIX 3: DETAILED RESULTSU17T ______________________________________________ 114
1
0BSUMMARY
1.1
9BContext
Since the beginning of the Industrial Revolution the scale of human impact on the natural environment has become increasingly more important, altering the balance in the climate system / human activities have impacted the natural environment in ever growing measure to the point of rocking the balance in the climate system and thereby triggering effects on temperature and precipitation, and consequently provoking heat waves, drought and flooding as well as a rise in sea level. Climate change is currently regarded as one of the most important threats to the environment and to human well-being. If the observed evolutions of our climate persist, climate change will put an increasing burden on society and on natural systems.
Policymakers can respond to the consequences of climate change in two ways. First, by taking mitigation measures, which are developed to reduce emissions of greenhouse gases, and thus aim to prevent or, at least, limit climate change. Secondly, by the development of adaptation measures in order to limit the impact climate change has on society and ecosystems. In the framework of the ADAPT project, a methodology has been developed to guide selection of optimal adaptation measures. The methodology is specifically focused on adaptation measures to face increased flood risk as a result of climate change, as motivated by the fact that climate change influences rainfall and evapotranspiration, both impacting river flooding.
Available results of Global Circulation Models (GCM) and Regional Climate Models (RCM) provide estimates of the possible changes in precipitation and evapotranspiration patterns as a result of climate change. Rainfall-runoff modeling may be used subsequently for translating those changes in climate parameters into changes in river discharges, accounting for expected evolutions in land use. Those projections are still affected by a significant level of uncertainty due to the climate and hydrological models themselves and, to a greater extent, to the discrepancies in the scenarios used for running these models. Nevertheless, in a number of European river basins, model predictions converge towards a clear increase in peak discharges both in terms of intensity and frequency. Therefore, coping with flood risk will remain a key priority and will increasingly require suitable flood protection.
According to international guidelines, the selection of cost-effective combinations of flood reduction measures and the identification of means to reduce flood consequences should rely on a risk-based approach, taking into consideration not only purely technical criteria but also economic, social and environmental factors. Currently, this is not a common practice in Belgium and abroad. The ADAPT project has been addressing this challenge by the development of a practical methodology for assisting decision making about the selection of cost-effective flood protection strategies in the context of climate change, based on the integrated evaluation of economic, social and ecological effects. In addition, the analysis should be conducted at a sufficiently detailed resolution level to provide valuable outcomes for local river authorities. Therefore, while most flood risk analyses are undertaken at a macro- or meso-scale, the ADAPT methodology relies, to a certain extent, on a micro-scale analysis. Since the project follows a multidisciplinary approach, the ADAPT consortium is composed of five partners of complementary scientific expertise, belonging to the three pillars of sustainable development, to meet the challenges of the integrated analysis of complex problems. Furthermore, the ADAPT project has been working in close collaboration with the CCI-HYDR project. The output of the CCI-HYDR project, which studies climate change impacts on hydrological extremes in Belgium, serves as input for the ADAPT project.
1.2
10BObjectives
After a review of current knowledge of the general climate change effects in Belgium, conducted during Phase I of the project, Phase II has been entirely dedicated to the development of a practical methodology for selecting optimal adaptation measures to cope with climate-induced increased flood risk.
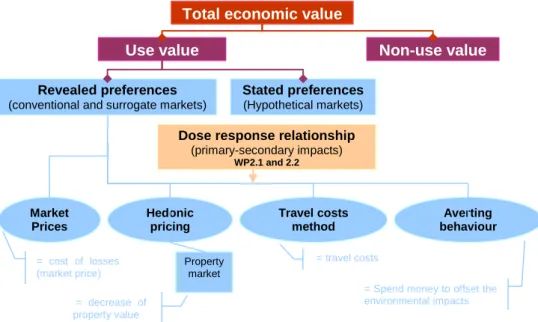
Flood risk is generally defined as the relationship between flood frequency and induced damage. Flood hazard reflects the inundation intensity (such as water depth, flow velocity, rising rate, duration) for a number of discharge values characterized by their exceedance frequency. This latter may be deduced from hydrological modeling or statistical analysis of observed time series. Evaluation of flood impacts involves exposure analysis, i.e. inventorying affected assets (population, buildings, industries, rail and road networks …), estimating their value and vulnerability, describing to which extent the assets are affected by the inundation.
Different types of flood reduction measures can be used while addressing flood risks: technical measures directly limiting the flood characteristics (e.g. dikes, derivation channels, regulatory measures reducing the exposure (e.g. individual flood protections, ban on living in flood risk areas), as well as technical and non-technical measures decreasing the susceptibility of people and assets (e.g. domestic flood protection, flood warning, emergency plans, risk communication). Thus the ADAPT methodology enables us to assess the influence of various technical and non- technical flood protection measures on each of the three components of flood risk, namely hazard, exposure and susceptibility of population and economic assets.
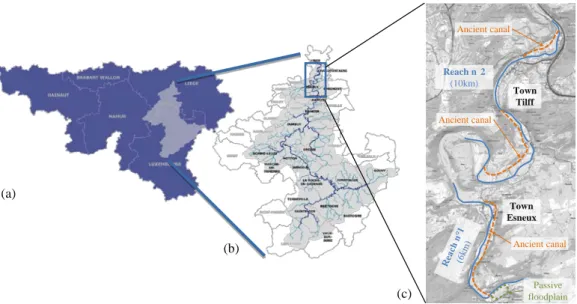
For the development as well as the illustration of the methodology, the study relies on two case studies located in the two major Belgian river basins: (1) part of the river Ourthe (Meuse basin) and (2) part of the river Dender (Scheldt basin). Those study areas have been selected for their flood history, for the interest of their hydraulic, economic, social and ecological characteristics, as well as for their complementarities.
1.3
11BMethodology
The developed methodology relies on a four-step procedure, leading to the selection of most appropriate adaptation measures in terms of integrated cost-effectiveness:
• evaluation of flood risk and impact analysis;
• selection of flood reduction measures, and assessment of the corresponding avoided risk;
• estimation of the cost of each adaptation measure and ranking;
• conduction of an extended Cost-Benefit Analysis (CBA) to evaluate, rank and prioritize adaptation measures.
1.3.1
34BEvaluation of flood hazard
Flood hazard is obtained from ex-ante modeling of flood characteristics by means of hydraulic models, which take the discharge into the river as an input and provide flood maps as an output. The hydraulic modeling approach is different for the two case studies: for the river Ourthe, a detailed quasi 3D hydraulic model is used, while for the Dender, a 1D conceptual model has been exploited.
The flow simulations for the case study of the river Ourthe are conducted by means of the two-dimensional numerical model WOLF 2D, based on the fully dynamic Shallow-Water Equations (SWE) and entirely developed at the University of Liege. The flow model is based on the shallow-water equations, solved by means of a finite volume scheme on multiblock structured grids. For the floodplains along the river Ourthe, topographical data are extracted from an aerial LiDAR (Light Detection And Ranging) Digital Surface Model (DSM), with a horizontal resolution of 1 meter and a vertical accuracy in the range of 15 cm (provided by the Service Public de Wallonie). The hydraulic simulations are all performed on a regular grid of 2m by 2m, which is detailed enough to represent the flow at the scale of individual buildings. The model outputs are dense 2D distributions of water depth and flow velocities in the inundated areas, which are key input data for the subsequent impact assessment. As confirmed by these simulation results, the complexity of topography in the urbanized floodplains requires a two-dimensional flow model as the most credible approach to reliably represent the dynamics of inundation flows. Consequently, the outcomes of hydraulic modelling constitute suitable inputs for the subsequent exposure analysis, performed at a micro-scale using detailed land use maps and a geographical database.
The study is performed for fourteen different discharge values, enabling a correct representation of the final risk curves. In the present situation, exceedance frequency associated with these discharges was obtained from a statistical analysis of long time series of observations. Perturbations in the exceedance frequency will be introduced to account for climate change, based on results of the rainfall-runoff model SCHEME run by RMI in the CCI-HYDR project.
The inundation modeling for the Dender case study is conducted using a one dimensional conceptual model, representing the river as a series of reservoirs and accounting for a general description of the drainage process without including details of hydraulic mechanisms. The model, as well as its variants that have been developed for the different flood defence measures, encompasses the river Dender in Flanders south of the city of Denderleeuw and the river Marke, the main tributary of the river Dender in Flanders. The conceptual model has a low computation time compared to a detailed hydraulic model and generally produces good results for the water levels in the inundated areas. Because of its nature, a 1D-conceptual model is also unable to produce output on some variables needed for the ecological impact assessment. The conceptual model calibration has been done on the basis of the detailed hydraulic models InfoWorks RS model of the river Marke on the one hand and the MIKE 11 model of the Dender on the other hand. This detailed calibration time series has been used for ecological impact assessment.Flood maps, providing the inundation depth along the main course of the Dender, have been computed for all four model variants for a 5, 10, 25, 100 and 250 year return period, given the current climate as well as a low, mean and high climate change scenario. For this the CCI-HYDR climate change scenarios have been used. The Hydraulics Division of the KUL has, in the framework of the cooperation between the CCI-HYDR and ADAPT project, both developed the conceptual model as well as carried out all simulations.
1.3.2
35BImpacts analysis
Impact analysis assesses the effects flooding has on society and the environment. In order to overcome the focus on the direct tangible effects of flooding on economic systems, as in conventional flood risk modeling practice, three complementary flood risk assessment modules have been developed, focusing respectively on the effects of flooding on economic, social and ecological systems. For this purpose, two complementary procedures have been developed, making the best of locally available data in each region, but basically relying on the same fundamental concepts.
Although several studies have demonstrated that social impacts may not be ignored, they are rarely considered in the evaluation of policy measures. Beside the quantification of casualties,
people and socially valuable buildings affected, a methodology has been developed to assess social flood impact intensity. Three main aspects need to be considered when evaluating social impact intensity of floods, namely (i) the flood characteristics provided by hydraulic modeling, (ii) the exposure of the people and valuable buildings and (iii) the vulnerability of the people.
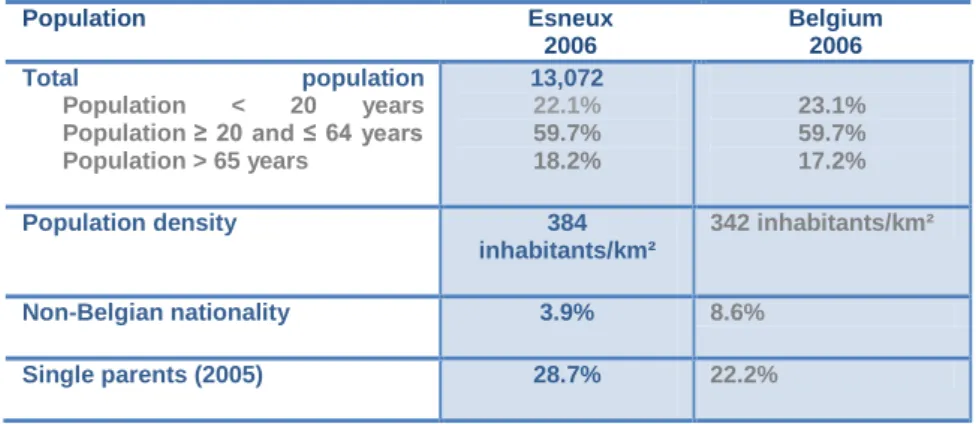
The vulnerability of people involves two aspects: susceptibility of the people and adaptive capacity. Susceptibility refers to the socio-economic characteristics of people. Social susceptibility is assessed here by means of a composed index, which depends on several indicators (available to statistical districts) such as the proportion of elderly persons, people who are ill, single parents, foreigners, people on a low-income and people living in houses on one level. The indicators are aggregated and weighted. The index obtained is used to identify the degree of social susceptibility. The adaptive capacity of society is also considered since the social flood impacts may be mitigated by preparatory, protective or curative measures. A composed index is used to quantify the adaptive capacity for a geographical area, reflecting the availability of measures such as private protection, flood forecasting and flood warning or psycho-social support. , An adaptive capacity score is then derived from these indicators. Based on water depth, flow velocity, water rise velocity and flood duration, a flood index is constructed and combined with the susceptibility index and the adaptive capacity score to obtain a social flood impact intensity index which indicates the intensity or severity of the social flood impact experience. Indeed, due to their intangibility, social flood impacts are hard to quantify separately and it is thus appropriate to use an aggregated index indicating the level of severity of the social flood impacts and enabling relative comparison between areas to prioritize risk reduction needs.
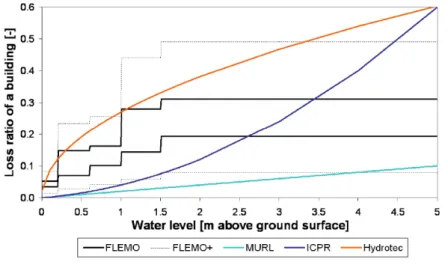
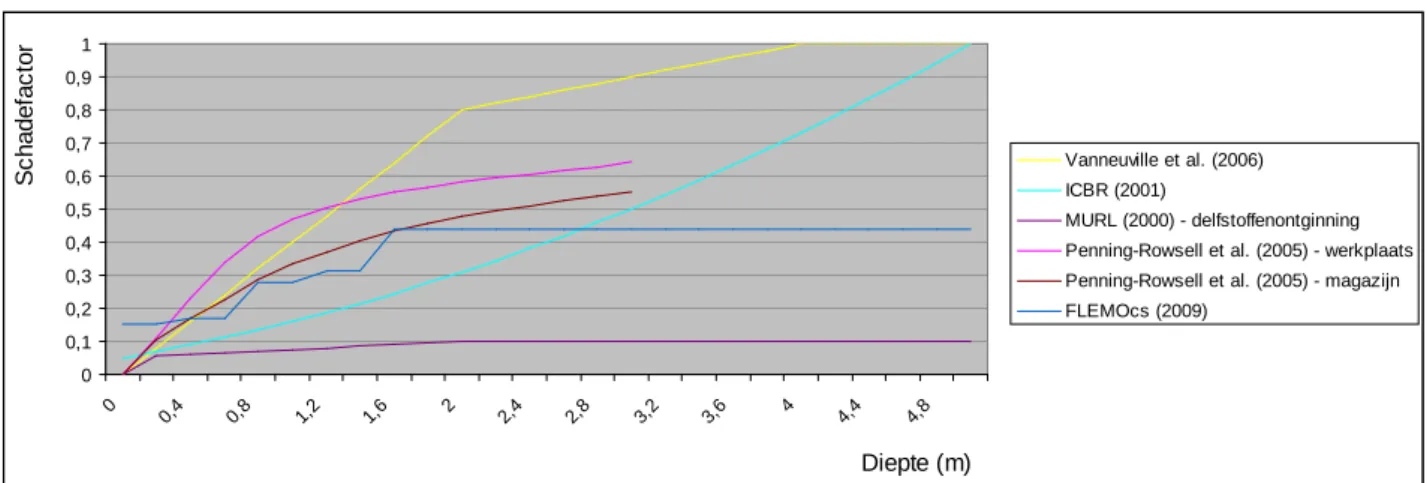
After exposure analysis, a relative damage function is applied for each affected asset to deduce economic damage as a percentage of its total value. Relative damage functions are considered as the standard approach to evaluate flood damage. They establish a link between induced damages and hydraulic parameters, i.e. mainly water depth and flow. This link is validated with available data from previous events. Other parameters may also be included, such as flood duration. Much care is required when selecting and applying a damage function, due to the diffusion of the large number of existing functions throughout the results. The present methodology concentrates on direct economic damage to residential buildings, as the results show that they are the main component of total flood damage for both case studies. Although a standard methodology is applied here for economic damage evaluation, the analysis remains innovative as a result of the scale at which it is conducted, preserving the detailed distribution of the inundation characteristics provided by the hydraulic models.
The ecological effects of changes in flooding regimes relate to changes in vegetation development. We present a methodology to evaluate the constraints of flooding characteristics on floodplain vegetation development. The most direct impact of inundation on vegetation is the drowning of vegetation through oxygen depletion in the root system. This mechanism was taken as the basis for the practical vulnerability assessment method. Flood vulnerability/tolerance maps are calculated for different vegetation communities and for different flood types (combinations of timing, regularity, duration and depth). It is demonstrated how flood time series are classified into flood type occurrences and are combined with the vulnerability maps. The cumulative impact is calculated and visualised for a study site. Changes in flooding regimes can have positive or negative effects on ecological values and/or the ecosystem services they provide. The disappearance of certain vegetation types also enables the development of other, perhaps more desirable vegetation communities. Nevertheless, flooding is only one constraint on vegetation development, whilst there are numerous other constraints that are far more important (management, groundwater regimes, nutrient availability, soil buffer capacity).
1.3.3 Evaluation of adaptation options
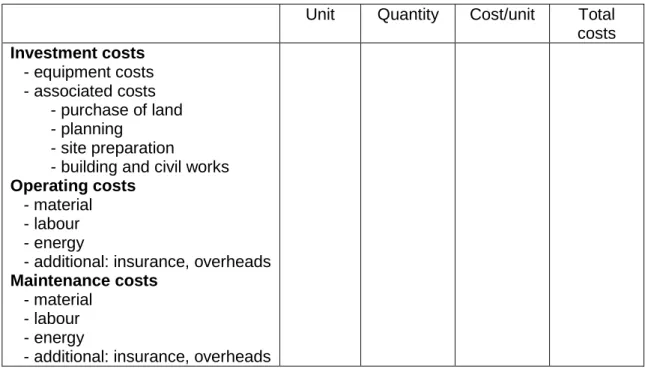
A first step for the evaluation of the direct costs of adaptation was to define the cost components to be taken into account. This task was carried out taking into account the European Commission’s guidance document “Common Implementation Strategy for the Water Framework Directive”, focusing on the implementation of the economic elements of the Directive, as well as other reports published by international agencies and specific studies on flood protection measures. It came out that financial costs, with their three major components (investment, operating and maintenance costs) formed the core basis for the evaluation of the direct costs of flood adaptation measures based on the discounted cash flow approach.
The second step was then to evaluate the cash flows linked to the adaptation measures. Since the literature review that was carried out offered limited insights into the costs of the adaptation measures at the micro-scale level, it was decided to follow an approach that was initially conceived as complementary to the literature review: interviewing entrepreneurs on the costs of the measures. The result of the enquiry was of a qualitative nature, with in-depth interviews of entrepreneurs, and provided assessments of the direct costs of adaptation that rest on their expert judgment.
In order to be able to structure and integrate all relevant information, so as to enable decision making which maximises welfare, an extended cost-benefit analysis (extended CBA) based decision support model was developed. This model has been used to evaluate the scenarios considered for both case studies. In this model an MCA is used to rank the different scenarios. The problem, however, is that an MCA does not say whether the benefits of the scenarios considered do outweigh related costs (whether the scenarios create or destroy welfare). If the costs of a scenario surpass the expected benefits, the scenario should not be carried out from an economic point of view. In order to overcome this disadvantage, the model is extended with an implicit cost-benefit analysis. The welfare effect is assessed by the economic net present value (ENPV) of the project. Next, the model offers various options for carrying out a comprehensive Monte Carlo based uncertainty and sensitivity analysis as channeling uncertainties is an important part of the decision making process.
1.4
12BResults
1.4.1
37BSelected adaptation measures and flood risk impacts
Several adaptation measures have been selected taking into account the specificities of the two flood areas, as well as the technical maturity of the measures and their availability on the market.
UFor the Ourthe case study, Uthe selected measures cover:
• the rehabilitation of an old canal (scenario 1),
• the permanent heightening of protection walls (scenario 2),
• the heightening of protection walls using mobile protection walls (scenario 3), • the activation of a passive floodplain (scenario 4).
Scenarios 2 and 3 are, in fact, a variation of the same measure, and their effectiveness is therefore equivalent, but the investment costs vary. The baseline scenario is the current situation.
risk irrespective of the climate scenario. The higher the flood risk in the baseline scenario, the higher the risk reduction. The activation of an old flood plain is expected to be the most effective measure for the reduction of the social flood risk, except for the high climate change scenario. The heightening of walls, either permanently or by means of mobile aluminium beams, is the most effective measure for the reduction of the economic flood risk and also offers good results for reducing the social risk.
Assumptions concerning the economic growth, population dynamics, project horizon and discount rate do influence the results, but the conclusions remain valid.
UFor the Dender case studyU, an alternative approach has been tested, and the scenarios are built
on a combination of flood protection measures:
• Strict ban on building + dike heightening (scenario 1);
• Strict ban on building + dike heightening + replacement of the weirs (scenario 2);
• Strict ban on building + dike heightening + replacement of the weirs + construction of retention basins (scenario 3).
As well as scenarios for assessing the effect of complementary measures : • Strict ban on building in flood prone areas + dike heightening
• Strict ban on building in flood prone areas + dike heightening + risk communication
• Strict ban on building in flood prone areas + dike heightening + risk communication + improved flood forecasting and warning
It can be observed from the results that the current situation, i.e. scenario 1, reduces both the social and economic flood risk. This reduction, however, is very limited. In a low climate change scenario the expected social flood risk even slightly increases. The other two adaptation scenarios lead to an increase in both the social and economic flood risks, at least on the basis of the flood data that have been used for calculations. One should, however, not overlook the fact that the retention basins undo some of the negative effects on flood risk which the weirs are expected to generate. The construction of the weirs seems, at least from these results, not a good option for reducing flood risk along the Dender in the communities of Geraardsbergen and Ninove.
1.4.2
38BRanking
For the Ourthe case study, the ranking of the scenarios on the basis of multiple evaluation criteria shows us that the rehabilitation of the old canal (scenario 1) is by far not the prefered option if only one measure has to be selected. The investment costs of this canal are simply much too high and the resulting reduction in flood risk is much too limited. The performance of the other scenarios seems to be quite similar. This is, however, a bit misleading since the rehabilitation of the old canal is an outlier which tends to camouflage the differences between the other scenarios in a multicriteria analysis. A closer look at the results shows that wall heightening (scenarios 2 and 3) outperforms the reactivation of the old flood plain (scenario 4). Since the net present value of the investment, operating and maintenance costs of a permanent wall (scenario 2) are expected to be only two thirds of the cost of a mobile wall made up of aluminium beams (scenario 3), permanent wall heightening is the best option to reduce the impacts from flooding along the Ourthe in our study area. Only if our current estimate underestimates the visual disamenity caused by a permanent wall, investing in a mobile wall will become relatively more attractive. This is not only
the case when studying the current climate. All the above conclusions are equally valid for the three climate change scenarios.
For the Dender case study, the ranking of the scenarios on the basis of multiple evaluation criteria, shows that the current situation, the baseline scenario + dikes, (scenario 1), is by far the most attractive scenario. The scenario dikes + weirs + retention basins (scenario 3) is the least prefered scenario. The most dominant factor influencing the ranking of the scenarios is that of the investment,operating and maintenance costs. The avoided social and economic flood risks do not play a determining role in the ranking of the scenarios. All the above conclusions are equally valid for the three climate change scenarios.
1.4.3
39BExtended CBA
The extended CBA based decision model consists of three modules: an extended cost benefit analysis, a sensitivity analysis and a risk analysis. The development, selection and fine-tuning of welfare maximising scenarios requires a CBA based decision framework, as this is a prerequisite to go beyond the simple ranking of two or more scenarios, which cannot be facilitated by a multi-criteria analysis (MCA). CBA requires that the effects are expressed in monetary terms. Effects that cannot be monetised need to complete the monetary evaluation. A CBA is a tool to evaluate whether the benefits of a measure, project or policy outweigh the associated costs. Scenarios with a negative ENPV should better not be realised. The cost-effectiveness is also considered, which indicates to what extent the benefits of a project outweigh the associated costs and what benefits are realised for every invested euro.
For the Ourthe case study the permanent heightening of flood protection walls would yield a positive ENPV in all climate change scenarios considered, given the basic assumptions. The highest benefits are to be expected in the high climate change scenario. The scenario with the mobile walls will only contribute positively in economic terms in the high and mean climate change scenarios. The activation of the old flood plain should only be carried out if a rise in the high climate change scenario is expected. The rehabilitation of an old canal is not an interesting option. It would definitely reduce the balance between costs and benefits, given that it is a very expensive measure and is not expected to reduce flood risk more than the other measures considered, but rather do the opposite. Changing certain parameters does influence the results. A drop in the discount rate increases the ENPV of all scenarios, while an increase has a counter-effect. The opposite is true for economic and population growth - the higher the growth the higher the expected ENPV of the scenarios. A drop in the importance of the social flood risk relative to the economic flood risk will decrease the overall benefits and thus the ENPV of the scenarios. The ranking of the scenarios is not altered, given the changes in the assumptions just described. With the exception of scenario 1, i.e. strict ban on building in flood prone areas, the scenarios considered for the Dender consist of multiple measures. This makes it harder to evaluate the contribution of individual measures. The current situation, i.e. strict ban on building in flood prone areas + dike heightening (scenario 1), reduces both the social and economic flood risks. This reduction, however, is very limited. In a low climate change scenario the expected social flood risk even slightly increases. The other two adaptation scenarios are expected to increase both the social and economic flood risks, at least on the basis of the flood data used. It can be noticed that the flood retention basins reduce some of the negative effects which the renewal/adaptation of the weirs is expected to generate. A scenario 0 "current situation" ranks first, but its ENPV is negative. The ENPV of scenarios 2 (strict ban on building with dikes + weirs and the scenario with dikes + weirs + retention basins is even much lower.
The construction of the weirs seems, at least from these results, not a good option for reducing flood risk along the Dender in the communes of Geraardsbergen and Ninove. One should be very
careful with this conclusion as it is not in line with what can be logically expected. The replacement/adaptation of the old weirs should normally create a higher drainage capacity, at least party removing the bottleneck which they created. Nevertheless the replacement/adaptation of the old weirs will be very beneficial for their operational safety (reducing both the risk for the workers operating them and the risk of their failure). Furthermore, this investment would also be interesting for the navigability of the Dender. A similar picture can be drawn for the planned retention basins. Although these basins are expected to reduce flood risk along the Dender, they are primarily constructed for solving flood problems locally, along the tributaries of the Dender.
Changes in the values of the scenarios on certain decision criteria or in the weights attached to the decision criteria may possibly influence the ranking of the scenarios. The uncertainty and sensitivity analyses revealed that the chance is relatively limited that any other scenario would be more attractive than the permanent heightening of walls.
1.5
13BConclusions and contribution to scientific policy support
In both case study areas three flood protection scenarios have been studied. Where the scenarios studied along the Ourthe are expected to be all effective in terms of risk reduction, this is not the case for the scenarios examined in the Dender case study.
In both case study areas climate change will effectively change flood risks. In a low climate change scenario flood risks are expected to decrease while in a high climate change scenario risks are expected to increase. Given the current climate and assuming a strict ban on building in both case studies the absolute flood risk is more than a factor 20 higher in the Ourthe case study. In addition, the expected increase in flood risk when climate change would hit hard is relatively much more important along the Ourthe than along the Dender.
Protection against flooding is becoming more and more expensive. Taking additional technical measures is not straightforward, as flood risks are generally relatively limited in Belgium. Quite often much has been done already to limit both the occurrence and impacts from flooding. In addition it is all the more difficult to get the necessary permits for implementing a measure that has a clear spatial impact. In response to these observations complementary, non-technical, measures should be looked at deliberately, focussing on prevention, awareness raising, disaster management and the creation of the necessary capacity to cope. In order to leave the conceptual discussion about such complimentary measures we have evaluated the possible benefits of a ban on building, risk communication, flood forecasting and warning.
Preventing the increase of the values located in flood risk areas has shown to be a very interesting measure both in terms of its likely effect on welfare as its cost-effectiveness. Limiting the values-at-risk should be the cornerstone of any flood management strategy. Both ordinary citizens and local and national authorities should be made well aware of the actual flood risk in order to ensure the acceptance of a strict clampdown on building.
The original methodology developed for flood risk evaluation, together with its application to two different (and complementary) real-life case studies has enabled us to draw a number of conclusions of practical importance for flood managers and water authorities. Some of the in-depth analyses of flood protection measures have notably emphasized the need to evaluate and select flood protection measures based on a wide range of discharges and not simply use one single flood design. Results of exposure analyses have also revealed that they already provide valuable support for orienting a wide range of practical decisions, with the advantage of being unaffected by additional uncertainties underlying socio-economic impact analyses.
More contributions of the project to a policy oriented at promoting sustainable development are highlighted in the ADAPT report, along with a number of practical recommendations for policymakers.
1.6 Keywords
Flood risk analysis; micro-scale; inundation modeling; land use maps; exposure; vulnerability; adaptive capacity; adaptation measures
2
1BINTRODUCTION
Climate change is currently regarded as one of the most important threats to the environment and human well-being. This was recently confirmed by the release of the IPCC Working Group II Report on ‘impacts, adaptation and vulnerability’ (IPCC, 2007). It is very likely that people will be confronted with a temperature increase, changes in the quantity, intensity and patterns of rainfall, heat waves, drought, flooding and sea level rise. Doing nothing to limit the threats will result in multiple damages that will put an increasing burden on our societies as is demonstrated by the Stern Review (2006) and IPCC (April 2007).
Generally two approaches are developed to respond to climate change. Firstly mitigation policy, which focuses on greenhouse gas reduction and therefore preventing or at least limiting climate change. Secondly adaptation policy, which focuses on reducing the consequences of climate change on socio-economic systems and ecosystems. The ADAPT project deals with this second aspect of adaptation policy.
A large range of measures to adapt to climate change is available, from preventive and source-oriented measures to effect-source-oriented and curative measures. Allocating resources within the context of climate change adaptation is highly complex, due to the prevailing uncertainties and high stakes. Therefore, decision support systems have been developed as tools to assist policy makers in their choice between different measures. Amongst those systems, economic cost-benefit analysis (CBA) is a widely used and recognised decision support tool in order to select the optimal measures (OECD, 2006). However, CBA has also its limitations. Not the least of these limitations lies in the fact that the effects taken into account in the analysis have to be quantified and expressed in monetary terms. Therefore, complementary approaches based on multi-criteria analysis (MCA) are useful to partly remove this limitation, by allowing non-monetary information, both quantitative and qualitative, to be taken into account.
The objective of the ADAPT project is to develop an integrated decision support tool that aims to evaluate the climate change impacts and the impacts of adaptation measures in terms of costs and benefits (avoided risks) and consequently enable the selection of the most optimal adaptation measures. The tool is developed based on the specific climate change impact on river flooding, which may be due to alterations in rainfall and evapotranspiration patterns. Innovative elements in the tool developed within the ADAPT project are firstly, the inclusion of climate change effects on river flooding at the meso-scale which “consider aggregated land use units, e.g. residential areas and industrial areas” (Floodsite, 2007, p. 29). This is currently not common practice in Belgium (Grinwis M. and Duyck M. 2001; Boukhris et al. 2006). Secondly, the tool considers not only material effects, but also social and ecological impacts. Decisions that are partial based on the material effect assessments may result in systematic errors (Meyer and Messner 2005). Thirdly, the tool enables the evaluation of technical and non-technical adaptation measures, while the emphasis has been put on technical measures in the project..
The integrated decision support tool is developed and applied on two case study areas in the main Belgian river basins (the Scheldt and the Meuse basin): (1) Geraardsbergen and Ninove which are located near the Dender and (2) Esneux which is situated near the Ourthe. A first prerequisite to carry out the flood risk analysis is the presence of hydraulic models in these two case study areas. The hydraulic model of the Dender has been developed by the Hydraulics Division of the KUL in the framework of the cooperation between the CCI-HYDR and ADAPT project, while the hydraulic
model of the Ourthe case study is developed by the HACH team of Ulg. Secondly both case study areas are selected because of their flooding history during the past 20 years. Geraardsbergen and Ninove have experienced inundation in 1993, 1995, 1998, 1999, 2001, and at the turn of the year 2002-2003. Esneux has been flooded in 1991, 1993, at the turn of the year 1993-1994, 1995 and 2002. The third selection criterion is the social and political debate that is going on in these case study areas about the measures that should be taken to reduce flood risks in the future.
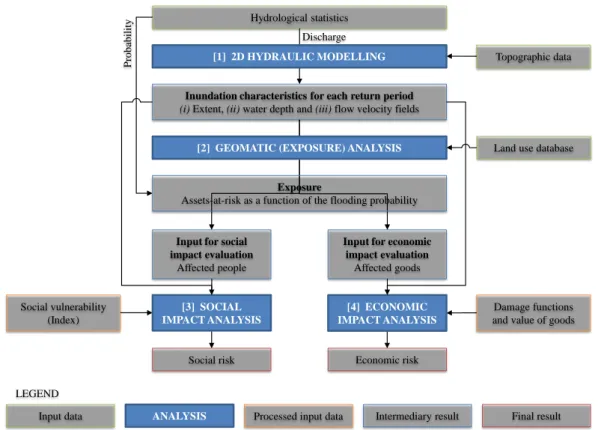
The ADAPT extended CBA – MCA decision tool for adaptation measures in the context of climate change induced river flooding: overview of the different stages.
The extended CBA - MCA decision tool is an ex-ante evaluation tool that mainly focuses on the estimation of climate change impacts on river flooding on the one hand and on economic, social and ecological impact assessment on the other hand.
Figure 1: Analytical framework of the Adapt project
2.1
15BObjective 1 (WP2.1) Evaluating primary impacts of global change
induced flooding on river basins: Hydraulic modeling
In the first stage of the decision tool, a hydraulic model is applied to estimate the impacts of climate change on river flooding. Flood maps are the output of the hydraulic models. The hydraulic modeling in the two case study areas is different. In the Dender case study, flood maps have been simulated by the Hydraulics Division of the KUL in the framework of the cooperation between the CCI-HYDR and ADAPT project, using hydrological modeling as an input for the hydraulic
modelling. The CCI-HYDR project, also financed by the Belgian Science Policy, has projected the likely effects of climate change on precipitation and evapotranspiration in terms of three scenarios: a high, a mean and a low climate change scenario. Via the expected changes in these two parameters the possible change of the discharge into the river Dender has been simulated by means of hydrological modelling. For the Dender case study the hydrological modelling output is fed into a conceptual hydraulic model of the Dender. This model has a very low computation time without giving up much accuracy compared to the detailed MIKE 11 model of the Dender and the InfoWorks RS model of the river Marke, a tributary of the Dender, on the basis of which the conceptual model has been calibrated (De Boeck, 2008; Verbelen and Van Steenbergen, 2009).
The hydraulic model of the Ourthe basin is based on the use of historical hydraulic data from gauging stations. Climate change effects are accounted for by assuming changes in the expected peak discharge for fourteen different river discharges. For each climate scenario (the current climate as well as the three climate change scenarios) a return period has been attached to each peak discharge by the RMI in the framework of the cooperation between the CCI-HYDR and ADAPT project, making use of the SCHEME model. (Archambeau et al. 2004; Erpicum et al. 2007; Erpicum et al. 2008)
2.2
16BObjective 2 (WP2.2) Evaluating secondary impacts of global change
induced flooding on ecosystem and society: flood risk assessment
Flood maps are the output of the hydraulic modeling. The second step in the decision support tool is the ex-ante assessment of flood risks. In particular, the risk modeling procedure estimates the impact of flooding on the economic system, the social system and the ecosystem. The risk modeling procedure of the each of the different effects is built on a comparable flood risk assessment framework.
Flood risks are the result of the function of flood event probability and consequences. The consequences of flood events depend on the exposure of the elements at risk, the values of the element at risk and the vulnerability of the elements at risk. Information on probability is embedded in flood maps, while information on exposure results from a combination of flood maps and land use data.
The assessment of the value of elements at risk is generally less obvious due to the intangibility of some effects. The way society value the effects is not easy to determine. In particular social and ecological impacts are confronted with this difficulty and as a consequence, they are not always expressed in monetary terms.
The last building block of flood risk is vulnerability of the elements-at- risk. This is a function of susceptibility, adaptive capacity and resilience to flooding. Acknowledging the diverse use of these concepts within different disciplines, the concepts used within the Adapt project should be defined Vulnerability is defined as the ability to cope with flooding, in other words to prepare, to resist and to recover from flooding. This ability is affect firstly by the susceptibility of the element-at-risk. Some elements-at-risk have a low ability to cope with flooding due to specific characteristics. Adaptive capacity is an indicator of a system’s ability to decrease the susceptibility of that element to flooding over time. The resilience of elements-at-risk refers to the system’s capacity to recover.
Extensive literature review, statistical information, interviews of local people, expert knowledge and comprehensive multi-partner effort are the basis of data collection on these building blocks. The output of the flood risk modelling is a quantitative or qualitative estimation of the risk. In addition, GIS modelling is used to illustrate the spatial distribution of the flood risks and their underlying causes.
2.3
17BObjective 3 (WP2.3): determining adaptation measures
The output of flood risk modelling is the critical input for the identification of potential adaptation measures. The risk modelling output provides an insight in the spatial distribution of flood risk and thereby allows for the identification of those sites where action is needed. Ideally calculated flood risk is complemented with locally available information. Local authorities and people living in the area-at-risk often hold valuable information on the causes underlying the flood problem. Studying
adaptation measures requires a thorough insight in the flood problem and thus calls for going beyond the simple analysis of modelled flood risk.
2.4
18BObjective 4 (WP2.4) : evaluating adaptation measures costs
Once the adaptation measures have been selected, it is necessary to evaluate the direct costs of the selected measures, in order to proceed to the extended cost benefits analysis. Considering the micro scale adopted for the project, it is important to provide estimations of the direct costs that reflect as accurately as possible the cash flows linked to the selected measures. In order to do so, it is not only necessary to take general guidelines on cost benefit analysis in the framework of environmental measures into account, but also to make a review of the literature and to complement it with interviews of entrepreneurs that can provide expert judgement on the average costs linked to the selected measures.
2.5
19BObjective 5 (WP2.5) : Evaluation of adaptation scenarios by means of an
extended cost benefits analysis
The main challenge is to integrate and to equally assess effects since some of them are expressed in monetary terms, while others are quantitatively or qualitatively expressed. To handle this challenge the developed decision support model takes the form of an extended CBA. This decision framework prioritises the use of monetised effects but offers an MCA based framework for presenting and dealing with non-monetary information in a balanced way, so as to make sure decisions are made on all available information. The model also provides the possibility to submit the outcome of the analysis to an extensive sensitivity analysis and Monte Carlo based risk analysis.
The first part of the report explores the methodology of the decision support tool. Chapter III.1 describes the purpose and methodological aspects of the extended decision support tool. Chapter III.2 considers the various building blocks of the decision support tool, as there are the flood risk calculation, the flood risk model development and the economic, social and ecological impact assessments. In chapter III.3, the adaptation costs evaluation methodology is explained. The methodology is applied on two Belgian case studies: Geraardsbergen and Ninove, and Esneux.
2.6
20BObjective 6 (WP2.6): recommendations on adaptation of measures
Deciding about the way how to deal with flooding and its effects can be very complex. Maximising welfare, given limited resources, comes down to balancing all pro’s and contra’s of the envisaged strategies; also considering the acceptance of the measure by the public as well as the consistency of the measures with other sectoral claims and strategies. The fact climate is changing only increases uncertainty and thus the complexity of any deliberation.
First a brief summary of the added value of the project for promoting and facilitating sound decision making about adaptation to flooding in a climate change context is presented. The emphasis, however, is on a number of recommendations that touch policy making in various ways. A first set of recommendations concern the impact assessment methods that have been developed and/or improved as there is still margin for improving them. The priorities in this respect are highlighted. The same has been done for what concerns the mapping and channelling of uncertainties in an integrated decision framework. Besides, practical advise is provided on the involvement of people and stakeholders in the assessment and optimisation of adaptation scenarios. Another set of recommendations touch a number of key conditions for making sure water managers will effectively make use of the methods and results of the research project. Finally, a plea is held for robust, no regret measures and strategies.
3
2BMETHODOLOGY AND RESULTS
3.1
21BORIGINAL FRAMEWORK DEVELOPED FOR ESTIMATING FLOOD RISK
ALONG BELGIAN RIVERS
3.1.1
40BMethodology for hydraulic modeling
Two approaches have been developed for estimating the flood maps in each case study: a 1D flow model and a fully dynamic quasi 3D model. The characteristics of these two modelling approaches are described here after.
3.1.1.1
61B1D flow model
This section describes the flow model used for the Dender case study.
The inundation modelling for the Dender case study is facilitated by a conceptual model that has been developed by De Boeck (2008) and Verbelen and Van Steenbergen (2009) under the supervision of Prof. Dr. Ir. P. Willems of the KUL. The model represents the river as a series of reservoirs and contains a general description of the drainage process, without including the specific details of process interactions. The main advantage of a conceptual model is it has a low computation time compared to a hydrodynamic model. This makes a conceptual model a particular interesting tool for studying adaptation measures. The disadvantage of a conceptual model is it has to be calibrated to either the results of hydrodynamic modelling or measurement data. Because of the limited availability of historical measurements necessary for the calibration of the model, this calibration has been done on the basis of the detailed InfoWorks RS model of the river Marke on the one hand and the detailed MIKE 11 model of the Dender on the other hand. It is important to keep in mind the hydrodynamic models are already an approximation of the real situation. (De Boeck, 2008; Verbelen and Van Steenbergen, 2009). In this type of models (Quasi 2D), floodplains are modeled as 1-dimensional floodbranches. Floodvolumes are calculated using DEM-based cross-sections. Flood extent maps are based on the water level results along the floodbranches, and geographically visualized by means of GIS routines. The use of the quasi-2D approach allows a significant reduction of the model calculation time in comparison with a more detailed full 2-dimensional approach.
Whatever method was used (conceptual or quasi-2D), the hydrodynamic river model required inputs from a rainfall-runoff model. For the Dender, lumped conceptual rainfall-runoff models were calibrated for each of the 12 subcatchments. They produce continuous time series of hourly rainfall-runoff discharges (e.g. from 1967 onwards). Simulation of the full series is only feasible for the conceptual river model; calculation times in the quasi-2D river hydrodynamic model would be unacceptably high. After simulation of the full series, a post-processing step is applied to extract independent high flow extremes from the full series. These extremes are statistically analyzed using extreme value analysis, for the range of relevant time scales (e.g. from 1 hour to 15 days), and to construct discharge / duration / frequency relationships. From these relationships, return periods of flood events of various magnitudes (including historical events, or hypothetical future events after climate changes) can be obtained. They also were used to develop synthetic hydrographs (the so-called composite hydrographs), which allows to reduce calculation times when simulating rainfall-runoff input in the quasi-2D hydrodynamic model. The details on the technical aspects of this complete methodology can be found in the CCI-HYDR project report.
Four variants of the 1D conceptual model have been developed. Each variant accounts for a different set of flood defence measures. All models encompass the river Dender in Flanders south
of the city of Denderleeuw and the river Marke, the main tributary of the river Dender in Flanders. Flood maps, providing the inundation depth along the main course of the Dender, have been simulated for the four model variants for a 5, 10, 25, 100 and 250 year return period by Verbelen and Van Steenbergen (2009). Next to a set of simulations for the current climate, the inundation depth has also been simulated taking into account the possible effects of climate change. On the basis of a the perturbation tool developed in the framework of the CCI-HYDR project the historical precipitation and evapotranspiration data for the study area were both perturbated to arrive at values that correspond to a low, mean and high climate change scenario. These values were then translated into the corresponding discharge into the river for the return periods considered. These hydrological data were then fed into the conceptual hydraulic model to simulate flooding along the Dender for all four climate change scenarios. (De Boeck, 2008; Verbelen and Van Steenbergen, 2009)
For the analysis of extreme events and the fast calculation of scenarios, this is an excellent method. The conceptual model of the Dender produces good results for the water levels in the inundated areas. The validation that took place on the basis of simulations with the MIKE11 model, however, showed the water levels in the last reservoir are currently overestimated. This is due to an underestimation of the routing in this part of the river. (Verbelen and Van Steenbergen, 2009). The method, however, was found less useful (or at least had many limitations) for use in ecological impact investigations. These investigations indeed require statistical information not only on extreme events, but also on less extreme events. The full time series of rainfall-runoff discharges thus needs to be simulated in the river hydrodynamic model (the conceptual model thus would be required for that purpose) and statistically post-processed also for the lower events. Given that the statistical analysis on higher extremes is based on an extreme value theory (given the limited number of extreme events available in the time series) and for extrapolation purposes, the analysis for lower extremes requires a different approach (extreme value theory is not applicable below a threshold; but statistical analysis can be done empirically / non-parametrically given the larger number of less extreme events in the series). Another, more important problem is that the floodplain modelling methodology, as outlined above, is developed for the quantification and mapping of the maximum spatial extent of specific flood events (historical or synthetic, and independent on the flood season). For the ecological impact study also other variables such as the flood duration, the temporal evolution of the floodplain filling, the flood season, etc., are required. These outputs are by default not provided. The flood duration can be modelled with the quasi-2D approach but largely depends on parameters describing the drainage or soil infiltration capacity. These parameters need calibration, while calibration data on the duration of historical floods is most often not available. Also extraction of information on the flood season requires additional post-processing and validation.
Given the fact water management in Flanders is divided over several actors, depending on the navigability and category of the water course. There currently is no hydrodynamic model that integrates the Dender and its side branches, let alone the watercourses feeding the side branches. The development of a meticulously calibrated conceptual model could proof valuable to design an optimal flood management strategy on a basin wide level.
3.1.1.2
62BFully dynamic quasi-3D flow model
This section describes the flow model used for the Ourthe case study.
Mathematical model
Since interactions between the main channel and the floodplain are important during flooding and may therefore not be neglected (McMillan and Brasington 2008), the assumption of one dimensional modelling would not be acceptable in many cases involving complex floodplain geometries, in particular in urbanized areas. Therefore, the present study was based on the detailed quasi-three-dimensional flow model WOLF 2D, developed at the University of Liege
(Dewals et al. 2006a; Dewals et al. 2006b; Dewals et al. 2008b; Erpicum et al. 2009a; Erpicum et al. 2009b; Erpicum et al. 2009c).
The model relies on the depth-averaged equations of volume and momentum conservation, namely the “shallow-water” equations (SWE) (Chaudhry 1993). The bottom friction is conventionally modelled using an empirical law, such as the Manning formula. The model enables the definition of a spatially distributed roughness coefficient and provides the additional possibility to reproduce friction along side walls by means of a process-oriented formulation (Dewals et al. 2008b; Erpicum et al. 2009c; Roger et al. 2009).
The internal friction may be reproduced by different turbulence closures included in the modelling system, from simple algebraic ones to a complete depth-averaged k-ε model (Erpicum et al. 2009c).
Numerical implementation
The flow model deals with multi-block Cartesian grids. This feature increases the size of possible simulation domains and enables local mesh refinement close to interesting areas, while preserving lower computational cost required by Cartesian compared to unstructured grids for a same order of accuracy.
A grid adaptation technique is used to restrict the computation domain to the wet cells and a narrow strip surrounding them. The grid is adapted at each time step. Wetting and drying of cells is handled free of mass and momentum conservation error by means of an iterative resolution of the continuity equation.
The space discretization is performed by means of a finite volume scheme. Variable reconstruction at cells interfaces is either constant or linear, combined with a slope limiter, leading in the latter case to 2P
nd
P-order space accuracy. The advective fluxes are computed by a Flux Vector Splitting
(FVS) technique developed by HACH-ULg. Besides requiring low computational cost, this FVS offers the advantages of being completely Froude-independent and of facilitating a satisfactory adequacy with the discretization of the bottom slope term (Erpicum et al. 2009a; Erpicum et al. 2009b). This FVS has already proven its validity and efficiency for numerous applications (Dewals et al. 2006a; Dewals et al. 2006b; Erpicum et al. 2007; Dewals et al. 2008b; Erpicum et al. 2009a; Roger et al. 2009).
Since the model is applied to compute steady-state solutions, the time integration is performed by means of a 3-step first-order accurate Runge-Kutta algorithm, providing adequate dissipation in time. For stability reasons, the time step is constrained by the Courant-Friedrichs-Levy (CFL) condition. A semi-implicit treatment of the bottom friction term is used, without requiring additional computational cost (Caleffi et al. 2003).
Automatic mesh refinement
In addition, the model includes an automatic mesh refinement algorithm (AMR). For steady-state simulations, the AMR tool consists in performing the computation on several successive grids, starting from a very coarse one and gradually refining it up to the finest one. When the hydrodynamic fields are stabilized on one grid, the solver automatically jumps onto a finer one. The successive solutions are interpolated from the coarser towards the finer grid. This fully automatic method considerably reduces the number of cells in the first grids, while increasing the time step, and thus substantially reduces the total run time, despite slight extra computation time required for meshing and interpolation operations (Dewals et al. 2008a; Erpicum et al. 2009a).
Topographic data
High resolution and highly accurate topographic datasets have become increasingly available for inundation modelling in a number of countries. In Belgium, a data collection programme using airborne laser altimetry (LIDAR) has generated high quality topographic data covering the floodplains of most rivers in the southern part of the country. Simultaneously, the bathymetry of the main rivers has been surveyed by means of an echo-sonar survey. Consequently, combining data generated from those two remote sensing techniques enables to obtain a complete Digital Surface
Model (DSM) characterized by a horizontal resolution of 1m by 1m and a vertical accuracy of 15cm.
Those high quality topographic data combined with simulations performed on grids as fine as 2m by 2m enable to set the value of roughness coefficients to represent only small scale roughness elements and not to globalize larger scale effects such as blockage by buildings. It also enables to conduct inundation modelling at the scale of individual streets and houses.
Nevertheless, since inundation flows may be extremely sensitive to some local topographic characteristics, such as for instance the exact height of a protection wall, a key step consists in validating and enhancing the DSM by removing residual obstacles non relevant for the flow (e.g. vegetation), by integrating additional sources of topographic data (including limited field surveys) as well as the detailed geometry of flood protections and other hydraulic structures (such as weirs or water intakes).
Validation
Since 2003, the flow model WOLF 2D has been applied to conduct inundation modelling along more than 1000km of rivers in the southern part of Belgium. For this purpose, accurate Light Detection And Ranging (LiDAR) topographic data are used, obtained from an airborne laser remote sensing. They are characterized by a horizontal resolution of 1 by 1 meter and an elevation accuracy of 15 centimetres.
In this context, the model has been extensively validated by comparison of the numerical results with observed flood extents and measured water depths during recent flood events. Reference data were obtained at gauging stations, collected by field surveys or deduced from aerial pictures of the flood. Only the latest provide spatially distributed observations and are not restricted to pointwise comparisons.
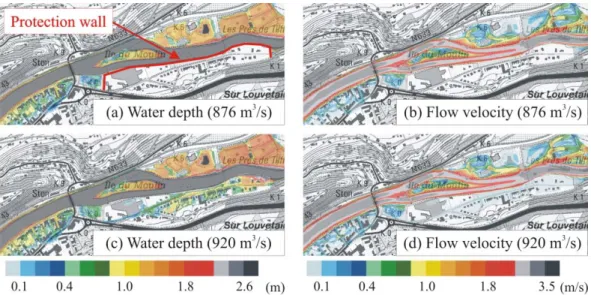
Aerial pictures of floods, taken from helicopter, are available along the main rivers for most recent flood events which occurred in the Walloon region. Provided a proper photogrammetric processing technique is applied to correct the orientation of aerial images, this remote sensing technique turns out to be particularly suitable for validating detailed inundation modelling, as shown in Figure 2.
Figure 2: Oriented and resampled aerial image taken from helicopter during the flood, showing a satisfactory agreement with contours of simulated inundation extent (in white).