ABOUT THE DOUBLE IONIZATION OF AMMONIA AND CARBON
DIOXIDE. A COMPARISON BETWEEN PHOTOIONIZATION AND
ELECTRON IMPACT
R. LOCHT, M. DAVISTER
Département de Chimie Générale et de Chimie Physique, Institut de Chimie, Université de Liège, Bâtiment B6, Sart-Tilman par B-4000 Liège 1, Belgium
W. DENZER, H.W. JOCHIMS and H. BAUMGÄRTEL
Institut fiir Physikalische und Theoretische Chemie, Freie Universität Berlin, Abstract
The double ionization of NH3 and CO2 is investigated by photoionization in the 30-60 eV photon
energy range and electron impact from 30 to 100 eV. The lowest onset for NH3 2+
formation, measured for the first time by photoionization, is at 34.5 ±0.2 eV. By electron impact this threshold is at 34.8 ± 0.2 eV. For CO2
2+
this onset is measured at 37.5 ± 0.1 eV by photoionization and 38.0 ± 0.1 eV by electron impact. Close to these onsets two double-ionization energies are observed: 38.5 ± 0.1 eV by photoionization and 39.5 ± 0.2 eV by electron impact. These have probably to be ascribed to two different CO2
2+
states. Higher-lying doubly ionized states of CO2 are detected in the 60-100 eV electron impact energy range.
1. Introduction
Compared to the literature devoted to the ionization and dissociation of molecular cations, the abundance of work dedicated to the double ionization of atoms and molecules is very scarce. This statement has to be ascribed to the generally low cross section for double ionization. Until recently, only electron impact, energy ion impact and Auger electron spectroscopy allowed us to study these species. The improvement of high-energy light sources, e.g. He(II) resonance lamps and even more the increasing number of electron synchrotron radiation facilities, made it possible to reach photon energies far above the 21.22 eV energy limit. These developments were the starting point of an increasing number of publications in the field of double and even multiple ionization.
The double ionization of NH3 has been investigated by electron impact, from the onset up to 100 eV [1].
The dissociations of NH3 2+
into (i) doubly ionized species [1] and (ii) pairs of singly ionized ions were examined by the same method [2-4]. The translational energy distributions of the fragments were measured in the same energy range.
In a recent photoionization work, Samson et al. [5] published the double-ionization cross section of NH3
in the 8-34 nm wavelength region using synchrotron radiation. They were unable to determine the double-ionization energy of NH3.
The double-ionization energy of CO2 has essentially been investigated by electron impact [6] and Auger
electron spectroscopy [7]. The photoionization cross section for CO2 2+
has been measured by Samson et al. [8] and the lowest double-ionization energy of CO2 has been determined. More recently the doubly ionized states of
carbon dioxide have been studied by charge stripping reaction (CSR) [9] and double-charge transfer spectroscopy (DCTS) [10].
The aim of this investigation is to examine the double-ionization efficiency of NH3 by photoionization
from the onset up to 20 nm (60 eV) and to determine a photoionization onset energy. A direct comparison would be possible with our previous electron impact results [1].
In the frame of a detailed dissociative electronization study of CO2, still in progress [11], the double
ionization of CO2 has been investigated by electron impact in the 30-100 eV energy range. For this molecule, the
electroionization. The photoionization efficiencies of the CO22+, CO+, O+ and C+ are investigated in the same
photon energy range. 2. Experimental
The electroionization experimental setup used in the present work has been described in detail elsewhere [12,13]. The experimental conditions used for the study of NH3 were extensively set out in a previous
publication [1]. The first derivative of the double-ionization efficiency curve is measured and can therefore be directly compared to the photoionization efficiency curves. The critical energies, i.e. the double-ionization energies, are determined by the linear extrapolation method [12].
The CO2 gas sample, purchased from Messer Griesheim and of 99.98% purity, is used without further
purification. For CO2 +
, the electron energy scale is calibrated by using the appearance energy of O+/ CO2
measured at 19.39 ± 0.07 eV [11]. As for NH3 2+
the first differentiated ionization efficiency curve of CO2 2+
has been scanned 300-400 times. This operation has been repeated twelve times. The onset energies reported here are averaged values from these twelve independent measurements. The mentioned error limits are one standard deviation.
In the mass spectrometric photoionization work, the experimental setup used in the abovementioned electron impact experiment has been duplicated. Only the interaction chamber has been modified for photoionization and for fitting different monochromators. The synchrotron radiation of the Berlin electron synchrotron storage ring BESSY has been used as a light source. A TGM monochromator, equipped with a 950 lines/mm grating, dispersed the light over the 20-50 nm wavelength region. An aluminum foil is used to filter higher order contributions between 17-34 nm and the Al-K edge at 16.908 nm is used to calibrate the wavelength scale. The resolution is 0.1 nm (i.e. about 0.4 eV at 17 nm and 0.1 eV at 34 nm) over the covered wavelength region. The photoion current is normalized to the photon intensity measured by a venetian-blind photomultiplier with a sodium salicylate covered window.
3. Results and discussion
The photoionization efficiency for NH3 2+
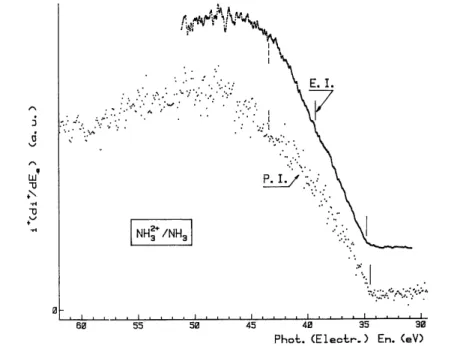
production in the photon energy range of 30-60 eV is displayed in fig. 1. Notwithstanding the low intensity of the ion signal at m/e=8..5, the fairly steep rise at threshold allowed us to measure an onset fairly easily.
The earlier published ionization efficiency of NH3 2+
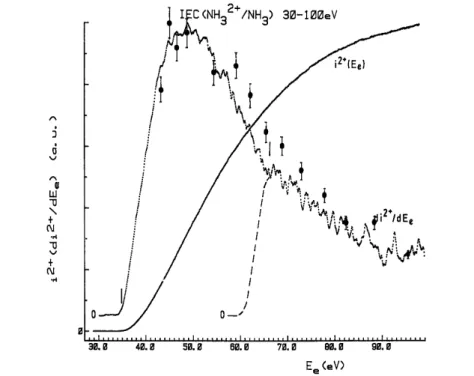
by electron impact [1] has been inserted in fig. 1 for comparison. Very good agreement is found between both curves. On the other hand, at the present time, this comparison can be extended up to 100 eV photons. Recently Samson et al. [5] have measured the absolute photoionization cross section for NH32+ formation in the 36-150 eV energy range. When normalizing the
electroionization efficiency curve and the photoionization cross section at 47 eV, fig. 2 is obtained. Error bars take into account the 5% error mentioned by the authors [5]. If the general shape is well accounted for by the first derivative of the electroionization efficiency curve, the photoionization cross section is systematically higher by about 10-15%.
The lowest double-ionization energy of NH3, as measured by photoionization and using the linear
extrapolation method [12], is found to be 34.5 ± 0.2 eV. Applying the same method to the first differentiated ionization efficiency from electron impact, the first double-ionization energy of NH3 was measured at 34.8 ± 0.2
eV [1]. Higher ionization energies have been reported earlier [1,14] but owing to the low signal-to-noise ratio, no onsets could be measured above 40 eV photon energy.
Being the first direct measurement of the photoionization threshold of NH3 2+
formation, the present result could only be compared to photoion-photoion coincidence work [14] where a dissociative NH3
2+
state is detected up from 35.4 ± 0.5 eV. By double charge transfer spectroscopy the first double-ionization energy is located at 35.3 ± 0.7 eV [15]. The assignment of this double ionization energy as well as the dissociative ionization observed at this energy have been discussed in detail previously [1-4].
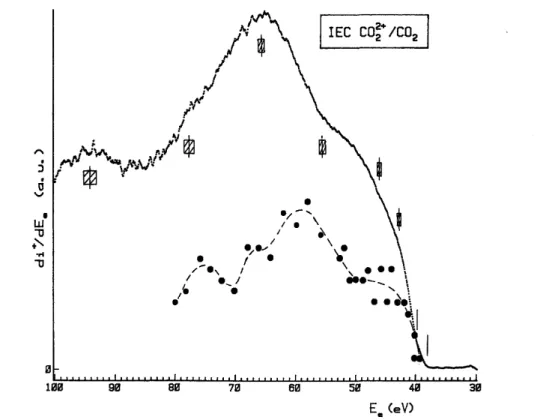
The photoion yield and the first derivative of the electron impact ionization efficiency curve of CO2 2+
in the 30-60 eV energy range are shown in fig. 3. Both curves are comparable between 30 and 50 eV. Above 50 eV and up to 60 eV, obviously the photoion yield curve reaches a maximum, whereas the electroionization efficiency steadily increases as shown in fig. 4. This figure displays the ionization efficiency measured between 30 and 100 eV.
Hitchcock et al. [16] derived the oscillator strength for CO22+ formation from electron energy loss and
electron-ion coincidence measurements. Their data are included in fig. 4 and have not been normalized to the present data for sake of clarity. Above 53 eV an increase of the oscillator strength has to be noticed and several maxima seem to be present in the 60-80 eV energy range. Samson et al. [8] measured the ratio of CO22+/CO2+ as
a function of the incident photon energy. This ratio is constant from 60 to 100 eV.
Fig. 1. First differentiated electron impact (EI) and photoionization (PI) efficiency curves of NH3 2+
in the 30-60 eV energy range. Vertical bars indicate threshold energies; dashed lines indicate the PIPICO onset at 44.5 eV [14].
A number of double-ionization energies of CO2 have been determined (see vertical bars in figs. 3 and 4)
and are listed in table 1. These energies, averaged over twelve independent measurements, are compared to previous determinations.
The lowest double-ionization energy of CO2 is measured at 38.0 ± 0.1 eV by electron impact, whereas it
is at 37.5 ± 0.1 eV by photoionization. In both cases the same method is used to determine the threshold energy (linear extrapolation). Notwithstanding the slight discrepancy, both values markedly disagree with the earlier electron impact onset of 36.4 ± 0.3 eV [6] and the direct photoionization threshold of 36.2 eV [8]. Better agreement is found with the photoionization value of 37.7 ± 0.3 eV [17] and the Auger electron spectroscopic values of 37.8 and 37.4 eV obtained from the carbon and oxygen K, LL Auger spectra respectively [ 7 ].
Several quantum mechanical calculations were reported to interpret photoionization and Auger electron spectroscopic data on CO2 [17-19]. Keeping in mind the electronic structure of CO2 [18], i.e.
all agree to assign the two hole configuration πg-2 to the lowest CO22+ state. This configuration gives rise to 3Σ-, 1
Σ + and l∆ states [20]. The lowest energy state would correspond to the 3 Σ g
state of CO2 2+
[17].
At 1.6 ±0.3 eV (by electron impact) or 1.0 ± 0.2 eV (by photoionization) above the lowest double-ionization energy of C02, i.e. at 39.6 ± 0.2 eV and 38.5 ± 0.1 eV respectively, a second onset is detected.
Noteworthy is the unusually large discrepancy between the two onsets.
From theoretical calculations an energy separation of 1.4 eV [19] and 1.2 eV [17] is found between the 3 Σ g
and the 1∆g states. The 1
Σ g +
state is calculated at 1.8 eV above the CO2 2+
impact result better fits the 1.8 eV energy interval whereas the 1.2 eV corresponds to the energy separation obtained by photoionization. Though in the averaged electron impact curve a "break" is observed at 38 eV, this feature being not easily detected in the individual curves (e.g. obscured by the noise level) is not mentioned in table 1. Likely, owing to lack of resolution and/or a too low signal-to-noise ratio, the 1∆g and the 1Σ g+ are not
detected by electron impact or photoionization. Consequently it is verylikely that both thresholds are not correlated. The electron impact onset at 39.6 ± 0.2 eV has to be ascribed to the 1Σ g
+
whereas the 1∆g state should
be assigned to the photoionization threshold at 38.0 ± 0.1 eV.
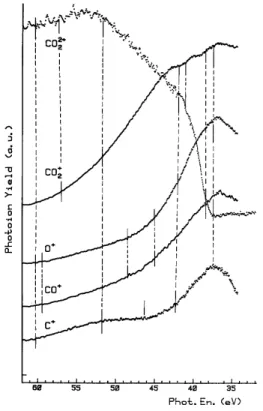
The photoionization efficiency curves of CO2+, CO+, O+ and C+ have been recorded in the 30-60 eV
photon energy range and are displayed in fig. 5. Noteworthy is the observation of a maximum near about 37 eV in all four ion yield curves. A dashed line is drawn at 37.5 and 38.5 eV to tentatively show a correlation between the two first double-ionization energies of CO2 and structures in the decrease of the CO2
+
photoion yield. For the fragment ions this decrease is smoother.
Fig. 2. First differentiated electron impact ionization efficiency curve of NH32+ measured between 28 and 100 eV
[1] compared to the absolute cross section measurements of Samson et al. [5] ( ● ). The error is indicated by vertical bars.
Between 40 and 50 eV electron energy two onsets are measured. The average energies are shown in fig. 3 by vertical bars at 42.9 ± 0.5 and 45.9 ± 0.6 eV. By photoionization, besides the onset at 42.3 ± 0.5 eV a step-like feature has to be mentioned at 41.1 ± 0.1 eV (dashed line in fig. 3).
To help deciding whether this latter feature has to be ascribed to noise or not, the photoion yield curve of fig. 3 has been Fourier transformed and filtered using different functions and a wide range of band-passes [21]. These tests show that the step-like feature's aspect is largely independent of the band-pass used. To account for this structure a non-resonant autoionization process such as
has to be invoked. In the CO2 +
photoion yield, singularities are observed in the same energy range as shown in fig. 5.
Fig. 3. First differentiated electron impact (EI) and photoionization (PI) efficiency curves of CO22+ in the 32-62
eV energy range. Vertical bars indicate threshold energies.
Fig. 4. First differentiated electron impact ionization efficiency curve of CO2 2+
measured between 30 and 100 eV. Vertical bars locate critical energies, shaded areas indicate error limits. Comparison with oscillator
Fig. 5. Photoionization efficiency curves of CO22+, CO2+, CO+, O+ and C+ measured in the 30-60 eV photon
energy range. "Slope changes" are tentatively correlated (see text).
Table 1. Onset energies (eV) determined in the electron impact (EI) and photoionization (PI) efficiency curves of CO22+. Comparison is made with previous measurements
Electron impact Photoionization
this work ref. [6] ref. [10] ref. [16] this work ref. [8] ref. [7] ref. [17]
38.0 ± 0.1 36.4 ± 0.3 38.9 ± 0.2 ≈39 37.5.5± 0.1 36.2 37.8, 37.4 37.7 39.6 ± 0.2 - 40.6 ± 0.3 38.5± 0.1 42.9 ± 0.5 41.9 42.7 ± 0.3 (41.1± 0.1) - 43.8 ± 0.3 42.3 ± 0.5 45.9 ± 0.6 45.2± 0.3 - 47.4 ± 0.3 - 51.5 ± 1.0 55.2± 0.5 54.0 ± 1.0 65.7 ± 0.6 a) ≈60, ≈67a) ≈77a> ≈76a) 94.5 ± 1.5 a) a)
Defined by the maximum.
Above 42 eV a double-ionization energy is determined at 42.9 ± 0.5 eV (by electron impact) or 42.3 ± 0.5 eV (by photoionization), in good agreement with DCT spectroscopy [10] (see table 1 ) and Auger electron spectroscopy [7].
Mainly two configurations account for this energy [17,18]: (1πu-1, 1πg-1) and (3σu-1, 1πg-1)/(4σg-1, 1πg-1)
and give rise to singlet or triplet Σ +, Σ - and ∆ and to singlet and triplet Π states respectively [20]. By theoretical calculations [17,18], the CO2
2+
electronic state at 4.9 eV above the ground state is described as a 1Π.
Whereas above 42 eV the CO2 2+
ionization efficiency shows at least one threshold at 45.9 ± 0.6 eV. The onset marked by a dashed line in fig. 3 at about 49 eV only shows up in the averaged ionization efficiency curve.
By Auger electron spectroscopy [7] a double-ionization energy is observed at 46.2 ± 0.3 and at 45.2 ± 0.3 eV by DCT spectroscopy [10]. In the 7.8-8.6 eV energy range above the CO22+ ground state, theoretical
calculations agree to predict the existence of three singlet states [18] and one triplet state [17] arising from (1πu-1,
1πg -1 ), 3σu -2 and 1πu -2 configurations. Both 1∆g [18] or 1
Σ + [17] symmetries have been assigned to this CO2 2+
state.
A shown in fig. 5, in the 42-52 eV photon energy range (marked by dashed lines) where the CO2 2+
ion yield increases linearly, the intensity of CO2+ decreases almost linearly. Up from 52 eV the CO22+ ion yield
reaches a maximum at about 54 eV and slowly decreases between 56 and 62 eV. In the same energy ranges, if the CO2
+
ion intensity continuously decreases, slope changes have to be noticed at about 52 and 60 eV.
Simultaneously (see fig. 5) for the fragment ions O+, CO+ and C+ the intensity decrease occurs less regularly. For the latter species the ion yield is even constant in the 46-52 eV photon energy range. On the other hand, at about 45, 48.5 and 59 eV "breaks" are observed in CO+ and O+ ionization efficiency curves. Very likely this would be indicative of CO+ + O+ pair production at the expense of doubly ionized CO2 states. An analogous
correlation could be made for the C+ + O+ pair at 42 and 60 eV.
In the 50-100 eV energy range, the electron impact ionization efficiency curve shows an onset at 55.2 ± 0.5 eV and maxima at 65.7 ± 0.7 eV and 94.5 ± 1.5 eV and a shoulder at about 77 eV. As shown in fig. 4, by the comparison with the data published by Hitchcock et al. [16], the broad maximum at 65.7 eV probably includes several processes. This is very likely the case at 94.5 eV too. Auger transitions were observed up to 55 eV above the CO2
2+
ground state and theoretical calculations have been performed up to the same energy [18].
At about 17.2 ± 0.7 eV above the CO22+ ground state fairly well isolated states are predicted [18],
corresponding to 1 Σ u(4σg -1 , 3σu -1 ) and 1 Σ g(4σg -2
) and lying at 16.3 and 18.1 eV above the lowest doubly ionized state. Either or both states can account for the onset observed at 55.2 ± 0.5 eV.
To the broad maximum at 65.7 eV, i.e. about 28 eV above the CO2 2+
ground state, could correspond the Auger transitions observed at 60.2, 61.1 and 64.8 eV [7]. The shoulder at 77 eV, corresponding to the maximum at 76 eV by Hitchcock et al. [16], could be correlated with the Auger transition observed in the oxygen K, LL spectrum at 76.8 eV. This transition is assigned to a 1Σg( 3σg
-1
, 4σg -l
) state [17]. In the same Auger spectrum a transition is finally observed at 94.8 eV [7] which could be related to the peak observed at 94.5 eV in the present experiment. However, a contribution from the 89 eV transition [7] to this peak has also to be considered.
Acknowledgement
We acknowledge the Fonds de la Recherche Fondamentale Collective (FRFC) and the University of Liège for financial support and the Belgian Government for an ARC contract. This work is part of the collaboration program of the Département de Chimie, University of Liège, and the Institut fur Physikalische Chemie, Freie Universität, Berlin. This collaboration was made possible by financial support of the Fonds National de la Recherche Scientifique (FNRS ) and the Bundesministerium fur Forschung und Technologie. Both are gratefully acknowledged.
References
[1] R. Locht and J. Momigny, Chem. Phys. Letters 138 ( 1987 ) 391.
[2] R. Locht, Ch. Servais, M. Ligot, Fr. Derwa and J. Momigny, Chem. Phys. 123 (1988) 443. [3] R. Locht, Ch. Servais, M. Ligot, M. Davister and J. Momigny, Chem. Phys. 125 (1988) 425. [4] R. Locht and J. Momigny, Chem. Phys. 127 ( 1988) 435.
[5] J.A.R. Samson, G.N. Haddad and L.D. Kilcoyne, J. Phys. Chem. 87 (1987) 6416. [6 ] F.H. Dorman and J.D. Morrison, J. Chem. Phys. 35 (1961) 575.
[7] W.E. Moddeman, T.A. Carlson, M.O. Krauss, B.P. Pullen, W.E. Bull and G.K. Schweitzer, J. Chem. Phys. 55 (1971) 2317. [8] J.A.R. Samson, P.C. Kemeny and G.N. Haddad, Chem. Phys. Letters 51 (1977) 75.
[9] C.J. Porter, C.J. Proctor, T. Ast and J.H. Beynon, Croat. Chem. Acta 54 (1981) 407. [10] P.G. Fournier, J. Fournier and M. Mousselmal, to bepublished.
[11] M. Davister and R. Locht, to be published.
[12] R. Locht and J. Schopman, Intern. J. Mass Spectrom. Ion Phys. 15 (1974) 361.
[13] Ch. Servais, R. Locht and J. Momigny, Intern. J. Mass Spectrom. Ion Phys. 74 (1986) 179. [14] D. Winkoun and G. Dujardin, Z. Physik D 4 (1986) 57.
[15 ] J. Appel and J.A. Horsley, J. Chem. Phys. 60 (1974) 3445.
[16] A.P. Hitchcock, C.E. Brion and M.J. van der Wiel, Chem. Phys. 45 (1980) 461.
[17] P. Millie, I. Nenner, P. Archirel, P. Lablanquie, P. Fournier and J.H.D. Eland, J. Chem. Phys. 84 (1986) 1259. [18 ] H. Ågren, J. Chem. Phys. 75 (1981) 1267.
[19] J.A. Kelber, D.R. Jennison and R.R. Rye, J. Chem. Phys.75 (1981) 652.
[20] G. Herzberg, Molecular Spectra and Molecular Structure, Vol. 2. Infrared and Raman spectra of polyatomic molecules; Vol. 3. Electronic spectra and structure of polyatomic molecules (Van Nostrand, Princeton, 1967).