HAL Id: hal-00296536
https://hal.archives-ouvertes.fr/hal-00296536
Submitted on 6 May 2008
HAL is a multi-disciplinary open access
archive for the deposit and dissemination of
sci-entific research documents, whether they are
pub-lished or not. The documents may come from
teaching and research institutions in France or
abroad, or from public or private research centers.
L’archive ouverte pluridisciplinaire HAL, est
destinée au dépôt et à la diffusion de documents
scientifiques de niveau recherche, publiés ou non,
émanant des établissements d’enseignement et de
recherche français ou étrangers, des laboratoires
publics ou privés.
Discriminating raining from non-raining clouds at
mid-latitudes using meteosat second generation daytime
data
B. Thies, T. Nauss, J. Bendix
To cite this version:
B. Thies, T. Nauss, J. Bendix. Discriminating raining from non-raining clouds at mid-latitudes using
meteosat second generation daytime data. Atmospheric Chemistry and Physics, European Geosciences
Union, 2008, 8 (9), pp.2341-2349. �hal-00296536�
www.atmos-chem-phys.net/8/2341/2008/ © Author(s) 2008. This work is distributed under the Creative Commons Attribution 3.0 License.
Chemistry
and Physics
Discriminating raining from non-raining clouds at mid-latitudes
using meteosat second generation daytime data
B. Thies, T. Nauss, and J. Bendix
Laboratory of Climatology and Remote Sensing, University of Marburg, Germany
Received: 12 October 2007 – Published in Atmos. Chem. Phys. Discuss.: 13 November 2007 Revised: 25 March 2008 – Accepted: 21 April 2008 – Published: 6 May 2008
Abstract. A new method for the delineation of precipi-tation during daytime using multispectral satellite data is proposed. The approach is not only applicable to the de-tection of mainly convective precipitation by means of the commonly used relation between infrared cloud top temper-ature and rainfall probability but enables also the detection of stratiform precipitation (e.g. in connection with mid-latitude frontal systems). The presented scheme is based on the con-ceptual model that precipitating clouds are characterized by a combination of particles large enough to fall, an adequate vertical extension (both represented by the cloud water path;
cwp), and the existence of ice particles in the upper part of
the cloud. The technique considers the VIS0.6and the NIR1.6
channel to gain information about the cloud water path. Ad-ditionally, the brightness temperature differences 1T8.7−10.8
and 1T10.8−12.1are considered to supply information about
the cloud phase. Rain area delineation is realized by us-ing a minimum threshold of the rainfall confidence. To ob-tain a statistical transfer function between the rainfall confi-dence and the four parameters VIS0.6, NIR1.6, 1T8.7−10.8and
1T10.8−12.1, the value combinations of these four variables
are compared to ground based radar data. The retrieval is validated against independent radar data not used for deriving the transfer function and shows an encouraging performance as well as clear improvements compared to existing optical retrieval techniques using only IR thresholds for cloud top temperature.
1 Introduction
The detection of rainfall by means of optical sensors aboard geostationary (GEO) weather satellites has a long tradition as they provide information about the spatio-temporal
distribu-Correspondence to: B. Thies
tion of this key parameter of the global water cycle in a high spatial and temporal resolution (e.g. Adler and Negri, 1988). Most retrieval techniques developed so far for GEO sys-tems are based on the relationship between cloud top temper-ature in the infrared channel and rainfall probability. Such re-trievals which are often referred to as IR rere-trievals are appro-priate for the tropics where precipitation is generally linked with deep convective clouds that can be easily identified in the infrared and/or water vapour channels (e.g. Levizzani et al., 2001; Levizzani, 2003) but show considerable drawbacks in the mid-latitudes (e.g. Ebert et al., 2007; Fr¨uh et al., 2007) where great parts of the precipitation originates from clouds formed by widespread frontal lifting processes in connec-tion with extra-tropical cyclones (hereafter denoted as advec-tive/stratiform precipitation).
These clouds are characterized by relatively warm top temperatures and a more homogeneous spatial distribution of cloud top temperature that differ not significantly be-tween raining and non-raining regions. Therefore, a thresh-old value for cloud top temperature in the IR channel as used for deep convective clouds seems to be improper for a re-liable rain area delineation and leads to an underestimation of the detected precipitation area in such cases. To over-come this drawback, Nauss and Kokhanovsky (2006, 2007) recently proposed a new scheme for the delineation of rain-ing and non-rainrain-ing cloud areas applicable to mid-latitudes using daytime multispectral satellite data from the LEO sys-tem Terra-MODIS (Moderate Resolution Imaging Spectrora-diometer, see Barnes et al., 1998). It is based on the assump-tion that precipitating clouds must have a combinaassump-tion of large enough droplets that can fall easily against updraft wind fields and a large enough vertical extension which favours the growth of precipitation droplets and prevents them from evaporation below the cloud bottom (see also Lensky and Rosenfeld, 2003). Since neither the droplet spectrum nor the geometrical thickness of a cloud can be computed without additional theoretical assumptions, the effective droplet ra-dius (aef) (Hansen and Travis, 1974) and the cloud optical
2342 B. Thies et al.: Discriminating raining from non-raining clouds at mid-latitudes thickness (τ ) can be used as a measure for the particle size
and the cloud thickness. Consequently, precipitating cloud areas can be characterised by a combination of the effective droplet radius and the optical thickness large enough to form precipitation (Nauss, 2006). Multiplying both parameters ac-cording to
lwp = 2
3 ·aef ·τ (1)
one gets the liquid water path (lwp) which in turn is directly related to the rainfall probability of a cloud. As a result, pre-cipitating cloud areas are characterised by a sufficiently large
lwp which can be used as a delineator between raining and
non-raining clouds (Nauss and Kokhanovsky, 2006, 2007). The new proposed scheme shows an improvement in rain area delineation compared to existing techniques using only a threshold for cloud top infrared temperature especially for advective/stratiform precipitation clouds.
The lwp required for rain area delineation can be re-trieved on a pixel basis during daytime using a combination of two solar channels (e.g. Nakajima and Nakajima, 1995; Kawamoto et al., 2001; Kokhanovsky et al., 2003, 2005; Platnick et al., 2003; Nauss et al., 2005). This is due to the fact that the reflection of solar light by a cloud in a non-absorbing wavelength (i.e. a visible channel between 0.4 and 0.8 µm) is strongly correlated to the optical thickness while the reflection of solar light in a slightly absorbing wave-length (i.e. a near-infrared channel between 1.6 and 3.9 µm) is mainly a function of the cloud effective droplet radius.
To proof the conceptual model presented above within an initial test study, Nauss and Kokhanovsky (2006, 2007) utilize the Semi-Analytical Cloud Retrieval Algorithm (SACURA, Kokhanovsky et al., 2003, 2005; Nauss et al., 2005) to compute aef, τ , and finally lwp using Terra-MODIS data. SACURA is based on asymptotic solutions and expo-nential approximations of the radiative transfer theory valid for weakly absorbing media (Kokhanovsky and Rozanov, 2003, 2004), which are applicable for cloud retrievals up to a wavelength of around 2.2 µm. Compared to other look-up table techniques (e.g. Nakajima and Nakajima, 1995; Kawamoto et al., 2001; Platnick et al., 2003) SACURA al-lows an instantaneous computation of the cloud properties which is essential for an operational rain area delineation scheme for GEO systems operating in near real-time (Nauss et al., 2005; Nauss, 2006).
SACURA has been validated over sea and land sur-faces against the commonly used but computer-time ex-pensive look-up table approaches of the Japanese Space Agency JAXA (Nakajima and Nakajima, 1995; Kawamoto et al., 2001) and the NASA MODIS cloud property prod-uct MOD06 (Platnick et al., 2003) showing good agreement for optically thick (i.e. raining) cloud systems (Nauss et al., 2005). However, as SACURA is only valid for water clouds it does not consider the ice phase which leads to inaccu-racies concerning precipitating clouds in the mid-latitudes
as efficient precipitation processes are mainly connected to the ice phase and the so called Bergeron-Findeisen pro-cess (e.g. Houze, 1993). Recently, Kokhanovsky and Nauss (2005) and Kokhanovsky and Nauss (2006) showed that a fast and accurate calculation of the effective cloud particle ra-dius and the cloud optical thickness is possible for water and ice clouds by using a non-absorbing visible and an absorbing near infrared channel (e.g. 0.8 µm and 1.6 µm). Differentia-tion between water and ice clouds can be realized by consid-ering the brightness temperature difference between an 8 µm and an 11 µm channel together with the brightness temper-ature difference between an 11 µm and an 12 µm channel (Strabala et al., 1994).
The new European meteorological GEO system MSG (Meteosat Second Generation) with its payload SEVIRI (Spinning Enhanced Visible and InfraRed Imager) provide the enhanced spectral resolution (Aminou, 2002; Schmetz et al., 2002; Levizzani et al., 2001) to infer information about the liquid water path and the ice water path (hereafter both re-ferred to as cloud water path; cwp) as well as about the cloud phase. Furthermore it offers a high temporal (15 min) and spatial (3×3 km at sub-satellite point) resolution necessary for a continuous area-wide monitoring of the rainfall distri-bution which is essential for nowcasting purposes.
Therefore, the objective of the present paper is to propose a new operational technique for rain area delineation in the mid-latitudes on a 15 min basis for MSG SEVIRI daytime data. It is based on the new conceptual model that precipitat-ing clouds are characterised by a sufficiently large cwp and the existence of ice particles in the upper cloud parts.
The plan of the paper is as follows. The new developed Rain Area Delineation Scheme during Daytime (RADS-D) is introduced in Sect. 2 followed by an appraisal of the new technique in Sect. 3. The paper is closed with a short sum-mary and some conclusions.
2 A new technique for rain area delineation using MSG SEVIRI daytime data
As stated in the introduction SACURA is only applicable to water clouds. Concerning rain area delineation in the mid-latitudes this represents a shortcoming as effective pre-cipitation processes in these regions are mainly connected to the ice phase and the so called Bergeron-Findeisen pro-cess. As a consequence, Kokhanovsky and Nauss (2006) have already presented the fast and accurate forward radia-tive transfer scheme CLOUD which enables the computation of the cloud properties for water and ice clouds using one non-absorbing and one absorbing band available on MSG SEVIRI. However, a fast inverse radiative transfer scheme is required for the operational retrieval of cloud properties which is currently under final evaluation. Because no op-erational retrieval technique is currently available for MSG SEVIRI that is applicable to water and ice clouds and that
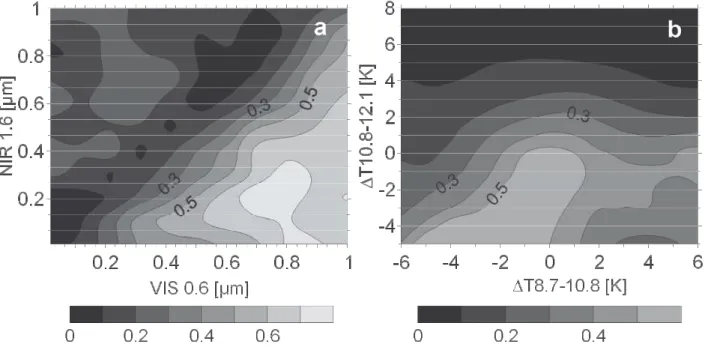
Fig. 1. The rainfall confidence as a function of VIS0.6and NIR1.6(a), as well as a function of 1T8.7−10.8and 1T10.8−12.1(b) calculated with Eq. (2).
is fast enough concerning the 15 min scan cycle, the authors decided to use the original reflectance of the 0.56–0.71 µm (VIS0.6) and 1.5–1.78 µm (NIR1.6) SEVIRI channels for this
study, instead of computed values of aefand τ . As soon as
an adequate retrieval technique is available the proposed al-gorithm can be readily applied to the retrieved cloud prop-erties. Information about the cloud phase are incorporated by means of the brightness temperature difference between the 8.7 µm channel (8.3–9.1 µm) and the 10.8 µm channel (9.8–10.8 µm) (1T8.7−10.8) together with the brightness
tem-perature difference between the 10.8 µm channel and the 12.1 µm channel (11–13 µm) (1T10.8−12.1) (refer to Strabala
et al., 1994; Ackerman et al., 1998). The differentiation is based on the observation that the increase of water particle absorption is greater between 11 and 12 µm than between 8 and 11 µm. The ice particle absorption increases more be-tween 8 and 11 µm than bebe-tween 11 and 12 µm (Strabala et al., 1994). Therefore, 1T10.8−12.1of water clouds are greater
than 1T8.7−10.8. On the other hand, 1T8.7−10.8of ice clouds
are greater than coincident 1T10.8−12.1.
To use the information about the cwp and the cloud phase for a proper detection of potentially precipitating cloud ar-eas (i.e. a large enough cwp and ice particles in the up-per part) the rainfall confidence is calculated as a func-tion of the value combinafunc-tions of the four variables VIS0.6,
NIR1.6, 1T8.7−10.8, and 1T10.8−12.1(e.g. Bellon et al., 1980;
Cheng et al., 1993; Kurino, 1997; Nauss and Kokhanovsky, 2007). The computation of the pixel based rainfall confi-dence is done by a comparison of these value combinations with ground based radar data from the German Weather
Ser-vice for daytime precipitation events from January to August 2004 (altogether 850 scenes). The ground based radar data from the DWD C band radar network consist of six classes representing different reflectivity intensities which are all to-gether considered as raining in the comparison with collo-cated satellite pixels. A lower reflectivity threshold of 7.0 decibel for the first class is utilized to detect rain bearing pix-els (DWD). Figure 1 shows the calculated rainfall confidence as a function of VIS0.6 and NIR1.6 (a), as well as a function
of 1T8.7−10.8 and 1T10.8−12.1 (b). Equation (2) shows the
calculation of the rainfall confidences as a function of two different variables.
RainConf (x1, x2)=
NRain(x1, x2)
NRain(x1, x2) + NNoRain(x1, x2)
(2) where NRain and NNoRain are the raining and the
non-raining frequencies, respectively, and x1 and x2 denote
the reflectance or brightness temperature difference (VIS0.6,
NIR1.6, 1T8.7−10.8, 1T10.8−12.1) combined for the
calcula-tion of the rainfall confidence.
As can be seen in Fig. 1a high values of the rainfall con-fidence coincide with high values of VIS0.6 and low values
of NIR1.6, indicating a large cwp. High values of VIS0.6
in-dicate a high optical thickness and low values of NIR1.6
in-dicate large cloud particles as the absorption increases with increasing particle size. Fig. 1b shows that ice clouds, where
1T8.7−10.8 are greater than coincident 1T10.8−12.1, possess
high rainfall confidences. On the other hand, for water clouds 1T10.8−12.1 are greater than 1T8.7−10.8. These areas
are characterised by lower rainfall confidences. However, high 1T10.8−12.1 values may also be connected with non
2344 B. Thies et al.: Discriminating raining from non-raining clouds at mid-latitudes
Fig. 2. ROC plot based on the comparison between the combined
values of the reflectances and brightness temperature differences mentioned in the text from 850 MSG SEVIRI scenes and corre-sponding ground based radar measurements over Germany. Differ-ent rainfall confidence threshold values between 0.1 and 0.7 (step 0.05) indicated by the crosses were used to delineate the satellite-based rain area.
precipitating Ci clouds. For example, Inoue (1987) classified clouds with 1T10.8−12.1≥2.5 K as Ci clouds. Such values of
1T10.8−12.1are characterised by low rainfall confidences in
Fig. 1b. Following the results of Strabala et al. (1994) the cor-responding 1T8.7−10.8values should be as high as or greater
than the 1T10.8−12.1 values. To make use of the combined
information content provided by the four parameters VIS0.6,
NIR1.6, 1T8.7−10.8and 1T10.8−12.1 for rain delineation, the
rainfall confidence is computed as a function of the combined values of these four variables as shown in Eq. (3) using the above mentioned 850 scenes:
RainConf (x1, x2, x3, x4)=
NRain(x1, x2, x3, x4)
NRain(x1, x2, x3, x4) + NNoRain(x1, x2, x3, x4)
(3) where NRain and NNoRain are the raining and the
non-raining frequencies, respectively, and x1, x2, x3, x4denote
the reflectance or brightness temperature difference (VIS0.6,
NIR1.6, 1T8.7−10.8, 1T10.8−12.1) combined for the
calcula-tion of the rainfall confidence.
The threshold of the calculated rainfall confidence appro-priate for rain area delineation is determined by optimising the Equitable Threat Score (ETS) which is based on the num-ber of pixels that have been identified in the satellite (S) and
radar (R) techniques as raining (SY, RY) or non-raining (SN, RN). It indicates how well the classified rain pixels corre-spond to the rain pixels observed by the radar, also account-ing for pixels correctly classified by chance (SYRYRandom).
Its value can range from −1/3 to 1 with the optimum value 1. The ETS is calculated according to
ETS = SYRY −SYRYRandom SYRY +SNRY +SYRN−SYRYRandom (4) with SYRYRandom= (SYRY +SNRY) × (SYRY +SYRN) TSR (5) where TSR denotes the total number of pixels. Addition-ally to the ETS, a visual inspection of the Relative Oper-ation Characteristic (ROC) plot (Mason, 1982; Jolliffe and Stephenson, 2003) was also considered to identify an appro-priate rainfall confidence threshold (see Fig. 2). The Proba-bility Of Detection (POD) describes the ratio between pixels with SYRY and RY, and gives the fraction of pixels that have been correctly identified by the satellite technique, accord-ing to the radar product. The Probability Of False Detection (POFD) describes the ratio between SYRNand RNand indi-cates the fraction of the pixels incorrectly identified as rain-fall events by the satellite algorithm. The optimum value for the POD is 1, while it is 0 for the POFD. The dotted diagonal line in the ROC plot represents the “no skill” line (i.e. POD equals POFD). Value combinations above this line indicate that the approach has skill (i.e. POD larger than POFD).
Different rainfall confidence threshold values between 0.1 and 0.7 were used to delineate the satellite-based rain area. The ETS, the POD and the POFD for the delineated rain areas based on the different rainfall confidence levels were calculated in comparison with ground based radar data. As shown in Fig. 2, the rainfall confidence threshold value around 0.3 seems to be most suitable for rain area delin-eation since corresponding POD-POFD combinations show the largest distance normal to the “no skill” line. The delin-eated rain area using a rainfall confidence threshold of 0.34 yields the optimised ETS of 0.24. Therefore, the rainfall con-fidence of 0.34 is chosen as the minimum threshold for pre-cipitating clouds during daytime.
3 Appraisal of the new scheme
For the evaluation study, scenes from daytime precipitation events between January and August 2004 were classified by using the new developed Rain Area Delineation Scheme dur-ing Daytime (RADS-D). The precipitation events chosen for the evaluation study are independent from the above men-tioned precipitation events used for algorithm development. Altogether 720 daytime scenes were chosen.
To evaluate the potential improvement by the new scheme the validation scenes were also classified by the En-hanced Convective Stratiform Technique (ECST) (Reuden-bach, 2003; Reudenbach et al., 2001) which is similar to
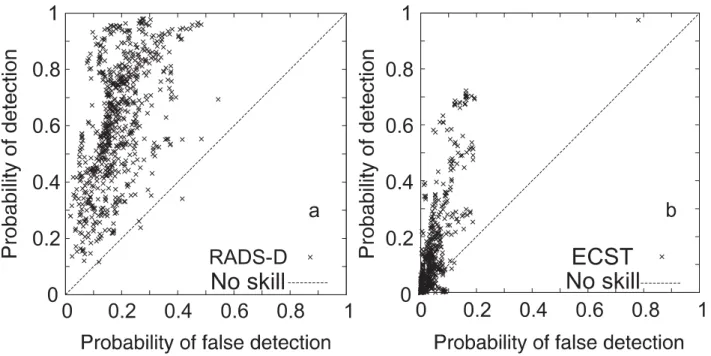
Fig. 3. ROC plots for the comparison between RADS-D and ground based radar (a), and ECST and ground based radar (b). The calculated
probability of detection (POD) and probability of false detection (POFD) are based on the 720 scenes mentioned in the text.
the Convective Stratiform Technique (CST) (Adler and Ne-gri, 1988) but additionally includes the water vapour channel temperature for a more reliable deep convective/cirrus clouds discrimination (Tjemkes et al., 1997). The ECST which was first transferred from Meteosat-7 MVIRI (Meteosat Visible and InfraRed Imager radiometer) to MSG SEVIRI (Thies et al., 2007a1) is used for the identification of convective rain areas since these regions approximately represent the perfor-mance of many present optical rainfall retrievals.
Standard verification scores following the suggestions of the International Precipitation Working Group (IPWG, Turk and Bauer, 2006) were calculated on a pixel basis for each scene in comparison with corresponding ground based radar data from the German Weather Service. The bias describes the ratio between SY and RY and the False Alarm Ratio (FAR) gives the ratio between SYRN and SY. The Criti-cal Success Index (CSI), which encloses all pixels that have been identified as raining by either the radar network or the satellite technique, describes the ratio between SYRY and the sum of SYRY, SNRY, SYRN. All scores range from 0 to 1. The optimum value for the CSI is 1, while it is 0 for the FAR. Since the POD can be increased by just increasing the satellite rainfall area (i.e. by reducing the rainfall con-fidence threshold), it has to be analysed in connection with corresponding values of the FAR and the POFD since both measure the fraction of the satellite pixels that have been
in-1Thies, B., Nauss, T., and Bendix J.: Detection of high rain clouds usingwater vapour emission - transition from Meteosat First (MVIRI) to Second Generation (SEVIRI), Adv. Space Res., under review, 2007.
correctly identified as raining. The verification scores were calculated on a pixel basis for each single scene without any spatio-temporal aggregation. For a detailed discussion of the verification scores see Stanski et al. (1989) or the web site of the WWRP/WGNE.
The verification scores calculated for the 720 daytime val-idation scenes are summarized in Table 1. RADS-D slightly overestimates the rain area detected by the radar network which is indicated by the bias of 1.15. In contrast to this, the rain area is strongly underestimated by the ECST (bias of 0.22). 61% of the radar observed raining pixels are also identified by RADS-D. This indicates a much better perfor-mance compared to the POD of 9% for the ECST, even if this coincide with a higher POFD of 0.18 for RADS-D in com-parison to 0.04 for the ECST. Anyhow, the FAR indicates that a lower fraction of the pixels are wrongly classified as rain by RADS-D (0.46) than by the ECST (0.51). Altogether, the good performance of the new RADS-D is further supported by the CSI (0.39) and the ETS (0.25). Compared to ECST (CSI: 0.1; ETS: 0.06) this signifies a distinct improvement concerning the delineated rain area.
An overview of the performance of RADS-D in compari-son to the ECST is given by the Relative Operation Charac-teristic (ROC) plot in Fig. 3. The visual impression addition-ally supports the good and improved performance of the new developed scheme. The combination of medium to high val-ues for POD together with low to medium valval-ues for POFD which is valid for the main part of the classified scenes un-derlines the overall good skill of the new scheme. In contrast, for scenes classified by the ECST the POD and POFD indi-cate much lower or even no skills.
2346 B. Thies et al.: Discriminating raining from non-raining clouds at mid-latitudes
Table 1. Results of the standard verification scores applied to the rain-area identified by RADS-D and ECST on a pixel basis. The scores are
based on 720 precipitation scenes with 24 914 160 pixels of which 5 872 220 have been identified as raining by RADS-D. POD (Probability Of Detection); POFD (Probability Of False Detection), FAR (False Alarm Ratio); CSI (Critical Success Index); ETS (Equitable Threat Score).
RADS-D ECST
Test Mean StDev Min Max Mean StDev Min Max Bias 1.15 0.38 0.16 2.17 0.22 0.27 0 2.82 POD 0.61 0.21 0.12 0.98 0.12 0.17 0 0.97 POFD 0.18 0.09 0.02 0.54 0.04 0.05 0 0.78 FAR 0.46 0.12 0.03 0.84 0.51 0.27 0 1 CSI 0.39 0.14 0.1 0.77 0.1 0.14 0 0.64 ETS 0.25 0.11 −0.04 0.53 0.06 0.09 −0.05 0.39
Fig. 4. Delineated rain area for the scene from 12 January 2004
12:45 UTC. (a) BT10.8image; (b) rain area delineated by RADS-D as well as by ECST; (c) rain area detected by RADS-D in compari-son to the radar data.
To gain a visual impression of the performance of the new developed rain area delineation scheme, the classified rain area for a scene from 12 January 2004 12:45 UTC is depicted in Fig. 4. Figure 4a shows the brightness temperature in the 10.8 µm channel (BT10.8), Fig. 4b the rain area delineated
by RADS-D as well as by ECST, and Fig. 4c the rain area detected by RADS-D in comparison to the radar data.
4 Conclusions
A new algorithm for rain area delineation during daytime us-ing multispectral optical satellite data of MSG SEVIRI was proposed. The method allows not only a proper detection of mainly convective precipitation by means of the commonly used connection between infrared cloud top temperature and rainfall probability but also enables the detection of advec-tive/stratiform precipitation (e.g. in connection with mid-latitude frontal systems). It is based on the conceptual model that precipitation is favoured by a large cloud water path and the presence of ice particles in the upper part of the cloud. The technique considers the VIS0.6 and the NIR1.6 channel
to gain information about the cloud water path. Addition-ally, the channel differences 1T8.7−10.8and 1T10.8−12.1are
considered to gain information about the cloud phase. The information about the cloud water path and the cloud phase of the four variables is merged and incorporated into the new developed rain delineation algorithm. Rain area de-lineation is realized by using the pixel based rainfall confi-dence as a function of the respective value combination of the four variables. The calculation of the rainfall confidence is based on a comparison of the value combinations of the four variables with ground based radar data. A minimum threshold for the rainfall confidence of 0.34 was determined as appropriate for rain area delineation.
The results of the algorithm were compared with corre-sponding ground based radar. The proposed technique per-forms better than existing optical retrieval techniques using only IR thresholds for cloud top temperature. The new devel-oped algorithm shows encouraging performance concerning precipitation delineation during daytime in the mid-latitudes using MSG SEVIRI data.
In a next step the solar signal within the 3.9 µm channel will be additionally incorporated for an enhanced rain area delineation. Such an improvement can be expected because
of the differing penetration depth of the radiation in the spec-tral range of the 1.6 µm and the 3.9 µm channels (Chang and Li, 2002). While the radiation in the 3.9 µm channel origi-nates from the upper parts of the cloud and the cloud top, the radiation in the 1.6 µm channel penetrates about two times deeper into the cloud (Platnick, 2000). As Rosenfeld et al. (2004) pointed out the combined and simultaneous use of the 1.6 µm and the 3.9 µm channel would be the best choice. Such a combination is possible with MSG SEVIRI. In this context it has to be mentioned that the information about the effective radius retrieved from reflectance in the 1.6 µm and 3.9 µm channels is only representative for the upper parts of the cloud. Nevertheless it is assumed that cloud areas with large liquid droplets and ice particles and a large cloud water path within the upper parts could be seen as a precondition for the formation of droplets large enough to fall as raindrops in the middle and lower portions of the cloud.
Together with the existing rain area delineation scheme during nighttime (Thies et al., 2008) the new algorithm of-fers the great potential for a 24 h technique for rain area de-lineation with a high spatial and temporal resolution.
The nighttime technique is based on the same concep-tual model as the presented daytime scheme. However, since no operational retrieval exists for MSG to compute the cloud water path during nighttime, suitable combina-tions of brightness temperature differences (1T ) between the thermal bands of MSG SEVIRI (1T3.9−10.8, 1T3.9−7.3,
1T8.7−10.8, 1T10.8−12.1) are used to infer implicit
informa-tion about the cloud water path. 1T8.7−10.8and 1T10.8−12.1
are particularly considered to supply information about the cloud phase. Similar to the daytime approach rain area de-lineation is realized by means of the pixel based rainfall con-fidence as a function of the respective value combination of the four brightness temperature differences.
A potential application of a new rainfall retrieval technique based on multispectral satellite data of the next generation GEO systems is the improved rainfall detection in a high spatial and temporal resolution. This is of valuable bene-fit for nowcasting purposes in regions where ground based radar networks are not available as well as for approaches that attempt to merge passive microwave rainfall informa-tion with data from GEO systems in a higher temporal and spatial resolution. Up to now such hybrid techniques con-sider only IR cloud top temperature and suffer from the inherent drawbacks especially regarding precipitation pro-cesses in connection with extra-tropical cyclones. There-fore, rainfall retrievals based on multispectral satellite data of the new generation GEO systems play an important role for quasi-continuous precipitation monitoring. In this con-text the study demonstrated the high potential offered by the enhanced spectral resolution of new generation multispec-tral optical satellite systems as MSG SEVIRI. The good val-idation results that are obtained on a 15 minute basis with-out any spatial and temporal aggregation suggest that the achieved accuracies are sufficient for the proposed
applica-tions. This is especially true, as for similar comparison stud-ies the data are generally temporally aggregated over 3 h or 24 h, (e.g. validation web page of the international precipi-tation working group; IPWG; http://www.bom.gov.au/bmrc/ SatRainVal/validation-intercomparison.html). Based on the improved rain area delineation, the next step an enhanced as-signment of the associated rainfall rate can be tackled. Con-cerning this topic, comprehensive research efforts have just been started in order to develop a new method for the assign-ment of rainfall rates based on information about the cloud water path and the cloud phase since the commonly used re-lationship between rainfall rate and cloud top temperature in the IR channel seems to be insufficient especially for precipi-tating advective-stratiform cloud areas. For a comprehensive appraisal of the final retrieval scheme (rain area delineation with associated rainfall rate assignment) detailed validation studies are necessary. In this context a cooperation with the Italian National Research Council Institute of Atmospheric Sciences and Climate is intended with the objective of an ex-tensive evaluation of the final algorithm in comparison with other retrieval techniques (e.g. the CMORPH technique of Joyce et al., 2004).
Acknowledgements. The current study is funded by the German Ministry of Research and Education (BMBF) in the framework of the GLOWA-Danube project (G-D/2004/TP-10, precipita-tion/remote sensing) as well as by the German Research Council (DFG) (BE 1780/18-1) within the SORT project. The authors are grateful to the German Weather Service (DWD) for providing the radar datasets within the Eumetsat/DWD Advanced Multisensor Precipitation Experiment (AMPE).
Edited by: J. Quaas
References
Ackerman, S. A., Strabala, K. I., Menzel, W. P., Frey, R. A., Moeller, C. C., and Gumley, L. E.: Discriminating clear sky from clouds with MODIS, J. Geophys. Res.-Atmos., 103, 32 141– 32 157, 1998.
Adler, R. F. and Negri, A. J.: A satellite technique to estimate trop-ical convective and stratiform rainfall, J. Appl. Meteorol., 27, 30–51, 1988.
Aminou, D. M. A.: MSG’s SEVIRI instrument, ESA Bulletin, 111, 15–17, 2002.
Barnes, W. L., Pagano, T. S., and Salomonson, V. V.: Prelaunch characteristics of the Moderate Resolution Imaging Spectrora-diometer (MODIS) on EOS-AM1, IEEE T. Geosci. Remote, 36, 1088–1100, 1998.
Bellon, A., Lovejoy, S., and Austin, G. L.: Combining satellite and radar data for the short-range forecasting of precipitation, Monthly Weather Review, 108, 1554–1556, 1980.
Chang F.-L. and Li Z.: Estimating the vertical variation of cloud droplet effective radius using multispectral near-infrared satel-lite measurements, J. Geophys. Res.-Atmos., 107(D15), 4257, doi:10.1029/2001JD000766, 2002.
2348 B. Thies et al.: Discriminating raining from non-raining clouds at mid-latitudes
Cheng, M., Brown, R., and Collier, C. G.: Delineation of precip-itation areas by correlation of METEOSAT visible and infrared data in the region of the United Kingdom, J. Appl. Meteorol., 32, 884–898, 1993.
DWD: Weather radar network, Available online at http: //www.dwd.de/en/Technik/Datengewinnung/Radarverbund/ Radarbroschuere en.pdf, 2007.
Ebert, E. E., Janowiak, J. E., and Kidd, C.: Comparison of near-real-time precipitation estimates from satellite observations and numerical models, B. Am. Meteorol. Soc., 88, 47–64, 2007. Fr¨uh, B., Bendix, J., Nauss, T., Paulat, M., Pfeiffer, A.,
Schip-per, J. W., Thies, B., and Wernli, H.: Verification of precipi-tation from regional climate simulations and remote-sensing ob-servations with respect to ground-based obob-servations in the upper Danube catchment, Meteorol. Z., 16, 275–293, 2007.
Hansen, J. E. and Travis, L. D.: Light scattering in planetary atmo-spheres, Space Sci. Rev., 16, 527–610, 1974.
Houze, R. A.: Cloud Dynamics, Vol. 53 of the International Geo-physics Series, Academic Press, San Diego, 1993.
Inoue, T.: A cloud type classification with NOAA 7 split-window measurements, J. Geophys. Res.-Atmos., 92, 3991–4000, 1987. Jolliffe, I. T. and Stephenson, D. B.: Forecast Verification, A
Prac-tioner’s Guide in Atmospheric Science, Wiley and Sons Ltd., 2003.
Joyce, R. J., Janowiak, J. E., Arkin, P. A., and Xie, P.: CMORPH: A method that produces global precipitation estimates from pas-sive microwave and infrared data at high spatial and temporal resolution, J. Hydromet., 5, 487–503, 2004.
Kawamoto, K., Nakajima, T. and Nakajima, T. Y.: A global deter-mination of cloud microphysics with AVHRR remote sensing, J. Climate, 14, 2054–2068, 2001.
Kokhanovsky, A. A. and Rozanov, V. V.: The physical parameteri-zation of the top-of-atmosphere reflection function for a cloudy atmosphere -underlying surface system: the oxygen A-band case study, J. Quant. Spectrosc. Ra., 85, 35–55, 2004.
Kokhanovsky, A. A. and Rozanov, V. V.: The reflection function of optically thick weakly absorbing turbid layers: a simple approx-imation, J. Quant. Spectrosc. Ra., 77, 165–175, 2003.
Kokhanovsky, A. A. and Nauss, T.: Reflection and transmission of solar light by clouds: asymptotic theory, Atmos. Chem. Phys., 6, 5537–5545, 2006,
http://www.atmos-chem-phys.net/6/5537/2006/.
Kokhanovsky, A. A. and Nauss, T.: Satellite-based retrieval of ice cloud properties using a semi-analytical algorithm, J. Geophys. Res.-Atmos., 110(D19), D19206, doi:10.1029/2004JD005744, 2005.
Kokhanovsky, A. A., Rozanov, V. V., Nauss, T., Reudenbach, C., Daniel, J. S., Miller, H. L., and Burrows, J. P.: The semianalytical cloud retrieval algorithm for SCIAMACHY. I: The validation, Atmos. Chem. Phys., 6, 1905–1911, 2005,
http://www.atmos-chem-phys.net/6/1905/2005/.
Kokhanovsky, A. A. and Rozanov, V. V. and Zege, E. P. and Bovens-mann, H. and Burrows, J. P.: A semi-analytical cloud retrieval algorithm using backscattered radiation in 0.4-2.4 micrometers spectral range, J. Geophys. Res.-Atmos., 108(D1), 4008, doi:10.1029/2001JD001543, 2003.
Kurino, T.: A satellite infrared technique for estimating “deep/shallow” precipitation, Adv. Space Res., 19, 511–514, 1997.
Lensky, I. M. and Rosenfeld, D.: A night-time delineation algo-rithm for infrared satellite data based on microphysical consider-ations, J. Appl. Meteorol., 42, 1218–1226, 2003.
Levizzani, V.: Satellite rainfall estimations: new perspectives for meteorology and climate from the EURAINSAT project, Ann. Geophys.-Italy, 46, 363–372, 2003.
Levizzani, V. , Schmetz, J., Lutz, H. J., Kerkmann, J., Alberoni, P. P., and Cervino, M.: Precipitation estimations from geostationary orbit and prospects for Meteosat Second Generation, Meteorol. Appl., 8, 23–41, 2001.
Mason, I.: A model for assessment of weather forecasts, Aust. Me-teorol. Mag., 30, 291–302, 1982.
Nakajima, T. Y. and Nakajima, T.: Wide-area determination of cloud microphysical properties from NOAA AVHRR measure-ments for FIRE and ASTEX regions, J. Atmos. Sci., 52, 4043– 4059, 1995.
Nauss, T.: Das Rain Area Delineation Scheme RADS – ein neues Verfahren zur satellitengesttzten Erfassung der Niederschlags-flche ber Mitteleuropa, Marburger Geographische Schriften, 143, 160 pp., 2006.
Nauss, T. and Kokhanovsky, A. A.: Assignment of rainfall confi-dence values using multispectral satellite data at mid-latitudes: First results, Advances in Geosciences, 10, 99–102, 2007. Nauss, T. and Kokhanovsky, A. A.: Discriminating raining from
non-raining clouds at mid-latitudes using multispectral satellite data, Atmos. Chem. Phys., 6, 5031–5036, 2006,
http://www.atmos-chem-phys.net/6/5031/2006/.
Nauss, T., Kokhanovsky, A. A., Nakajima, T. Y., Reudenbach, C., and Bendix, J.: The intercomparison of selected cloud retrieval algorithms, Atmos. Res., 78, 46–78, 2005.
Platnick, S., King, M. D., Ackerman, S. A., Menzel, W. P., Baum, B. A., Ri¨edi, J. C., and Frey, R. A.: The MODIS cloud products: Algorithms and examples from Terra, IEEE T. Geosci. Remote, 41, 459–473, 2003.
Platnick S.: Vertical photon transport in cloud remote sensing prob-lems, J. Geophys. Res.-Atmos., 105, 22919–22935, 2000. Reudenbach, C., Heinemann, G., Heuel, E., Bendix, J., and
Winiger, M.: Investigation of summertime convective rainfall in Western Europe based on a synergy of remote sensing data and numerical models, Meteorol. Atmos. Phys., 76, 23–41, 2001. Reudenbach, C.: Konvektive Sommerniederschlge in Mitteleuropa.
Eine Kombination aus Satellitenfernerkundung und numerischer Modellierung zur automatischen Erfassung mesoskaliger Nieder-schlagsfelder, Bonner Geographische Abhandlungen, 109, 152 pp., 2003.
Rosenfeld, D., Cattani, E., Melani, S., and Levizzani, V.: Consid-erations on daylight operation of 1.6 µm vs. 3.7 µm channel on NOAA and METOP Satellites, B. Am. Meteorol. Soc., 85, 873– 881, 2004.
Schmetz, J., Pili, P., Tjemkes, S., Just, D., Kerkmann, J., Rota, S., and Ratier, A.: An introduction to Meteosat Second Generation (MSG), B. Am. Meteorol. Soc., 83, 977–992, 2002.
Stanski, H. R., Wilson, L., and Burrows, W.: Survey of com-mon verification methods in meteorology. World Weather Watch Technical Report No. 8, WMO, Geneva, WMO/TD No. 358, 1989.
Strabala, K. I., Ackerman, S. A., and Menzel, W. P.: Cloud Prop-erties Inferred from 8-12-µm Data, J. Appl. Meteorol., 33, 212– 229, 1994.
Thies, B., Nauss, T., and Bendix J.: Discriminating raining from non-raining cloud areas at mid-latitudes using Meteosat Second Generation SEVIRI nighttime data, Meteorol. Appl., in press, 2008.
Tjemkes, S. A., van de Berg, L., and Schmetz, J.: Warm water vapour pixels over high clouds as observed by Meteosat, Con-tributions to atmospheric physics, 70, 15–21, 1997.
Turk, J. and Bauer, P.: The International Precipitation Working Group and Its Role in the Improvement of Quantitative Precipita-tion Measurements, B. Am. Meteorol. Soc., 87, 643–647, 2006.
World Weather Research Program/Working Group on Numer-ical Experimentation Joint Working Group on Verification (WWRP/WGNE): Forecast Verification - Issues, Methods and FAQ, available online at http://www.bom.gov.au/bmrc/wefor/ staff/eee/verif/verif web page.html, 2007.