HAL Id: hal-02948272
https://hal.archives-ouvertes.fr/hal-02948272
Submitted on 24 Sep 2020
HAL is a multi-disciplinary open access
archive for the deposit and dissemination of sci-entific research documents, whether they are pub-lished or not. The documents may come from teaching and research institutions in France or abroad, or from public or private research centers.
L’archive ouverte pluridisciplinaire HAL, est destinée au dépôt et à la diffusion de documents scientifiques de niveau recherche, publiés ou non, émanant des établissements d’enseignement et de recherche français ou étrangers, des laboratoires publics ou privés.
variability, distribution and demography of Proechimys
cuvieri and P. guyannensis (Rodentia: Echimyidae) in
northeastern Amazonia
Claudia Regina Silva, Camila Cherem Ribas, Maria Nazareth F. da Silva,
Rafael Nascimento Leite, François Catzeflis, Duke Rogers, Benoit de Thoisy
To cite this version:
Claudia Regina Silva, Camila Cherem Ribas, Maria Nazareth F. da Silva, Rafael Nascimento Leite, François Catzeflis, et al.. The role of Pleistocene climate change in the genetic variability, distribution and demography of Proechimys cuvieri and P. guyannensis (Rodentia: Echimyidae) in northeast-ern Amazonia. PLoS ONE, Public Library of Science, 2018, 13 (12), pp.e0206660. �10.1371/jour-nal.pone.0206660�. �hal-02948272�
The role of Pleistocene climate change in
the genetic variability, distribution and
demography of Proechimys cuvieri and
P. guyannensis (Rodentia: Echimyidae) in
northeastern Amazonia
Claudia Regina SilvaID1,2*, Camila Cherem Ribas1,3, Maria Nazareth F. Da Silva3, Rafael
Nascimento Leite1, Franc¸ois Catzeflis4, Duke S. Rogers5, Benoit De Thoisy6,7 1 Programa de Po´s-Graduac¸ão em Gene´ tica, Conservac¸ão e Biologia Evolutiva, Instituto Nacional de Pesquisas da Amazoˆ nia, Petro´polis, Manaus, AM, Brazil, 2 Laborato´rio de Mamı´feros, Instituto de Pesquisas Cientı´ficas e Tecnolo´gicas do Estado do Amapa´ (IEPA), Macapa´ , AP, Brazil, 3 Programa de Colec¸ões Cientı´ficas Biolo´gicas, Instituto Nacional de Pesquisas da Amazoˆnia, Petro´polis, Manaus, AM, Brazil,
4 Institut des Sciences de l’Evolution, CNRS UMR-5554, Universite´ Montpellier-2, Montpellier, France, 5 Monte L. Bean Life Science Museum, Brigham Young University, Provo, UT, United States of America, 6 Institut Pasteur de la Guyane, Cayenne cedex, French Guiana, 7 Association Kwata, Cayenne, French
Guiana
*crsilva.ap@gmail.com
Abstract
The spiny rats, genus Proechimys, have the highest species richness within the Echimyidae family, as well as species with high genetic variability. The genus distribution includes tropi-cal South America and Central America south to Honduras. In this study, we evaluate the phylogeographic histories of Proechimys guyannensis and P. cuvieri using cytochrome b, in a densely sampled area in northeastern Amazon where both species are found in sympatry in different environments. For each species, Bayesian and Maximum Likelihood phyloge-netic analysis were congruent and recovered similar clades in the studied area. Bayesian phylogenetic analysis using a relaxed molecular clock showed that these clusters of haplo-types diversified during Pleistocene for both species. Apparently, the large rivers of the region did not act as barriers, as some clades include specimens collected from opposite banks of Oiapoque, Araguari and Jari rivers. Bayesian skyline plot analysis showed recent demographic expansion in both species. The Pleistocene climatic changes in concert with the geologic changes in the Amazon fan probably acted as drivers in the diversification that we detected in these two spiny rats. Proechimys cuvieri and P. guyannensis show genetic structure in the eastern part of the Guiana region. Greater genetic distances observed in P.
guyannensis, associated with highly structured groups, suggest that more detailed studies
of systematics and ecology should be directed to this species.
a1111111111 a1111111111 a1111111111 a1111111111 a1111111111 OPEN ACCESS
Citation: Silva CR, Ribas CC, Da Silva MNF, Leite RN, Catzeflis F, Rogers DS, et al. (2018) The role of Pleistocene climate change in the genetic variability, distribution and demography of
Proechimys cuvieri and P. guyannensis (Rodentia:
Echimyidae) in northeastern Amazonia. PLoS ONE 13(12): e0206660.https://doi.org/10.1371/journal. pone.0206660
Editor: Tzen-Yuh Chiang, National Cheng Kung University, TAIWAN
Received: January 29, 2018 Accepted: October 17, 2018 Published: December 17, 2018
Copyright:© 2018 Silva et al. This is an open access article distributed under the terms of the
Creative Commons Attribution License, which permits unrestricted use, distribution, and reproduction in any medium, provided the original author and source are credited.
Data Availability Statement: All sequences used in manuscript are available from GenBank. GenBank accession numbers are within the Supporting Information fileS1 Appendix.
Funding: We thank Fundac¸ão de Amparo à Pesquisa do Estado do Amapa´ (FAPEAP), Fundac¸ão de Amparo à Pesquisa do Estado do Amazonas (FAPEAM) and Intitut de Recherche pour le De´veloppement (IRD) for financial support
Introduction
The considerable biological diversity of the Amazon region has long stimulated the interest of researchers in relation to species richness [1,2,3], diversification process [4,5,6] and ende-mism [7,8,9]. The patterns of species distribution and genetic variability are complex in the Amazon, varying between taxa with distinct responses to historical events [10,11,12]. Wallace [7] was the first naturalist to observe that major rivers could represent barriers between popu-lations separated in different margins, promoting allopatric speciation. The so-called riverine barrier hypothesis has been corroborated by a number of studies, in particular with birds and primates [5,13,14,15], but this model was not upheld for other mammalian taxa [4,10,16,
17] or frogs [12,18]. Leite & Rogers [19] postulated that the effect of a river as a barrier depends largely on the vagility of the focal organism and that is conditioned to the geography and historical formation of the drainage system. An alternative hypothesis invoking Pleisto-cene refugia postulates that climatic oscillations during this period modified patterns of vegeta-tion cover and the degree of landscape connectivity, promoting isolavegeta-tion among populavegeta-tions [8,20]. However, palynological and geomorphological studies [21] and climate modeling [22] suggested that vegetational changes in the Quaternary were not enough to fragment the Ama-zon forest into a mosaic of forest fragments isolated by open vegetation.
In small non-volant mammals, phylogeographic structure and genetic diversification may have been influenced by historical events such as the establishment of the rivers [19,23], geo-logical formations like the Iquitos arch [10] and changes in vegetation [11]. For the full under-standing must also require considering the ecology and life history strategies of the species [16,
17]. Studies evaluating phylogeographic patterns in small, non-flying mammals suggested that there is no consensus and that the interaction between different events is to be expected [4,11,
24,25]. Bonvicino & Weksler [25] postulated that the mammalian fauna of the Amazon is still sub-sampled and the spatial and temporal genetic patterns of most of its organisms are little known.
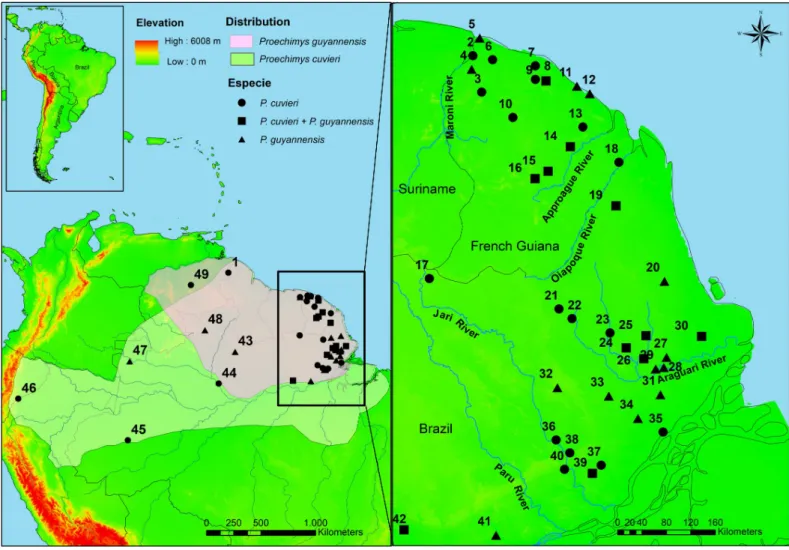
Proechimys spiny rats comprise the most species-rich genus within the family Echimyidae. The genus distribution includes tropical South America and Central America south from Honduras [26]. These terrestrial rodents are also characterized by considerable genetic and morphological variation found both within and between populations, which has hindered tax-onomic studies and the reliable delimitation of geographic ranges [26,27,28]. Twenty-two species arranged in 10 species groups are currently recognized for the genusProechimys. Two species occur in sympatry in the northeastern Amazon basin:Proechimys cuvieri Petter, 1978 is monotypic and part of thelongicaudatus species group [26]; andProechimys guyannensis (E. Geoffroy, 1803) is also considered monotypic (despite high intraspecific variation; see com-ments in Patton & Leite, [26]) and belongs to theguyannensis species group. Both species are characterized by considerable karyotypic and molecular variability [28,29,30].Proechimys cuvieri has a wide distribution (Fig 1), occurring along both margins of the Amazon (Solimões) river from Peru to its mouth, as well as throughout the entire region of the Guianas [26]. The distribution ofP. guyannensis is restricted to the Guianas (Fig 1) [26,27].
Patton et al. [10] identified four distinct clades inP. cuvieri based on the mitochondrial cytochrome b (cytb) gene. These clades share basic morphological traits, like skull and extern morphology, and have karyotypes with the same diploid number but different fundamental numbers [30,31,32]. One of the clades is distributed throughout the Guianas and east of the lower Negro River and both banks of the lower Amazon River.Proechimys guyannensis has high levels of karyotypic and molecular variability [27,28,32,33]. Bonvicino et al. [28] identi-fied distinct karyotypes inP. guyannensis from the Brazilian state of Amazonas and suggested that these represented distinct evolutionary lineages. Based on cytb sequences from a number
through the Guyamazon II research program (Process 250203021/2014). The project benefited from the support of an ‘‘Investissement d’Avenir’’ grant managed by Agence Nationale de la Recherche (CEBA, Ref. ANR-10-LABX-25-01). We also thank FAPEAP for support through the Thesis Funding Programme (Process 250203052/2014). CRS thanks Coordenac¸ão de Aperfeic¸oamento de Pessoal de Nı´vel Superior (CAPES) for a scholarship. RNL was supported by CNPq (150069 / 2014-6; 457267 / 2014-3).
Competing interests: The authors have declared that no competing interests exist.
of different localities in French Guiana, Steiner et al. [29] and Van Vuuren et al. [34] showed thatP. cuvieri is characterized by higher diversity indices than P. guyannensis, verified by the number of informative sites and nucleotide diversity. Van Vuuren et al. [34] suggested too that the populations of theP. guyannensis that have recently colonized new regions and/or are expanding.Proechimys guyannensis and P. cuvieri are recorded frequently in inventories of small non-volant mammals in the eastern Guianas, in particular within the area between the left margin of the Amazon River in the Brazilian state of Amapa´ and the Maroni River, which forms the border between French Guiana and Suriname [29,35]. These terrestrial spiny rats are found in a range of habitats, includingterra firme forests, flooded forests, forest-fragments in savannahs [36,35], in gallery forests and in isolated tracts of forest within marshland. Proe-chimys guyannensis and P. cuvieri are found in sympatry and syntopy in French Guiana [29] and other locations in the Amazon [36,37].
Fig 1. Locations ofProechimys cuvieri and Proechimys guyannensis. Distribution of the species are identified in light green for P. cuvieri and in salmon for P. guyannensis. The numbers identify the locality of the samples: (1) Baramita, (2) Ste Anne, (3) St Jean, (4) Sparouine, (5) Awala, (6) Angoulème, (7) Piste St Elie, (8)
Sinnamary, (9) Petit Saut, (10) Trinite´, (11) Macouria, (12) Cayenne, (13) Piste Belizon, (14) Nouragues, (15) Pic Matecho, (16) Sau¨l, (17) Mapaone, (18) Saint Georges, (19) Anotaie river, (20) Amapa´ Grande river, (21) Anacuı´ river, (22) Amapari river, (23) Mutum river, (24) Santo Antonio stream, (25) Brac¸o stream, (26) Falsino river, (27) Tracajatuba river, (28) Ferreira Gomes, (29) Caldeirão Falls, (30) São Bento Farm, (31) Horto Matapi, (32) Cupixi river, (33) Vila Nova river-forest, (34) Vila Nova river-savana, (35) Santana Island, (36) Jari river, (37) Marinho Village, (38) Itacara´, (39) Santo Antoˆnio Falls, (40) Porto do Sabão, (41) Jatuarana Village, (42) Mamia´ Village, (43) Alto Jatapu, (44) Meduinim Lake, (45) Barro Vermelho, (46) Pico da Neblina, (47) Amazonas, (48) Serra do Apiau´, (49) Bolı´var.
In the present study, we used the mitochondrial cytb gene to characterize the intraspecific genetic diversity ofP. guyannensis and P. cuvieri in the eastern portion of the Guiana region. Cytb has been widely used in studies of genetic variability and phylogenetics of small mammals [38,39]. Although mutation rate is high in mitochondrial DNA, it is a largely useful molecular tool for the reconstruction of the history of populations and species due to its relatively simple amplification, typically non-recombinant haploids, and its high degree of intra and interspe-cific variability [40,41].
Here, relying on extensive surveys and sampling in the northeastern Amazon basin, we evaluate the demographic history and phylogeography of the two speciesProechimys guyan-nensis and P. cuvieri and aim to describe the factors that have determined the patterns of genetic variability in the context of the geological and climatic history of the region.
Materials and methods
Study area
Tissue samples used in this study were distributed from French Guiana and the Brazilian states of Amapa´ and Para´, situated in the eastern portion of the Guiana region. This region is well-preserved, with large areas of forest protected by a network of conservation units on both sides of Brazil and French Guiana [42,43,44]. The main forest areas are found in the western por-tion of the study area, located on substrates of Precambrian origin [45]. Isolated savannahs are found throughout the study area [46] located between the forests of the interior portion and the coastal region. The coastal zone of southern Amapa´ is influenced primarily by the adjacent Amazon River, which forms extensive areas of seasonally flooded habitats, with many lakes and islands [47]. The northern coast of the state, north of the Araguari River to French Guiana, encompasses tracts of mangroves interspersed with flooded fields influenced by the Atlantic Ocean (Fig 1). The Brazilian portion of the study area is the most impacted, with extensive deforestation and human colonization along the Atlantic coast and the northern margin of the Amazon River in Para´ State [48]. A more recent impact is the ongoing expansion of soybean plantations into the savannah habitats of Amapa´ State [46,49]. In French Guiana, the principal threats are mining [50,51], and deforestation, principally on the coast [43], although forest loss remains below the rates observed in other Amazonian countries [52].
Samples
All tissues samples used in this study were obtained from voucher specimens of the Collection of Amapa´ Fauna of the Institute for Scientific and Technological Research of the state of Amapa´ (IEPA) in Macapa´; National Institute of Amazon Research (INPA) in Manaus (both in Brazil), and Collection JAGUARS, Association Kwata and Institut Pasteur de la Guyane, Cay-enne. All analysed samples were obtained specimens deposited in the aforementioned scien-tific collections, thus no collecting permits were required. Catalog numbers are given inS1 Appendix. INPA´s Ethics Committee on Animal Use (CEUA) of INPA granted formal waiver of ethics approval due to that tissue of the sequences we generated were obtained from scien-tific collections.
We sequenced 1100 base pairs (bp) of the CYTB gene in 37 samples ofProechimys cuvieri from 22 localities and 54 samples ofP. guyannensis from 20 localities within the study area, between northern French Guiana and Brazil, north of the Amazon River (Amapa´ and Para´). The two species were sympatric at 11 sites (Fig 1). We also sequenced 800 bp of CYTB in 8 samples collected in Brazil (Amazonas and Roraima states), Venezuela, and Peru (Fig 1) for phylogenetic analyses. Only 25 additional sequences were obtained from GenBank. We
analyzed a total of 124 sequences ofP. cuvieri and P. guyannensis in 50 localities; details on specimens, localities and GenBank accession numbers, are given inS1 Appendix.
Sequencing
The DNA was extracted from tissue samples, obtain of the muscle and skin byopsy, preserved in 95% ethanol. The DNA was extracted using the NucliSENS EasyMag robot (Biome´rieux, Craponne, France) and Wizard Genomic DNA Purification (Promega) kits, according to the manufacturers’ protocols. Three overlapping fragments of the cytb were amplified using inter-nal and exterinter-nal primers. We amplified the first fragment, of 400–500 bps, using the primers H6 (5'TCTTCCATGAGGACAAATATC3') and L15 (5’TCTCCATTTCTGGTTTACAA GAC3'), and the final fragment (also 400–500 bps) using the primers H8 [28] and L2 (5' TACCATGAGGACAAATATC’). The intermediate fragment, with approximately 400 bps, was amplified using the primers PRO 197F (5´TTACACAYATTTGYCGAGAYG3´) and PRO 665R (5´GGGTGRAATGGRATTTTGTCTGA3´), which were designed specifically for this study. The samples were amplified in 40μL reaction volumes using Platinum Taq (Life Tech-nologies Corp.) containing 4.0μL of each primer, 5.0 μL of reaction buffer, 3.0 μL of MgCl250 mM, 5.0μL of dNTP mix, 0.5 μL of polymerase, 2.0 μL of the DNA template, and 16,5 μL of H2O. The polymerase chain reaction (PCR) cycle consisted of initial denaturation at 94˚C for
3 min, followed by 30 amplification cycles of denaturation at 94˚C for 30 sec, annealing at 45˚C for 1 min and extension at 72˚C for 2 min, with a final extension at 72˚C for 10 min.
The PCR products were sent to Beckman Coulter Genomics (Takeley, UK) for purification and sequencing. The sequences were aligned and checked manually using MEGA 6.0 [53]. We did not observe stop codons, and transition and transversion rates were normal.
Analyses
We implemented Bayesian Inference (BI) and Maximum Likelihood (ML) phylogenetic analysis to reconstruct the relationships within the studied populations ofP. guyannensis and P. cuvieri from northeastern Amazonia using the complete dataset. Sequences of the rodent speciesTrichomys apereoides (AY083332, AY083341) and Hoplomys (HM544128, NC020657) were obtained from GenBank and included in the analyses as outgroups.
The program jModelTest version 3.7 [54] was used to select the HKY+G like the best evolu-tionary model for the datasets based on Bayesian Information Criterion (BIC). The BI phyloge-netic tree was reconstructed in MrBayes 3.2.1 [55], using 107Markov Chain Monte Carlo (MCMC) generations, with the first 25% being discarded as burn-in. The ML analysis was run in RAxML in the CIPRES Science Gateway [56]. Nodal support was estimated with 100 bootstrap replicates. We estimated the divergence time between the lineages using the relaxed lognormal uncorrelated molecular clock and the Yule Process pure-birth speciation model, run in BEAST 1.6.2 [57]. The substitution rate used in the analysis was the 3.6% divergence per million year, derived from Fabre et al. [58]. We used the following times inferred from Fabre et al. [59]: diver-gence between [Trichomys] and [Hoplomys + Proechimys spp.] set at 9.4 Ma (95% CI: 8.3–10.9) and divergence betweenHoplomys and Proechimys set at 5.5 Ma (95% CI: 4.6–6.7), with these dates being used as calibration for the most recent common ancestor (TMRCA), considering a normal distribution. Since no more recent calibration point was available, we confirmed the absence of substitution saturation on the [Trichomys + Hoplomys + Proechimys] dataset with the Xia test [60] implemented with DAMBE [61]. We generate 107Markov Chain (MCMC) genera-tions, with the first 25% being discarded as burn-in. We used TRACER 1.6 to evaluate the con-vergence of the analysis and the parameters estimated, considering an Effective Sample Size (ESS) equal to or greater than 200 [62].
We generated haplotype networks using Network 4.6 and the median-joining (MJ) method [63]. BAPS5 (Bayesian Analysis of Population Structure, [64]) was employed to verify popula-tion structure. We ran the mixture model setting the maximum possibility of clusters [64]. The genetic distance between clusters identified in BAPS5 and between clusters composed for sequences with distribution between the rivers (Oiapoque–Maroni; Araguari–Oiapoque, Jari– Araguari, and Jari–Trombetas) (Fig 1). Genetic distance was calculated using MEGA 6.0 [53]. We considered the isolation effect of different river drainages to evaluate gene flow patterns between geographic areas. We used the program Migrate [65] under a Bayesian framework to estimate effective population sizes (Θ) and migration rates M between different populations from north to south in studied area. We ran four chains with thermodynamic integration and a static heating swap scheme (temperatures: 1.0, 1.5, 3.0, 106), sampling at every 100thstep for a total of 206steps and a burn-in of 503steps.
We calculated Fu’s Fs [66], Tajima’s D [67] and R2 [68] to assess potential deviations from neutrality. We used the program DNASP version 5.0 [69] and significance was determined from 10,000 coalescent simulations. For eachProechimys species, we analyzed the complete dataset, the clusters from BAPS analyses, and samples separated by main interfluves (Maroni– Oiapoque; Oiapoque–Araguari; Araguari–Jari; Jari–Trombetas). We used the Mismatch Dis-tribution Analysis [70] with the sum of square deviations (SSD) between the observed and the expected mismatch and the ragggedness index as statistic tests and generated a Bayesian Sky-line Plot (BSP) in BEAST 1.6.2 [71] to assess the demographic history of the clusters for both species over time. We only inferred BSP for clusters with more than 10 sequences. We used HKY+G evolutionary model and Yule prior. We ran 107MCMC generations, excluding the first 25% samples as burn-in. Effective sample sizes, parameter estimates, and convergence of the Markov chains were determined using TRACER 1.6 [62].
Results
Phylogenetic relationships in
P. guyannensis and P. cuvieri
The phylogenetic reconstruction presented similar results in BI and ML analyses (Fig 2, see tooS2 AppendixandS3 Appendix). Our data for the eastern portion of the Guianas region also formed monophyletic clades for bothP. guyannensis (clade B) and P. cuvieri (clade K). The phylogenetic reconstruction identifiedP. guyannensis clades distributed between the north and southeast of the study area (clade C,Fig 2). The samples from Amazonas, Roraima, and Venezuela formed clade J. In clade C, the samples were organized in four subclades: the haplotypes from French Guiana and northern Amapa´ (clade D), central Amapa´ (clade I), south-east Amapa´ (clade H) and two localities in Para´ (clade G). These clades were well-sup-ported statistically either with bootstraps (ML) or posterior probabilities (Bayesian analysis), with the exception of clade D, which was supported only weakly by the ML analysis (Fig 2). Five clades were evidenced inP. cuvieri (clade N,Fig 2), two in northern French Guiana (clades P and R), one that groups haplotypes between central northern French Guiana to the Araguari River in Amapa´ (clade S), south-east Amapa´ and Para´, including the sample from Baramita, Guyana (clade V) and haplotypes from the Jari River, associated with those from Santana Island, in the Amazon Estuary (clade U). These clades were supported statistically by the PP or bootstrap analysis (Fig 2).
We infer thatP. guyannensis and P. cuvieri diverged in the Pliocene, around 5.03 million years ago (Mya), with 95% confidence of Highest Posterior Density Interval (HPDI) ranging between 3.8–6.2 Mya. The diversification of the clades found in the eastern portion of the Guiana region occurred in late Pliocene, at around 2.85 Mya (95% HPDI: 1.9–3.8 Mya) inP. guyannensis and more recently in early Pleistocene inP. cuvieri, at 2.19 Mya (95% HPDI: 1.4–3.1 Mya).
Genetic structure of the populations
BothProechimys species had high haplotype diversity and low nucleotide diversity (Table 1). InP. guyannensis, the 67 sequences analyzed provided 43 haplotypes, 155 polymorphic sites, and 101 informative sites for parsimony analysis. InP. cuvieri, the 49 sequences analyzed Fig 2. Molecular dating chronogram using cytochrome b with a HKY + I + G model (ML and BI topology presents similar topology). Statistical support higher than 0.90 posterior probability (PP) and 70 bootstraps is identified next to the nodes divided in two sides, the left side represents PP values and the right side the bootstrap values; black represent 1 PP and 100 bootstrap, very dark gray represent 0,99 PP and 91–99 bootstrap, dark gray represent values between 0.96–0.98 PP and 80–90 bootstrap, and light gray represents values between 0.95–0.96 PP and 70–80 bootstrap. The letters B, C, D, E, F, G, H, J and I identify clades formed inP. guyannensis. The letters K, L, M, N, O, P, Q, R, S, T, U, V and X identify clades formed in P. cuvieri. Each terminal is identified for sample followed by country of origin.
The numbers in the parentheses identified the locality in theFig 1. We also identified the state of origin in the case of Brazil. Clusters recovered by BAPS are identified after the terminals forP. guyannensis (G1, G2, G3, G4) and for P. cuvieri (C1, C2, C3, C4). Inferred spliting dates are shown on the nodes.
returned 45 haplotypes, 140 polymorphic sites, and 94 informative sites. Once analyzed with BAPS, the haplotypes ofP. guyannensis were recovered in four clusters (G1, G2, G3 and G4). These clusters correspond to the clades recovered in the phylogenetic tree (Fig 2). The haplo-types in the northern part of the study area, including samples from French Guiana and one location in the state of Amapa´ on the Anotaie River, a tributary of the Oiapoque, formed clus-ter G1. The haplotypes from the south-east of the study area, from the localities on the Jari and upper Vila Nova rivers formed group G3. Group G4 brings together the samples from two localities between the Jari and Trombetas rivers (Fig 2). The haplotype network recovered the clusters identified by the BAPS, resulting in four clusters separated from each other by more than 20 mutational steps. The geographical layout encompasses clusters distributed from north to south. Significant haplotype sharing was observed in the Cayenne locality (point 12 in
Fig 1) in the cluster G1, fifteen samples shared haplotype 1 (H1,Fig 3). Although this pattern was not upheld in other clusters which were characterized by limited haplotype sharing.
The BAPS recovered fourP. cuvieri clusters (C1, C2, C3 and C4), matching the clades recovered in the phylogenetic tree (Fig 2). Except the clades P and R (Fig 2) which make up cluster C1 in the BAPS results. The C1 cluster includes the haplotypes from the northern-most area within the study region, between the Maroni and Sinnamary rivers in French Guiana. The haplotypes distributed between central French Guiana and central Amapa´, north of the Araguari River, form cluster C2. Haplotypes from the south-east region were recovered in a cluster together with a haplotype from Santana Island, in the Amazon Estuary formed cluster C3. Finally, the C4 cluster linked the samples from the Mamia´, a tributary of the Curua´ River, with haplotypes from the Jari River and Baramita, in Guyana (Fig 4). The haplotype network also presented a topology similar to that of the haplotype tree, although the two clades P and R formed a single cluster (C1), in agreement with the BAPS results. TheP. cuvieri clusters were separated from each other by fewer mutational steps, between six and 13. There was relatively little sharing of haplotypes, and a large number of unique haplotypes (Fig 4).
We found the largest intraspecific genetic distances for both species when we compared the clusters identified by the BAPS, with p-distance ranging from 3.35% to 4.23% (Table 2) inP. guyannensis. Smaller values (0.84–1.48%) were found when comparing the interfluves (Maroni-Oiapoque, Oiapoque-Araguari, Araguari-Jari, Jari-Trombetas). Similarly, while we found high genetic distance values between interfluvial regions inP. cuvieri (p-distances: 1.2– 2.53%), they were still lower than those recorded between clusters (1.84–3.17%;Table 2). Intra-specific genetic distances were smaller in interfluves comparisons than in inter-clusters com-parisons. This is well-marked inP. guyannensis (p-values <0.01 in t-tests and Mann-Whitney Table 1. Haplotype diversity (HD), nucleotide diversity (π) and the number of individuals (N) in the clusters identified by the BAPS for P. guyannensis (G1, G2, G3, G4) andP. cuvieri (C1, C2, C3, C4), the interfluves of the study region: Maroni-Oiapoque; Oiapoque-Araguari; Araguari-Jari e Jari-Trombetas and the complete
dataset for each species.
P. guyannensis Cluster Hd π N P. cuvieri Cluster Hd P N G1 0.7660 0.00416 35 C1 0.9333 0.01523 9 G2 0.9860 0.01358 21 C2 0.9800 0.01089 22 G3 0.6667 0.00239 3 C3 1.0000 0.01023 5 G4 1.0000 0.01225 7 C4 1.0000 0.02015 10 Oiapoque-Maroni 0.7524 0.00391 36 Oiapoque-Maroni 0.9819 0.01697 22 Oiapoque-Araguari 0.9714 0.01453 15 Oiapoque-Araguari 0.9487 0.01122 11 Araguari-Jari 0.9818 0.02175 11 Araguari-Jari 1.0000 0.01868 12 Jari-Trombetas 1.0000 0.01225 7 Jari-Trombetas 1.0000 0.01399 4
All samples 0.921 0.02378 67 All samples 0.9935 0.02015 49
tests) but less pronounced inP. cuvieri (p-values 0.08 in t-tests; not significant in Mann-Whit-ney test).
Gene flow between populations
We recorded two-way migrations in all regions analyzed. The largest number of migrants (195.40) inP. guyannensis was recorded from the central region (Araguari basin) to the South region (Jari River, the Amazon and Para´ rivers). The second greatest number of migrants (82.60) was recorded between the North region (Oiapoque River and Maroni River), and the South. The lowest values were recorded from the Central region to the North with number of migrants varying between 21.70 and 50.70 (Table 3). InP. cuvieri, the largest numbers of migrants moved from the North to the Central region, and vice versa. The numbers of migrants recorded between the other regions were much smaller, and well balanced around 60.00 (Table 3).
Demographic history
We obtained significant results for the R2 (-2.3781), D (-2.3781), and Fs (-4.572) parameters for theP. guyannensis cluster G1. When we analyzed the whole dataset, however, no significant values were obtained, although a significant R2 value was obtained for cluster G4 (Table 4). We obtained similar results when we analyzed the data organized by interfluve, with signifi-cant values being recorded for all the parameters for the Oiapoque-Maroni interfluve (Fs = -4.168; D = -2.3200; R2 = -0.0617), which has haplotypes similar to the G1 cluster.
In the completeP. cuvieri dataset, the only deviation from neutrality was found in Fu’s Fs (Table 4). In the analysis of the clusters, we recorded significant Fs values for clusters C2 and C4, and significant R2 values for clusters C1 and C3. In the analysis of the interfluves, we recorded significantly R2 and Fs values for the Araguari-Jari interfluve (Table 4). The Mis-match distribution suggest a significant expansion for G1 only (both SSD and Raggedness tests p<0.05), and to a less extent for G2 (Raggedness p<0.05, SSD p value = 0.08) and G4 (SSD p< 0.01). Bayesian reconstruction of the demographic history revealed an expansion event for both species. InP. guyannensis, the most recent expansion was recorded for cluster G1 and important expansion (revealed by all statistical tests), occurring over the past 30,000 years, whereas in cluster G2, expansion was either quite older and/or of a lower extent (Fig 5). Signals of expansion population were also found in two clusters analyzed of theP. cuvieri, although they benefited from a lower statistical support (Fig 5).
Discussion
Diversification of
P. guyannensis and P. cuvieri in northeastern Amazonia
Patton et al. [10] assessed the genetic divergence inP. cuvieri samples from Brazil (Amazonas and Para´), together with localities in Peru, Venezuela and French Guiana, using sequences of the cytb gene and confirmed the monophyly for eastern Amazonia, including Guianas region clade. Our phylogenetics analyses recovered a clade ofP. cuvieri in northeastern of the Fig 3. Map (top) showing the locations of theP. guyannensis, with circle colour show the regions within the study area: North, from
the Oiapoque river basin to the Maroni River (light blue); Centre, Araguari River basin (red); Southeast, included Jari and Vila Nova river basins (yellow); and Mamia´ and Jatuarana villages, state of Para´ (blue). Based on cyt-b the haplotype network (bottom) has branch lengths corresponding to the nucleotide substitutions. The number of mutational steps of the largest branches is shown under the branches. Circle sizes correspond to the number of individuals sharing the same haplotype. Circle colors correspond to the colors of the regions identified on the map. Circles in black correspond to the mean vectors. The clusters recovered by BAPS are outlined and identified as G1, G2, G3 and G4 on the map and haplotype network.
Amazon region which appeared distinct from samples of the other Amazon regions. ForP. guyannensis the haplotypes of northeastern region were recovered in a clade separated from the other samples of the distribution area of this species (Amazonas, Roraima and Venezuela). Based on the analysis of cytb and of karyotypes forP. guyannensis samples, Bonvicino et al. [28] recovered three clades in the Guiana region including one north-eastern clade (French Guiana) and two western clades (Roraima and Amazonas/Venezuela).
We inferred a late Pliocene origin for the diversification of the clade from the eastern Gui-anas region forP. guyannensis at approximately 2.8 Mya and early Pleistocene for P. cuvieri (2.19 Mya). In both species, however, the divergence in four (P. guyannensis) and five (P. cuvieri) lineages occurred during the early Pleistocene (Fig 2). The early Pleistocene is consis-tent with the intense geomorphological changes occurring in the estuary of the Amazon River, which formed its current course, and the formation of parts of the coast of Amapa´ [5,72,73]. Temperatures also decreased during the Pleistocene [74], leading to the expansion of drier veg-etation and the fragmentation of forest blocks [8,75]. Despite the relatively limited size of our study area probably these phenomena had distinct impacts on its northern and southern por-tions contributing to the diversification of the populapor-tions of bothP. cuvieri and P.
guyannensis.
In spite of the limitation of mitochondrial data, it has already been shown to be robust [76] and has long been considered as a standard for phylogeography and for assessing genetic varia-tion within and between populavaria-tions [77]. Further, high ration of copies compared to nuclear genome allows for isolation from long dead tissues and collection-preserved samples, and con-sequently favor work on large dataset, not requiring new field captures for fresh and/or high quality samples. Here we significantly increased the knowledge about the phylogeography of these two species Amazonian Spiny rats [29,34] confirming the uniqueness of the western por-tion of the Guyana region. Our conclusions and interpretapor-tions should be confirmed by other Fig 4. Map (top) showing the locations ofP. cuvieri, with circle colour showing the regions within the study area: North, from the
Oiapoque River basin to the Maroni River (light blue); Centre, Araguari River basin (red); Southeast, included Jari and Vila Nova River basins (yellow); and Mamia´ and Jatuarana villages, state of Para´ (blue). Based on cyt-b the haplotype network (bottom) has branch lengths corresponding to the nucleotide substitutions. The number of mutational steps of the largest branches is shown in the figure captions. Circle sizes correspond to the number of individuals sharing the same haplotype. Circle colors correspond to the colors of the regions identified on the map. Circles in black correspond to the mean vectors. The clusters recovered by BAPS are outlined and identified as C1, C2, C3 and C4 on the map and haplotype network.
https://doi.org/10.1371/journal.pone.0206660.g004
Table 2. Matrix of the genetic distances (p-distance), based on the sequences of the cytb gene. We compare values from the clusters defined by the BAPS:P. guyannen-sis (G1, G2, G3, G4) and P. cuvieri (C1, C2, C3, C4). We compare between the interfluves of the study region: Maroni-Oiapoque; Oiapoque-Araguari; Araguari-Jari e
Jari-Trombetas. P. guyannensis P. cuvieri Cluster G1 G2 G3 Cluster C1 C2 C3 G1 C1 G2 3.35 C2 1.84 G3 3.55 3.75 C3 3.04 3.17 G4 4.23 3.90 3.54 C4 2.52 2.39 2.41
Interfluves Maroni Oiapoque OiapoqueAraguari Araguari Jari Interfluves Maroni Oiapoque Oiapoque Araguari Araguari Jari Maroni Oiapoque
Maroni Oiapoque
Oiapoque Araguari 1.30 Oiapoque Araguari 2.06
Araguari Jari 1.48 0.84 Araguari Jari 2.02 2.53
Jari-Trombetas 1.17 1.18 1.37 Jari-Trombetas 2.11 2.21 1.20
molecular characters, complex processes of fragmentation, expansion and admixture—as can be inferred from our study—should be confirmed through the use of several and complemen-tary types of molecular markers.
Genetic variability and demography of
P. guyannensis and P. cuvieri
Different hydrological factors, including size and course stability [10], may influence the effec-tiveness of a river to act as a barrier to gene flow. Previous studies suggested ther is no evidence for a major role of rivers in the genetic differentiation of most Amazonian rodents [4,10]. For example, the spiny ratsProechimys steerei and P. simonsi share haplotypes on both margins of the Rio Jurua´ which a highly meandering river with intense seasonal flooding in western Ama-zonia [10,16]. Similarly our results suggest that the Oiapoque, Araguari and Jari rivers have not acted as barriers to the dispersal ofP. guyannensis and P. cuvieri, since haplotypes were shared between both margins of these rivers and included in the same genetic cluster (Figs3
and4). In addition, genetic distances forP. guyannensis were significantly smaller in between opposite margins than between clusters (Table 2). Moreover the permeability of riverine barri-ers is highly dependent on species-specific traits [78]. For example, the Oiapoque river seems to be a more efficient barrier for amphibian species that are leaf-litter dwellers or lack free-liv-ing tadpoles [79].
However our results indicate that the northeastern part of the Guianas region seems to have undergone distinct evolutionary events. We found clear genetic structuring in our sample ofP. guyannensis, with an association between the haplotype network and the geographic distribu-tion of the four clusters identified as G1, G2, G3 and G4. The diversity ofP. guyannensis has been established through karyological [28,30,33], molecular [28,34] and morphological stud-ies [36,80]. French Guiana is located entirely within the area of the Guianan Shield, this region Table 3. Estimated migration amongProechimys guyannensis and P. cuvieri populations, based on analysis using the Migrate software. The samples were divided
into three regions, the North (from the Oiapoque River to Guyana), Central (Araguari basin in Amapa´) and South (Amazon Estuary, Jari and Para´ rivers). The plus sign (+) after the name of the region indicates a population receiving immigrants. The highest migration rates are marked in bold type.
Cluster P. guyannensis P. cuvieri
North+ Central+ South+ North+ Central+ South+
North 21.7 82.60 - 258.00 59.90
Central 33.70 195.40 620.00 59.10
South 46.50 50.70 58.80 61.90
https://doi.org/10.1371/journal.pone.0206660.t003
Table 4. The values of R2 [68], Fs [66], and D [67] for the clusters recuperated by the BAPS (P. guyannensis: G1, G2, G3, and G4; and P. cuvieri: C1, C2, C3, and
C4), and for the principal interfluves in the study area (samples between Oiapoque and Maroni rivers, between Oiapoque and Araguari rivers; Araguari and Jari riv-ers and Jari and Trombetas rivriv-ers), and the complete dataset.
P. guyannensis P. cuvieri Samples R2 Fs D Samples R2 Fs D Cluster G1 0.05 -4.57 -2.38 C1 0.089 2.12 1.49 G 2 0.092 -3.87 -1.31 C2 0.10 -5.22 -0.74 G 3 0.47 NA NA C3 0.12 -0.16 -0.84 G 4 0.11 -1.0 -0.40 C4 0.11 -4.39 -0.73
Between rivers Oiapoque-Maroni 0.06 -4.17 -2.32 Oiapoque-Maroni 0.12 -2.19 -0.11 Oiapoque-Araguari 0.10 -0.58 -1.50 Oiapoque-Araguari 0.12 -0.33 -0.50
Araguari-Jari 0.17 -0.23 0.51 Araguari-Jari 0.10 -3.11 -0.94
Jari-Trombetas 0.11 -1.03 -0.40 Jari-Trombetas 0.33 0.86 -0.11
All samples 0.08 -3.90 -0.72 All samples 0.07 -16.85 -1.11
is an ancient region and previous studies regarded it like a forest refugium of northeastern Amazonian [81]. Van Vuuren et al. [34] suggested a recent expansion based in the high num-ber of shared haplotypes inP. guyannensis from the regions of Cayenne and Petit Saut (seeFig 1), in French Guiana. With the increase of the sampled area in northeastern Amazonia, we identified a cluster (G1) that groups samples from northern of French Guiana to Oiapoque River, with a large number of shared haplotypes. This cluster includes a haplotype (H1) that is shared with the majority of the samples from Cayenne, with one principal haplotype (H35) that forms the center of a star-like network, which may reflect recent colonization and/or are expanding population [34,82].
InP. cuvieri we recorded also four clades, of which cluster C1 occurs in the north of our study area, in the region between the Maroni and Mana rivers in northern French Guiana. We estimated the diversification at approximately 1.76 Mya for cluster C1 inP. cuvieri and 1.68 Mya for G1 inP. guyannensis (Fig 2). These two datings, almost similar, might be the result of a process of genetic isolation in forest fragments produced by the intense changes in the con-figuration of the region’s vegetation that occurred during the early Pleistocene and late Fig 5. Bayesian Skyline Plots showing the demographic evolution for theP. guyannensis, G1 (A) and G2 (B) and P. cuvieri C2 (C) and C3 (D).
Pliocene [8,83]. Cold and warm periods of the Pleistocene, isolating populations and promot-ing backward and forward migrations, may also have led to competitive interactions between the two species, and facilitated structuration, in a dynamic process comparable to the distur-bance-vicariance hypothesis [84].
We also detected a signal of recent expansion indicated by the high degree of haplotype sharing (Fig 3) and demographic changes (Fig 5andTable 3). The most intense demographic expansion in bothP. cuvieri and P. guyannensis occurred over the past 20,000 years (Fig 5), when the climate became more favorable for mesic environments after the Last Glacial Maxi-mum (LGM) (20,000 yr BP) [85,86]. While there is no clear consensus on the extent to which the region’s forests were reduced or fragmented during the LGM [86], it does seem likely that the forests shrank as temperatures decreased [74,87]. In north-eastern Amazonia, open habi-tats, such as dry forests and savannahs, probably expanded during the LGM [88,89]. It seems likely that the spiny rats,P. cuvieri and P. guyannensis, benefitted from the subsequent increase in temperatures and the expansion of humid forests, as shown with their demographic expan-sion (Fig 5).
Conclusions
Intense landscape changes, such as the expansion of drier vegetation and the fragmentation of forest blocks related to the decrease in temperatures during the Pleistocene, and the intense geomorphological changes occurring in the estuary of the Amazon River around this time, had distinct impacts on the northern and southern portions of eastern Guianas. This climate and landscape changes probably drivers the diversification of the two spiny rats. Consequently, Proechimys cuvieri and P. guyannensis populations in the eastern portion of the Guiana region were geographically structured. Apparently two events were important in the structuration of populations in both species of spiny rats, first the geomorphological changes having occurred during the early Pleistocene (having led to the different clusters in each species:Fig 2) and much later the climatic changes in Late Pleistocene (LGM) resulting in the structuration of some clusters (Fig 3andFig 4). Then, the clusters G1 and C1 went through a demographic expansion (Fig 5) with the end of the LGM, probably resulting in a founding effect, mainly in P. guyannensis (G1). The genetic distances recorded associated with the structured population clusters, reinforce the need for a more detailed investigation of the comparative ecology and phylogeography of both species, with special attention toP. guyannensis for testing its well-marked structuration. Likely different ecological traits, use of space, preferred resources, adap-tive ability to face habitat modifications, should be described more deeply. For a more detailed systematic review of the genus, it is necessary to include specimens from throughout the distri-bution ofProechimys, employing wider genetic or genomic approaches and karyotyping.
Supporting information
S1 Appendix. Localities of the samples (tissues) shown onFig 1, geographic coordinates (in DD˚, DDD), haplotypes (H) and sample identification in parentheses. GenBank
acces-sion numbers forProechimys guyannensis and Proechimys cuvieri are MK139156 to MK139242 and MK184542 to MK184553.
(DOCX)
S2 Appendix. Phylogenetic tree obtained by Bayesian Inference with node supports. Each
terminal is identified for sample name followed by country of origin, State was included in Brazilian samples. Clusters recovered by BAPS are identified after the terminals forP.
guyannensis (G1, G2, G3, G4) and P. cuvieri (C1, C2, C3, C4). (TIFF)
S3 Appendix. Phylogenetic tree obtained by maximum likelihood with node supports.
Each terminal is identified for sample followed by country of origin, State was included in Bra-zilian samples. We also indicate the state of origin in the case of Brazil. Clusters recovered by BAPS are identified after the terminals forP. guyannensis (G1, G2, G3, G4) and P. cuvieri (C1, C2, C3, C4).
(TIFF)
Acknowledgments
We thank Claudia Funi, Henrique SR Gomes, Isai J Castro, Romina S Batista and Emmanuel Douzery for the support during the preparation of this article. Chrysoula Gubili for review and comments on the initial manuscript. Marcio W. Neri and Sergio Cunha helped us with the fig-ures edition. We are very grateful to two anonymous reviewers for their much useful contribu-tions to this article.
Author Contributions
Conceptualization: Claudia Regina Silva, Camila Cherem Ribas, Maria Nazareth F. Da Silva,
Benoit De Thoisy.
Data curation: Claudia Regina Silva, Benoit De Thoisy.
Formal analysis: Claudia Regina Silva, Camila Cherem Ribas, Rafael Nascimento Leite, Benoit
De Thoisy.
Funding acquisition: Claudia Regina Silva, Maria Nazareth F. Da Silva, Benoit De Thoisy. Investigation: Claudia Regina Silva, Benoit De Thoisy.
Resources: Claudia Regina Silva, Maria Nazareth F. Da Silva, Rafael Nascimento Leite,
Fran-c¸ois Catzeflis, Duke S. Rogers, Benoit De Thoisy.
Supervision: Claudia Regina Silva, Benoit De Thoisy. Writing – original draft: Claudia Regina Silva.
Writing – review & editing: Claudia Regina Silva, Maria Nazareth F. Da Silva, Rafael
Nasci-mento Leite, Franc¸ois Catzeflis, Benoit De Thoisy.
References
1. Dixon JR, Soini P. The reptiles of the upper Amazon Basin, Iquitos Region Peru. Milwaukee, Wiscon-sin: Milwaukee Public Museum; 1986.
2. Voss RS, Emmons LH. Mammalian diversity in neotropical lowland rainforests: a preliminary assess-ment. Bull Am Mus Nat Hist. 1996; 230: 1–115.
3. Lim BK, Engstrom MD. Mammals of Iwokrama Forest. Proc Acad Nat Sci. 2005; 154: 71–108.
4. da Silva MNF, Patton JL. Molecular phylogeography and the evolution and conservation of Amazonian mammals. Mol Ecol Resour. 1998; 7: 475–486.
5. Ribas CC, Aleixo A, Nogueira ACR, Miyaki CY, Cracraft J. A palaeobiogeographic model for biotic diversification within Amazonia over the past three million years. Proc R Soc Lond B Biol Sci. 2012; 279: 681–689.
6. Lynch Alfaro JW, Boubli JP, Paim FP, Ribas CC, da Silva MNF, Messias MR, et. al. Biogeography of squirrel monkeys (genus Saimiri): South-central Amazon origin and rapid pan-Amazonian diversifica-tion of a lowland primate. Mol Phylogenet Evol. 2014; 82, Part B: 436–454.https://doi.org/10.1016/j. ympev.2014.09.004PMID:25305518
7. Wallace AR. On the monkeys of the Amazon. J Zool. 1852; 20: 107–110.
8. Haffer J. Speciation in Amazonian Forest Birds. Science. 1969; 165: 131–136.https://doi.org/10.1126/ science.165.3889.131PMID:17834730
9. Cracraft J. Historical biogeography and patterns of differentiation within the South American avifauna: areas of endemism. Ornithol Monogr. 1985; 36: 49–84.
10. Patton JL, da Silva MNF, Malcolm JR. Mammals of the Rio Jurua and the evolutionary and ecological diversification of Amazonia. Bull Am Mus Nat Hist. 2000; 244: 1–306.
11. Costa LP. The historical bridge between the Amazon and the Atlantic Forest of Brazil: a study of molec-ular phylogeography with small mammals. J Biogeogr. 2003; 30: 71–86.
12. Fouquet A, Noonan BP, Rodrigues MT, Pech N, Gilles A, Gemmell NJ. Multiple quaternary refugia in the eastern Guiana Shield revealed by comparative phylogeography of 12 frog species. Systematic Biology. 2012; 61: 461–489.https://doi.org/10.1093/sysbio/syr130PMID:22223446
13. Ayres JM, Clutton-Brock TH. River Boundaries and Species Range Size in Amazonian Primates. Am Nat. 1992; 140: 531–537.https://doi.org/10.1086/285427PMID:19426056
14. Peres CA, Patton JL, da Silva MNF. Riverine Barriers and Gene Flow in Amazonian Saddle-Back Tam-arins. Folia Primatol. 1996; 67: 113–124.https://doi.org/10.1159/000157213PMID:9032947
15. Aleixo A. Historical diversification of a Terra-firme forest bird superspecies: A phylogeographic perspec-tive on the role of different hypotheses of Amazonian diversification. Evolution. 2004; 58: 1303–1317. PMID:15266979
16. Matocq MD, Patton JL, da Silva MNF. Population genetic structure of two ecologically distinct Amazo-nian spiny rats: Separating history and current ecology. Evolution. 2000; 54: 1423–1432. PMID:
11005308
17. Rocha RG, Ferreira E, Fonseca C, Justino J, Leite YLR, Costa LP. Seasonal flooding regime and eco-logical traits influence genetic structure of two small rodents. Ecol Evol. 2014; 4: 4598–4608.https:// doi.org/10.1002/ece3.1336PMID:25558355
18. Gascon C, Lougheed SC, Bogart JP. Patterns of genetic population differentiation in four species of Amazonian frogs: A test of the riverine barrier hypothesis. Biotropica. 1998; 30: 104–119.
19. Leite RN, Rogers DS. Revisiting Amazonian phylogeography: insights into diversification hypotheses and novel perspectives. Org Divers Evol. 2013; 13 (4): 639–664.
20. Haffer J, Prance GT. Climatic forcing of evolution in Amazonia during the Cenozoic: On the refuge the-ory of biotic differentiation. Amazoniana-Limnologia Et Oecologia Regionalis Systemae Fluminis Ama-zonas. 2001; 16: 579–605
21. Colinvaux PA, De Oliveira PE, Bush MB. Amazonian and neotropical plant communities on glacial time-scales: The failure of the aridity and refuge hypotheses. Quat Sci Rev. 2000; 19: 141–169
22. Mayle FE, Beerling DJ, Gosling WD, Bush MB. Responses of Amazonian ecosystems to climatic and atmospheric CO2 changes since the Last Glacial Maximum. Philos Trans R Soc Lond B Biol Sci. 359: 2004; 499–514.https://doi.org/10.1098/rstb.2003.1434PMID:15212099
23. Rocha RG, Ferreira E, Loss AC, Heller R, Fonseca C, Costa LP. The Araguaia River as an Important Biogeographical Divide for Didelphid Marsupials in Central Brazil. Journal of Heredity. 2015; 106: 593– 607.https://doi.org/10.1093/jhered/esv058PMID:26249652
24. Patton JL, da Silva MNF. Rivers, refuges, and ridges. The geography of speciation of Amazonian mam-mals. In: Howard DJ, Berlocher SH, editors. Endless forms: species and speciation. New York: Oxford University Press; 1998. pp. 202–213.
25. Bonvicino CR, Weksler M. Speciation in Amazonia: patterns and predictions of a network of hypothe-ses. In: Patterson BD, Costa LP, editors. Bones, clones, and biomes. Chicago: University of Chicago Press; 2012. pp. 259–282.
26. Patton JL, Leite RN. Genus Proechimys J. A. Allen, 1899. In: Patton JL, Pardiñas UFJ, D´Elı´a G, edi-tors. Mammals of South America: Rodents. Chicago: University of Chicago Press; 2015. pp. 2932– 3054.
27. Weksler M, Bonvicino CR, Otazu IB, Silva JS. Status of Proechimys roberti and P. oris (Rodentia: Echi-myidae) from eastern Amazonia and central Brazil. J Mammal. 2001; 82: 109–122.
28. Bonvicino CR, Otazu IB, Vilela JF. Karyologic and molecular analysis of Proechimys Allen, 1899 (Rodentia, Echimyidae) from the Amazon Region. Arq Mus Nac. 2005; 63: 191–200.
29. Steiner C, Sourrouille P, Catzeflis F. Molecular characterization and mitochondrial sequence variation in two sympatric species of Proechimys (Rodentia: Echimyidae) in French Guiana. Biochem Syst Ecol. 2000; 28: 963–973. PMID:10996261
30. Eler ES, da Silva MNF, Silva CEF, Feldberg E. Comparative cytogenetics of spiny rats of the genus
Proechimys (Rodentia, Echimyidae) from the Amazon region. Genet Mol Res. 2012; 11: 830–846.
https://doi.org/10.4238/2012.April.3.5PMID:22576911
31. Maia V, Langguth A. Constutive Heterochromatin Polymorphism an Nors in Proechimys cuvieri, 1978 (RODENTIA, ECHIMYIDAE). Revista Brasileira De Genetica. 1993; 16: 145–154.
32. Silva CF, Eler ES, da Silva MNF, Feldberg E. Karyological analysis of Proechimys cuvieri and
Proechi-mys guyannensis (Rodentia, Echimyidae) from central Amazon. Genetics and Molecular Biology. 2012;
35: 88–94. PMID:22481879
33. Machado T, Silva MJD, Leal-Mesquita ER, Carmignotto AP, Yonenaga-Yassuda Y. Nine karyomorphs for spiny rats of the genus Proechimys (Echimyidae, Rodentia) from North and Central Brazil. Genetics and Molecular Biology. 2005; 28: 682–692.
34. Van Vuuren BJ, Kinet S, Chopelet J, Catzeflis F. Geographic patterns of genetic variation in four Neo-tropical rodents: conservation implications for small game mammals in French Guiana. Biol J Linn Soc Lond. 2004; 81: 203–218.
35. Silva CR, Martins ACM, Castro IJ, Bernard E, Cardoso EM, Lima DD, et al. Mammals of Amapa State, Eastern Brazilian Amazonia: a revised taxonomic list with comments on species distributions. Mamma-lia. 2013; 77: 409–424.
36. Voss RS, Lunde DP, Simmons NB. The mammals of Paracou, French Guiana: A neotropical lowland rainforest fauna—part 2. Nonvolant species. Bull. Am. Mus. Nat. Hist. 2001: 3–236.
37. Malcolm JR. Use of tooth impressions to age and identify live Proechimys guyannensis and P. cuvieri (Rodentia: Echimyidae). J Zool. 1992; 227: 537–546.
38. Lara MC, Patton JL da Silva MNF. The simultaneous diversification of echimyid (rodents Hystricognathi) based on complete cytochrome b sequences. Mol Phylogenet Evol. 1996; 5: 403–413.https://doi.org/ 10.1006/mpev.1996.0035PMID:8728398
39. Faulkes CG, Abbott DH, O’Brien HP. Micro and macrogeographical genetic structure of colonies of naked mole-rats Heterocephalus glaber. Mol Ecol. 1997; 6: 615–628. PMID:9226945
40. Hurst GDD, Jiggins FM. Problems with mitochondrial DNA as a marker in population, phylogeographic and phylogenetic studies: the effects of inherited symbionts. Proc R. Soc Lond B Biol Sci. 2005; 272: 1525–1534.
41. Nabholz B, Gle´min S, Galtier N. Strong variations of mitochondrial mutation rate across mammals the longevity hypothesis. Mol Bio Ev. 2007; 25 (4): 795.
42. Drummond JA, Dias TCAC, Brito DMC. Atlas das Unidades de Conservac¸ão do Estado do Amapa´ . Macapa´ : MMA/IBAMA-AP, GEA/SEMA; 2008.
43. Gond V, Bernard JZ, Brognoli C, Brunaux O, Coppel A, Demenois J, et al. Analyse multiscalaire de la caracterisation des e´cosystèmes forestiers guyanais et des impacts humainsàpartir de la teledetection spatiale. In: Philippe J. editor. Ecosystemes Forestiers des Caraıbes; Paris: Karthala; 2009. pp. 461– 481.
44. Santos D, Barreto G. Unidades de Conservac¸ão Estaduais do Para´ na Região da Calha Norte do rio Amazonas. 2st ed. Bele´m: IMAZON; 2012.
45. ter Steege H, Pitman NCA, Phillips OL, Chave J, Sabatier D, Duque A et al. Continental-scale patterns of canopy tree composition and function across Amazonia. Nature. 2006; 443: 444–447.https://doi. org/10.1038/nature05134PMID:17006512
46. Mustin K, Carvalho WD, Hila´rio RR, Costa-Neto SV, Silva CR, Vasconcelos IM, et al. Biodiversity, threats and conservation challenges in the Cerrado of Amapa´ , an Amazonian savanna. Nat Conserv. 2017; 22: 107–127.
47. IBGE, Instituto Brasileiro de Geografia e Estatı´stica. Mapa de Unidades de Relevo, Escala: 1: 5.000.000. 2 st ed. Rio de Janeiro. 2004.
48. Soares-Filho BS, Nepstad DC, Curran L, Cerqueira GC, Garcia RA, Ramos CA, et al. Cena´rios de des-matamento para a Amazoˆ nia. Estudos Avanc¸ados. 2005; 19: 137–152.
49. IBGE, Instituto Brasileiro de Geografia e Estatı´stica. A´ rea plantada, a´rea colhida, quantidade produ-zida, rendimento me´dio e valor da produc¸ão das lavouras tempora´ rias. Available:https://sidra.ibge.gov. br/Tabela/1612. Access in dec. 2017.
50. Hammond DS, Gond V, de Thoisy B, Forget PM, DeDijn B. Causes and consequences of a tropical for-est gold rush in the Guiana Shield, South America. Ambio. 2007; 36: 661–670. PMID:18240682 51. Alvarez-Berrios NL, Aide MT. Global demand for gold is another threat for tropical forests. Environ Res
Lett. 2015; 10: 014006.
52. GFW (2017) Global Forest Watch. Avaiable; 2017.http://blog.globalforestwatch.org/places. Accessed 25 November 2017.
53. Tamura K, Stecher G, Peterson D, Filipski A, Kumar S. MEGA6: Molecular Evolutionary Genetics Anal-ysis Version 6.0. Mol Biol Evol. 2013; 30: 2725–2729.https://doi.org/10.1093/molbev/mst197PMID:
24132122
54. Darriba D, Taboada GL, Doallo R, Posada D. jModelTest 2: more models, new heuristics and parallel computing. Nature Methods. 2012; 9: 772–772.
55. Ronquist F, Teslenko M, van der Mark P, Ayres DL, Darling A, Hohna S, et al. MrBayes 3.2: Efficient Bayesian Phylogenetic Inference and Model Choice Across a Large Model Space. Syst Biol. 2012; 61: 539–542.https://doi.org/10.1093/sysbio/sys029PMID:22357727
56. Stamatakis A. RAxML-VI-HPC: maximum likelihood-based phylogenetic analyses with thousands of taxa and mixed models. Bioinformatics. 2006; 22: 2688–2690.https://doi.org/10.1093/bioinformatics/ btl446PMID:16928733
57. Drummond AJ, Rambaut A. BEAST: Bayesian evolutionary analysis by sampling trees. BMC Evol Biol. 2007; 7: 214.https://doi.org/10.1186/1471-2148-7-214PMID:17996036
58. Fabre PH, Vilstrup JT, Raghavan M, Sarkissian CD, Willerslev E, Douzery EJP. Rodents of the Carib-bean: origin and diversification of hutias unravelled by next-generation museomics. Biol Lett. 2014; 10: 0266.
59. Fabre PH, Vilstrup JT, Raghavan M, Sarkissian CD, Willerslev E, Douzery EJP. Mitogenomic Phylog-eny, Diversification, and Biogeography of South American Spiny Rats. Mol Biol Evol. 2017; 34 (3): 613–633.https://doi.org/10.1093/molbev/msw261PMID:28025278
60. Xia et al. An index of substitution saturation and its application. Molecular Phylogenetics and Evolution. 2003; 26:1–7. PMID:12470932
61. Xia X. DAMBE7: New and improved tools for data analysis in molecular biology and evolution. Molecu-lar Biology and Evolution. 2018; 35:1550–1552.https://doi.org/10.1093/molbev/msy073PMID:
29669107
62. Rambaut A, Drummond AJ. Tracer v1.6. 2014. Available:http://tree.ed.ac.uk/software/tracer.
63. Bandelt HJ, Forster P, Rohl A. Median-joining networks for inferringintraspecific phylogenies. Mol Biol Evol. 1999; 16: 37–48.https://doi.org/10.1093/oxfordjournals.molbev.a026036PMID:10331250 64. Corander J, Siren J, Arjas E. Bayesian spatial modeling of genetic population structure. Comput Stat.
2008; 23: 111–129.
65. Beerli P, Felsenstein J. Maximum likelihood estimation of a migration matrix and effective population sizes in n subpopulations by using a coalescent approach. Proc Natl Acad Sci USA. 2001; 98: 4563– 4568.https://doi.org/10.1073/pnas.081068098PMID:11287657
66. Fu YX. Statistical tests of neutrality of mutations against population growth, hitchhiking and background selection. Genetics. 1997; 147: 915–925. PMID:9335623
67. Tajima F. Statistical-Method for testing the neutral mutation hypothesis by DNA Polymorphism Genet-ics. 1989; 123: 585–595. PMID:2513255
68. Ramos-Onsins SE, Rozas J. Statistical properties of new neutrality tests against population growth. Mol Biol Evol. 2002; 19: 2092–2100.https://doi.org/10.1093/oxfordjournals.molbev.a004034PMID:
12446801
69. Librado P, Rozas J. DnaSP v5: a software for comprehensive analysis of DNA polymorphism data. Bio-informatics. 2009; 25: 1451–1452.https://doi.org/10.1093/bioinformatics/btp187PMID:19346325 70. Rogers AR, Harpending HC. Population growth makes waves in the distribution of pairwise genetic
dif-ferences. Mol Biol Evol. 1992; 9: 552–569.https://doi.org/10.1093/oxfordjournals.molbev.a040727
PMID:1316531
71. Drummond AJ, Rambaut A, Shapiro B, Pybus OG. Bayesian Coalescent Inference of Past Population Dynamics from Molecular Sequences. Mol Biol Evol. 2005; 22: 1185–1192.https://doi.org/10.1093/ molbev/msi103PMID:15703244
72. Hoorn C, Wesselingh FP, ter Steege H, Bermudez MA, Mora A, Sevink J, et al. Amazonia Through Time: Andean Uplift, Climate Change, Landscape Evolution, and Biodiversity. Science. 2010; 330: 927–931.https://doi.org/10.1126/science.1194585PMID:21071659
73. Latrubesse EM, Cozzuol M, da Silva-Caminha SAF, Rigsby CA, Absy ML, Jaramillo C. The Late Mio-cene paleogeography of the Amazon Basin and the evolution of the Amazon River system. Earth-Sci-ence Reviews. 2010; 99: 99–124.
74. Latrubesse EM, da Silva SAF, Cozzuol M, Absy ML. Late Miocene continental sedimentation in south-western Amazonia and its regional significance: Biotic and geological evidence. J South Am Earth Sci. 2007; 23: 61–80.
76. Hung CM, Drovetski SV, Zink RM. Matching loci surveyed to questions asked in phylogeography. Proc R Soc B. 2016; 283: 20152340.https://doi.org/10.1098/rspb.2015.2340PMID:26962145
77. DeSalle R, Schierwater B, Hadrys H. MtDNA: The small workhorse of evolutionary studies. Front Biosci. 2017; 22: 873–87.
78. Burney CW, Brumfield RT. Ecology predicts levels of genetic differentiation in Neotropical birds. Am Nat. 2009; 174 (3): 358–368.https://doi.org/10.1086/603613PMID:19627230
79. Fouquet A, Courtois EA, Baudain D, Lima JD, Scotti I. The trans-riverine genetic structure of 28 Amazo-nian frog species is dependent on life history. J Trop Ecol. 2015; 31: 361–373.
80. Catzeflis F, Steiner C. Nouvelles donne´ es sur la morphologic compare´e et la distribution des rats epi-neux Proechimys cuvieri et P. cayennensis (Echimyidae: Mammalia) en Guyane francaise. Mammalia. 2000; 64 (2): 209–220.
81. de Granville JJ. Rain forest and xeric flora refuges in French Guiana. In: Prance GT. editor. Biological diversification in the tropics. New York: Columbia University Press; 1982. Pp. 159–181.
82. Conroy CJ, Cook JA. Phylogeography of a post-glacial colonizer: Microtus longicaudus (Rodentia: Muri-dae). Mol Ecol. 2000; 9: 165–175. PMID:10672160
83. Wuster W, Ferguson JE, Quijada-Mascarenas A, Pook CE, Salomão MG, Thorpe RS. Tracing an inva-sion: landbridges, refugia, and the phylogeography of the Neotropical rattlesnake (Serpentes: Viperi-dae: Crotalus durissus). Mol Ecol. 2005; 14: 1095–1108.https://doi.org/10.1111/j.1365-294X.2005. 02471.xPMID:15773938
84. Haffer J. Hypotheses to explain the origin of species in Amazonia. J Biol. 2008; 68: 917–947.
85. Clark PU, Dyke AS, Shakun JD, Carlson AE, Clark J; Wohlfarth B. et al. The Last Glacial Maximum. Sci-ence. 2009; 325 (5941): 710–4.https://doi.org/10.1126/science.1172873PMID:19661421
86. Van der Hammen T, Hooghiemstra H. Quaternary Science Reviews 19. 2000; 725–74.
87. Anhuf D, Ledru MP, Behling H, Cruz FW Jr, Cordeiro RC, Van der Hammen T, et al. Paleo-environmen-tal change in Amazonian and African rainforest during the LGM. Palaeogeogr Palaeoclimatol Palaeoe-col. 2006; 239: 510–527.
88. Bush MB, Miller MC, De Oliveira PE, Colinvaux PA. Orbital forcing signal in sediments of two Amazo-nian lakes. J Paleolimnol. 2002; 27: 341–352.
89. Rossetti DF, Bertani TC, Zani H, Cremon EH, Hayakawa EH. Late Quaternary sedimentary dynamics in Western Amazonia: implications for the origin of open vegetation/forest contrasts. Geomorphology. 2012; 177: 74–92.


![Table 4. The values of R2 [68], Fs [66], and D [67] for the clusters recuperated by the BAPS (P](https://thumb-eu.123doks.com/thumbv2/123doknet/13672397.430780/14.918.55.868.840.1048/table-values-r-fs-d-clusters-recuperated-baps.webp)

