HAL Id: inserm-00090466
https://www.hal.inserm.fr/inserm-00090466
Submitted on 31 Aug 2006
HAL is a multi-disciplinary open access
archive for the deposit and dissemination of
sci-entific research documents, whether they are
pub-lished or not. The documents may come from
teaching and research institutions in France or
abroad, or from public or private research centers.
L’archive ouverte pluridisciplinaire HAL, est
destinée au dépôt et à la diffusion de documents
scientifiques de niveau recherche, publiés ou non,
émanant des établissements d’enseignement et de
recherche français ou étrangers, des laboratoires
publics ou privés.
images using the fast Fourier transform.
Barbara Brunet-Imbault, Gerald Lemineur, Christine Chappard, Rachid
Harba, Claude-Laurent Benhamou
To cite this version:
Barbara Brunet-Imbault, Gerald Lemineur, Christine Chappard, Rachid Harba, Claude-Laurent
Ben-hamou. A new anisotropy index on trabecular bone radiographic images using the fast Fourier
trans-form.. BMC Medical Imaging, BioMed Central, 2005, 5, pp.4. �10.1186/1471-2342-5-4�.
�inserm-00090466�
Open Access
Research article
A new anisotropy index on trabecular bone radiographic images
using the fast Fourier transform
Barbara Brunet-Imbault
1, Gerald Lemineur
1,2, Christine Chappard
1,
Rachid Harba
2and Claude-Laurent Benhamou*
1Address: 1Equipe Inserm 658, Hôpital Porte Madeleine, BP 2439, 45032 Orléans Cedex 1, France and 2Laboratoire d'Electronique, Signaux, Images, Université d'Orléans, BP 6744, 45067 Orléans, France
Email: Barbara Brunet-Imbault - [email protected]; Gerald Lemineur - [email protected];
Christine Chappard - [email protected]; Rachid Harba - [email protected]; Claude-Laurent Benhamou* - [email protected]
* Corresponding author
Abstract
Background: The degree of anisotropy (DA) on radiographs is related to bone structure, we
present a new index to assess DA.
Methods: In a region of interest from calcaneus radiographs, we applied a Fast Fourier Transform
(FFT). All the FFT spectra involve the horizontal and vertical components corresponding respectively to longitudinal and transversal trabeculae. By visual inspection, we measured the spreading angles: Dispersion Longitudinal Index (DLI) and Dispersion Transverse Index (DTI) and calculated DA = 180/(DLI+DTI). To test the reliability of DA assessment, we synthesized images simulating radiological projections of periodic structures with elements more or less disoriented.
Results: Firstly, we tested synthetic images which comprised a large variety of structures from
highly anisotropic structure to the almost isotropic, DA was ranging from 1.3 to 3.8 respectively. The analysis of the FFT spectra was performed by two observers, the Coefficients of Variation were 1.5% and 3.1 % for intra-and inter-observer reproducibility, respectively. In 22 post-menopausal women with osteoporotic fracture cases and 44 age-matched controls, DA values were respectively 1.87 ± 0.15 versus 1.72 ± 0.18 (p = 0.001). From the ROC analysis, the Area Under Curve (AUC) were respectively 0.65, 0.62, 0.64, 0.77 for lumbar spine, femoral neck, total femoral BMD and DA.
Conclusion: The highest DA values in fracture cases suggest that the structure is more
anisotropic in osteoporosis due to preferential deletion of trabeculae in some directions.
Background
The cancellous bone microarchitecture corresponds to the spatial organization and morphology of the trabecular network. Sugita et al. [1] observed that the mechanical behavior of the cancellous bone varied following the
test-ing direction; these variations were interpreted as an ani-sotropic feature of the bone stress. Trabecular bone anisotropy corresponds to the preferential orientation(s) of trabeculae. Anisotropy is constituted under the influ-ence of prefererential oriented strength applied to bone
Published: 31 May 2005
BMC Medical Imaging 2005, 5:4 doi:10.1186/1471-2342-5-4
Received: 01 September 2004 Accepted: 31 May 2005 This article is available from: http://www.biomedcentral.com/1471-2342/5/4
© 2005 Brunet-Imbault et al; licensee BioMed Central Ltd.
This is an Open Access article distributed under the terms of the Creative Commons Attribution License (http://creativecommons.org/licenses/by/2.0), which permits unrestricted use, distribution, and reproduction in any medium, provided the original work is properly cited.
[2] and permits to establish resistance to these strengths in a given preferential direction. Sugita et al. [1] concluded that anisotropy of the cancellous bone should be consid-ered to predict the fracture risk.
The determination of collagen and crystal orientation in connective tissues at molecular scale has been studied, for instance by diffraction [3-6]. Amorphous materials such as reinforced concrete have been characterized by x-rays and the orientation of fibers investigated by the Fourier transform method [7]. Defossez et al. assessed several methods on images of the femoral neck region: co-occur-rence and run length matrix, spatial-frequency and fractal techniques to determine the trabecular direction [8]. These methods exhibited a high degree of accuracy, sug-gesting a possibility of trabecular orientation characteriza-tion in clinical practice [8].
Different methods are available to characterize the struc-tural anisotropy on bone radiographs. In 1970, Singh et
al. [9] developed a semi-quantitative index applied to
femoral neck radiographs. This index is based on the exist-ence of several arches of trabeculae in the femoral neck. Some arches preferentially disappear with age and oste-oporosis, and the count of these arch systems can be used to determine the Singh index. Aggarwal et al. [10] devel-oped a similar index for the calcaneus. Whitehouse et al. [11] introduced the Mean Intercept Length (MIL) defined as the average length between two bone/marrow inter-faces. The MIL polar diagram generates an ellipse for 2D slice images [11] or projectional images such as radio-graphs [12], and an ellipsoid for 3D images [13]. A MIL tensor can be calculated [13] by fitting the MIL values and can be used to determine the Degree of Anisotropy (DA) [14]. The MIL method requires a previous binarization of the gray-level images, then it is a suitable method for the calculation of DA from 3D images obtained by Quantita-tive Computed Tomography (QCT) [15,16] or Magnetic Resonance Imaging [17]. Therefore, the binarization on 2D radiographs remains a critical step due to partial vol-ume effect. The MIL method was used by Luo et al. [18] to compare the anisotropy of the 3D structure and of the 2D projected image of one in vitro sample and 14 simulation models derived from this sample. The authors reported a very good correlation (r = 0.99) between anisotropy val-ues assessed on the 3D trabecular structure and the 2D projection images. Luo et al. [18] insisted on the interest of the estimation of architectural fabric from plain radiographs.
Few methods evaluating the trabecular structure have been developed on radiographs. Caldwell et al. [19] devel-oped a method characterizing trabecular bone structure on vertebral digitized radiographs. An evaluation of the orientation named the fraction orientation edges is
obtained from the histogram of the magnitude of the edge gradient versus the direction of the edges. Geraets et al. [20] developed an index called Line Fraction Deviation (LFD) derived from the tresholded radiographs and based on the fraction of bone pixels. A diagram plotting the standard deviation of this fraction in all directions could reflect the orientation of the trabecular bone. This method has been found more sensitive than MIL method on bone radiographs to evaluate anisotropy [12]. Jiang et al. [21] developed a method for a non invasive evaluation of bone mechanical properties: textural features, the global Minkowski dimension and trabecular orientation were determined using Minkowski dimension analysis. Jiang et
al. demonstrated the contribution of normalized Bone
Mineral Density (BMD), structural features and patient age to bone mechanical properties. In 1993, Oxnard reported slight visible microarchitectural changes from the Fourier transform on bone radiographic images but no parameter calculation was performed [22]. The same group worked on vertebral bodies T1 to L5 in seven male columns and applied the FFT to the radiographic images of these vertebrae. They characterized the orientation and size of the architectural elements of vertebral cancellous bone, and underline the potential of this technique to define the effects of ageing [23]. Wigderowitz et al. consid-ered the properties of Fast Fourier Transform (FFT) to evaluate trabecular bone structure: the directional pattern of frequencies with high-magnitude can identify the ori-entation of trabeculae. He defined three indices including spectral trabecular index, longitudinal and transversal trabecular indices [24]. These indices approximate the evaluation of the trabecular structure in terms of trabecu-lae spacing and orientation. Wigderowitz et al. concluded that this quantification detects structural changes occur-ring with age and may be useful in osteoporosis studies [24]. Caligiuri et al. [25] also used the FFT to perform a structural analysis of the spine trabecular bone. The hypothesis was that the magnitude and the first moment of the power spectrum could correspond to the coarseness or the fineness of the texture pattern. The two texture measurements were compared to BMD. Caligiuri et al. concluded that this texture analysis might lead to a better prediction of the osteoporotic fracture risk [25]. Recently, Gregory et al. have proposed a FFT-based analysis of trabecular bone structure on hip radiographs from patients with and without hip fracture. They worked on FFT profiles parallel and perpendicular to the preferred orientation. Principal conponents analysis was used to generate scores from the profiles and was able to discrim-inate fracture and control groups better than fractal dimension [26].
Our research group has previously experienced fractal analysis on bone radiographs [27-29]. The measured parameter (Hurst coefficient) offers a global evaluation of
the image irregularity, of its complexity. It is considered as an indicator of roughness. The Maximum Likelihood Esti-mator is applied first on one direction, then the process is repeated in 36 directions by 10 degrees steps. The direc-tional results can be expressed on a polar diagram that can be itself be fitted to an ellipse; the shape of this polar dia-gram can be characterized in order to determine the tex-tural anisotropy [30,31]. When comparing radius and calcaneus in the same subjects, Lespessailles et al. have shown significant differences [31] but the interpretation is equivocal because this technique characterizes the varia-tions of grey level roughness following direcvaria-tions, and not directly the trabecular network orientation.
The osteoporotic fracture risk prediction is important especially in postmenopausal women. BMD is currently measured in clinical practice and textural parameters can be assessed on trabecular bone radiographs [19-22,24,25,31], but the anisotropy was not clearly quanti-fied in these texture analyses. To address this question, we have worked on a quantitative evaluation of anisotropy on bone radiographs. The development of a structural parameter such as DA from radiographs is very promising; this parameter could be complementary of the BMD and of fractal texture parameters in the explanation of bone strength.
We describe here a new quantitative method based on the FFT to obtain anisotropy indices on bone radiographs of the calcaneus and a validation on synthetic images. The intra and inter-observer reproducibility and a pilot clini-cal study comparing osteoporotic fracture cases to control cases are presented.
Methods
Population of the pilot study
Postmenopausal women were recruited from a cross-sec-tional unicenter case control study. The protocol screened 400 women: 349 were enrolled. The inclusion and exclu-sion criteria have been previously described in details [28]. For this preliminary study, a sample of 22 oste-oporotic fracture cases was randomly selected, and was secondarily age-matched with 44 control cases (for each age, we randomly selected two control cases with an equal age ± 5 years). The distribution of fracture cases was 1 hip fracture, 5 wrist fractures, 11 vertebral fractures and 5 met-atarsus fractures, all these fractures were considered as low energy fractures. The ages of the control and fracture cases ranged from 45 to 87 years. The mean age was 69.2 ± 11.9 years for fracture cases and the mean age was 69.0 ± 11.7 years for control cases.
The BMD was measured by dual energy x-ray absorptiom-etry (Hologic® 4500 device) at lumbar spine and femoral
neck. The mean lumbar spine BMD was respectively 0.814
± 0.09 g.cm-2 and 0.895 ± 0.16 g.cm-2 (p < 0.05) for
frac-ture cases and control cases. The mean femoral neck BMD was respectively 0.650 ± 0.09 g.cm-2 and 0.686 ± 0.12
g.cm-2 (ns) for the fracture cases and control cases.
Study design
Image realization
This study was performed on trabecular bone graphic images of the calcaneus. The calcaneus radio-graphic images were performed following a standardized procedure reported elsewhere [27]. Briefly, the X-ray tube voltage (48 kV), the exposure conditions (18 mAs) and the focal-calcaneus distance (1 meter) were fixed for all patients. Kodak single emulsion Min RG films were used and all developed by the same film processor at fixed developer and fixer temperatures.
In order to obtain digitized images of the calcaneus trabecular bone, the radiographic films were digitized with an AGFA Duoscan scanner (AGFA GEVAERT N.V., Morstel, Belgium) with 256 gray-levels. Calcaneus is known to be a heterogeneous site of trabecular bone [32]. For this reason we have selected a large region of interest (ROI) of 2.7 × 2.7 cm2 (256 × 256 pixels with a pixel size
of 105 µm). The ROI of 256 × 256 pixels (Figure 1) was defined from anatomic marks [27]. The basis of the ROI was positioned on a line linking the plantar aponeurosis insertion to the superior end of the Achilles tendon inser-tion, the ROI comprising both compressive and tensile trabecular network [10].
Noise filtering
The low frequency noise of an image corresponds to the gray-value variations over large distances, due to the radi-ological artifacts and to the fat tissues projections on the radiograph. In order to remove the low frequency noise and to take into account only trabecular components of the image, we used a convolution filter previously described by Geraets [33]. A kernel box was used; for each pixel, the average gray-value of the box was allocated to the box middle pixel. The new image obtained is the low-frequency image. The window must be small enough to extract the low frequency noise and large enough to pre-vent the trabecular pattern leaking into the low frequency region. For our images, the optimal size of the box was 25 × 25 pixels. The filtered image was obtained by subtract-ing the low-frequency image from the original images, this filter also removed cross of high intensity centered on the central pixel due to the finite bondaries of the ROI.
Fourier transform
The Fourier transform represents a signal in spatial fre-quency space. An image can be considered as a repartition of bright intensities in a (xOy) plane and can be expressed as a two-dimensional function f(x, y). The Fourier
transform is expressed by a function F(µ,υ) with the two variables µ and υ corresponding to spatial frequencies in (µ Oυ) plane. The 2D Fourier transform spectrum of an image is expressed by the following formula:
where µ, υ and x, y are the respective variables of the fre-quency and the spatial domains and N the size of the image.
Any periodic structure in the original spatial-domain image is represented by peaks in the frequency-domain image at a distance corresponding to the period and a direction at right angle of the original orientation. If a mild degree of disorientation is introduced in an oriented periodic structure, the frequencies of the Fast Fourier transform (FFT) spectrum are spread over an angle corre-sponding to the deviation of the structure in the original image. By analogy, we hypothesized that the periodic structure is represented by trabeculae projection, and the degree of disorientation by anisotropy.
The magnitude of the transform corresponds to:
Radiographic image of the calcaneus showing the localization of the Region of Interest (ROI)
Figure 1
Radiographic image of the calcaneus showing the localization of the Region of Interest (ROI). Inside the ROI, longitudinal trabeculae correspond to the compressive trabecular network extended from the subtalar joint and the transverse to the ten-sile trabecular network sweeping backwards and upwards the great tuberosity. Arrows show anatomical landmarks corre-sponding to the bottom of the ROI.
F N f x y e i x N y N x N N y N N ( , )µ υ = ( , )− π µ υ( + ) ( ) =− − =− −
∑
∑
1 2 2 2 2 1 2 2 1 1 F( , )µ υ = (Re( ( , )))Fµ υ 2+(Im( ( , )))Fµ υ 2 ( )2where Re = real part of the FFT and Im = the imaginary part of FFT.
The FFT was calculated on the gray level filtered images of the trabecular bone using the Visilog 5.1 software (Noe-sis). Then the magnitudes of the frequency images were divided to the total magnitude of the transform to nor-malize the contrast in the images according to the follow-ing formula:
Measurements on FFT spectrum
Trabecular bone was assimilated to an oriented structure with two main directions, the ROI including longitudinal and transversal trabeculae (Figure 1). All the FFT spectra of the calcaneus radiographs involved horizontal and verti-cal conponents (Figures 2 and 3). The horizontal compo-nents were indicative of the longitudinal trabeculae fabric and the vertical components were indicative of the
trans-verse trabeculae fabric. We have to notice that the so-called horizontal and vertebral trabeculae were so described on the ROI, which was slightly rotated by com-parison to the original image. The limit between high energy area representing trabeculae and low energy area corresponding to the noise on the FFT spectrum were vis-ually determined by the operator. We measured the spreading angles of the longitudinal and the transversal trabeculae named respectively the Dispersion Longitudi-nal Index (DLI) and the Dispersion Transverse Index (DTI). In order to obtain an average value, the DTI and DLI parameters were measured in the two symmetrical parts of the FFT spectrum conponents (Figures 2b and 3b).
An index relative to the trabecular fabric or degree of ani-sotropy was derived from the measured parameters DLI and DTI. The Degree of Anisotropy (DA) was defined as:
Control case
Figure 2
Control case a: ROI of the digitized radiographicimage of calcaneus trabecular bone. b: FFT spectrum A: corresponds to longi-tudinal trabeculae B: corresponds to transverse trabeculae DLI: Dispersion Longilongi-tudinal Index, spreading angle of the longitu-dinal trabeculae DTI: Dispersion Transverse Index, spreading angle of the transverse trabeculae
3250 µm
A
B
a
DLI longitudinal trabeculae transverse trabeculae DTI DLI DLI longitudinal trabeculae transverse trabeculae DTI DLI DLI longitudinal trabeculae transverse trabeculae DTI DLIb
DA=1.4
F F d d x N N y N N ( , ) ( , ) , µ υ µ υ µ υ =− − =− −∑
∑
( )
2 2 1 2 2 2 1 3 DA DLI DTI = +( )
180 ( ) 4For a perfectly isotropic structure, the FFT spectrum has a disc shape and DA is equal to unity. More isotropic trabec-ular bone structures will have DA values closer to unity. Figures 2 and 3 illustrate two examples of digitized radio-graphic images and FFT spectra of trabecular bone at cal-caneus. Figure 2 corresponds to a control case and Figure 3 to a vertebral fracture case.
Synthetic images
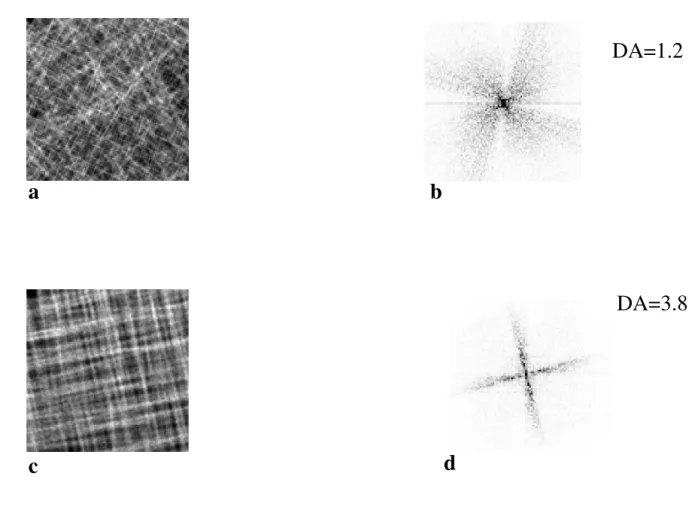
To test the reliability of DA assessment, we tested this method on projected volume with known disorienta-tions. We synthesized 6 series of 8 images composed of beam like structures more or less aligned following two directions in order to obtain structures close to trabecular bone of calcaneus. For the less anisotropic structure, horizontal and vertical disorientations varied from 0 to 80° (Figure 4a), and for the most anisotropic structure, the disorientation of the beam like structures varied from 0 to 17° (Figure 4c). These synthetic images comprised a wide variety of structures, from anisotropic to almost iso-tropic, a variety much wider than expected in the clinical X-rays. The projections of these volumes were analyzed with the same software as bone radiographs.
Data analysis
Intra and inter-observer reproducibility of the measurements
The two measured parameters DLI and DTI and the derived parameter DA were determined to calculate the intra and inter-observer reproducibility. To determine the intra-observer reproducibility, a single observer per-formed two sets of measurements on the FFT spectra of 20 subjects with a one day interval between each set. To determine the inter-observer reproducibility, two sets of measurements were performed on the FFT spectra of 20 subjects by two observers. The observers were blinded for each sets of measurements.
The intra-observer and inter-observer reproducibilities were calculated for n subjects with the root mean square RMS average according to the following formula [34]:
where SDj is the standard deviation for the subject j and is the average of the measurements for the subject j.
Vertebral fracture case
Figure 3
Vertebral fracture case a Region of Interest (ROI) of the digitized radiographic image of calcaneus trabecular bone. b FFT spec-trum DLI : Dispersion Longitudinal Index, spreading angle of the longitudinal trabeculae DTI : Dispersion Transverse Index, spreading angle of the transverse trabeculae
3250 µm
a
DTI DLI longitudinal trabeculae transverse trabeculaeDA= 1.7
b
RMSCV n SD x j j j n (%)= *( )
=∑
1 100 2 2 1 5 xjClinical evaluation
Results in these two groups were compared using Stu-dent's t-test for comparisons of the means after checking Gaussian distribution. The area under ROC curves was calculated for BMD measurements and DA.
Results
The results of synthetic images are represented on Table 1. The DA varied from 1.3 to.3.6, respectively corresponding from more anisotropic (Figures 4a and 4b) to almost iso-tropic structures (Figures 4c and 4d).
Table 2 shows the intra-observer and inter-observer RMSCVs. The RMSCVs of DA were respectively 1.5% and 3.1 %
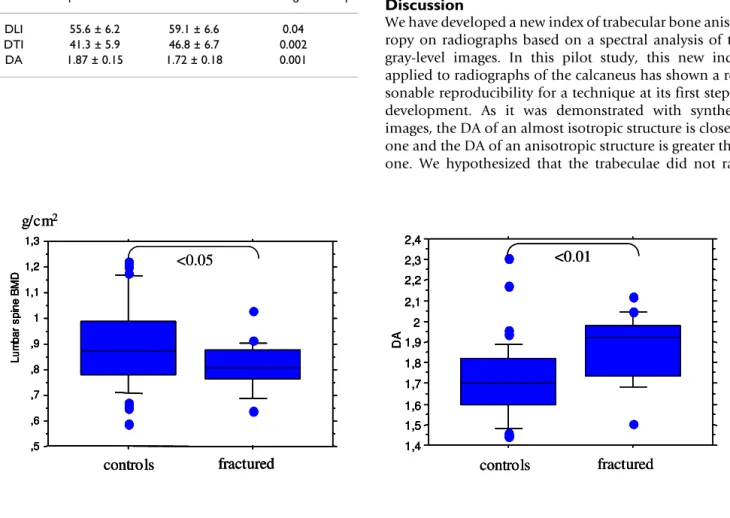
Table 3 presents the results of the fabric indices obtained on the 22 osteoporotic fracture cases and 44 control cases. Results of DLI and DTI were statistically significant lower in osteoporotic cases (p < 0.01, p < 0.05, respectively) leading to a significantly higher DA.
Synthetic images
Figure 4
Synthetic images a: Synthetic image of astructure with orientations between 0 and 80° in 3 dimensional space b: Fast Fourier Transform (FFT) spectrum of the image 4a c: Synthetic image of a structure with orientations between 0 and 17° in 3 dimen-sional space d: FFT spectrum of the image 4c
DA=3.8
DA=1.2
a
b
c
d
Table 1: DA assessment on synthetic images composed of cylinders more or less aligned following two directions leading to isotropic and anisotropic structures.
Synthetic images
Angles 0–80° 0–69° 0–52° 0–40° 0–28° 0–17° DA 1.3 1.3 1.8 1.9 2.5 3.8
In control cases DA was closer to 1 due to a large spread-ing of frequencies in the FFT spectra while DA was higher in osteoporotic cases in relation to a narrower frequency spreading. Comparing the DA values from Table 3 to Table 1, it appears that the controls (DA = 1.7) were in the 0–55° category and the fractures cases (DA = 1.9) were in the 0–45° category. The difference of the mean of DA between cases and controls was 8.7 % and close to the fig-ured variation corresponding to the 95% confidence interval of the measurements [35]. Differences in DA determined by spectral analysis (p < 0.01) and lumbar spine BMD (p < 0.05) were significant (Figure 5). Whereas the difference between fracture cases and controls for femoral neck BMD was not significant. From the ROC analysis, the Area Under Curve (AUC) were respectively 0.65, 0.62, 0.64, 0.77 for lumbar spine BMD, femoral neck BMD, total femoral BMD and DA. There is a trend to higher AUC for DA comparatively to BMD meas-urements, but according to the small size of the popula-tion the statistical significance was not reached.
Discussion
We have developed a new index of trabecular bone anisot-ropy on radiographs based on a spectral analysis of the gray-level images. In this pilot study, this new index applied to radiographs of the calcaneus has shown a rea-sonable reproducibility for a technique at its first step of development. As it was demonstrated with synthetic images, the DA of an almost isotropic structure is close to one and the DA of an anisotropic structure is greater than one. We hypothesized that the trabeculae did not ran-Table 2: Root Mean Square Standard Deviation Coefficient
Variation RMSCV(%) for measured indices DLI and DTI and the degree of anisotropy. Intra-observer reproducibility Inter-observer reproducibility CV(%) CV(%) Measured parameter DLI 2.4 3.4 DTI 2.4 4.1 Calculated parameter DA 1.5 3.1
DLI: Dispersion Longitudinal Index DTI: Dispersion Transversal Index DA: Degree of Anisotropy
Table 3: Fabric indices (mean ± SD) from the fabric parameters in osteoporotic fracture cases and control cases.
Osteoporotic fractures Controls Statistical significance p DLI 55.6 ± 6.2 59.1 ± 6.6 0.04 DTI 41.3 ± 5.9 46.8 ± 6.7 0.002 DA 1.87 ± 0.15 1.72 ± 0.18 0.001
1 96 2. ×CV%=8 6.
Box plots of lumbar spine BMD and DA
Figure 5
Box plots of lumbar spine BMD and DA. A T-test was used to compare controls and fractured patients.
,5 ,6 ,7 ,8 ,9 1 1,1 1,2 1,3 Lu m b a r s p in e B MD controls fractured g/cm2 <0.05 ,5 ,6 ,7 ,8 ,9 1 1,1 1,2 1,3 Lu m b a r s p in e B MD controls fractured g/cm2 ,5 ,6 ,7 ,8 ,9 1 1,1 1,2 1,3 Lu m b a r s p in e B MD controls fractured ,5 ,6 ,7 ,8 ,9 1 1,1 1,2 1,3 Lu m b a r s p in e B MD ,5 ,6 ,7 ,8 ,9 1 1,1 1,2 1,3 Lu m b a r s p in e B MD controls fractured g/cm2 <0.05 1,4 1,5 1,6 1,7 1,8 1,9 2 2,1 2,2 2,3 2,4 DA controls fractured <0.01 1,4 1,5 1,6 1,7 1,8 1,9 2 2,1 2,2 2,3 2,4 DA controls fractured 1,4 1,5 1,6 1,7 1,8 1,9 2 2,1 2,2 2,3 2,4 DA 1,4 1,5 1,6 1,7 1,8 1,9 2 2,1 2,2 2,3 2,4 DA controls fractured <0.01 <0.01
domly disappear, the effect might be a reduction of fre-quencies on the FFT spectra in preferential directions leading to an increase of anisotropy. The results of this pilot study involving 22 osteoporotic fracture cases and 44 controls suggest that the DA parameter may be poten-tially useful to distinguish fracture cases from control cases.
The main interest of this technique is that it can be applied directly to gray level radiographic images without previ-ous binarization. The radiographic technique provides a projection image. However a good 2D-3D correlation has been described concerning microarchitecture [29] and anisotropy [18] from gray level analysis.
The significantly higher DLI and DTI in control cases sug-gest that there are more various orientations of the elemental structures around the two main orientations (longitudinal and transversal) in control cases than in osteoporosis cases with vertebral fractures. The larger range of orientations in controls corresponds to a lesser anisotropic structure than in osteoporosis. DTI was the best discriminant parameter between fracture patients and control cases but also the less reproducible. There are only few transversal trabeculae comparatively to longitudinal ones and they disappear first with osteoporosis due to a less contribution in bone strength. The difference between fracture cases and controls was close to errors attributed to the intra or inter-observer reproducibility. The intra-observer reproducibility is close to the 1 to 2% of repro-ducibility found in usual bone densitometry method as dual x-ray absorptiometry [37]. The poor inter-observer reproducibility is due to the difficulty to identify the limit between high energy area of the spectrum (corresponding to trabeculae) and low energy area (corresponding to noise) in relation to the few numbers of trabeculae projec-tions. Since the population size is small, further studies are required with larger groups. We could expect more stringent results with a more homogenous population of fractured patients with vertebral fracture, for instance. The higher anisotropy found in osteoporosis cases is in accordance with the findings of Newitt et al. [38] who report that the increase of bone resorption in osteoporosis leads to a loss of thinner trabeculae first, resulting in an increase of anisotropy. The study of Newitt et al. was per-formed with the MIL method on 3D magnetic resonance images at the radius. The MIL method is widely used to determine the trabecular 3D structure anisotropy but some authors [39,40] discuss its reliability since it reflects the boundary orientation rather than the real anisotropy of the structural elements.
This concept of transversal and longitudinal systems of trabeculae must be cautiously interpreted in our study.
Indeed the ROI on the calcaneus radiographic images is tilted around 45 degrees (Figure 1). The trabeculae were named longitudinal and transversal in reference to the radiographic image (Figure 1) and not to the ROI orienta-tion (Figures 2a and 3a). Longitudinal trabeculae corre-spond to the compressive trabecular network extended from the subtalar joint and the transverse to the tensile trabecular network sweeping backwards and upwards the great tuberosity [41].
The anisotropy of trabecular bone is different according to the skeletal sites: in a study comparing the properties of calcaneus, distal femur, proximal femur and vertebrae on human specimens, Majumdar et al. [17] found the highest anisotropy of trabecular bone at the calcaneus followed by distal femur and proximal femur, vertebrae constitut-ing the least anisotropic site.
Our results corroborate the studies of Geraets et al. [33] on hip and radius, Wigderowitz et al. [24] on wrist radiographs, Mosekilde et al. [42] on vertebrae and Ciarelli et al. [43] on femoral head samples. The Line Frac-tion DeviaFrac-tion was developed by Geraets on binarized radiographic images, and leads to the determination of the preferential orientations. There was no calculation of an anisotropy index but it was possible to quantify the anisotropy from the deviation of polar diagram from a circle.
The lower values of the Line Fraction Deviation index found in osteoporotic subjects were consistent with the early loss of the secondary compressive trabecular group of the hip [44]. Moreover, Geraets et al. showed in a study of the distal radius that the Line Fraction Deviation values decreased along the transversal direction with age whereas the orientation along the axial direction remains stable during the entire life [33]. Wigderowitz et al. [24] found using the spectral analysis at the distal radius that the transversal trabeculae are preferentially absorbed, thinned and spared with age. Mosekilde et al. in vertebrae [42] showed that compressive strength was greater in the verti-cal direction than in the transversal direction. This anisotropy in vertebral strength increased with age and indicated according to the authors that the transverse trabeculae were selectively removed. Buck et al. have found that the oblique conponents declined in the cranio-caudal direction particularly for age superior to 60 years leading to variation in anisotropy [23]. Ciarelli et al. [43] also found that fracture cases have proportionally more trabeculae aligned along the primary load axis (and thus proportionally fewer transverse trabeculae) than control cases; the authors hypothesized that the loss of transverse trabeculae leads to the difference in anisotropy between groups. Zhao et al. characterized iliac trabecular bone by micro-QCT and showed that trabeculae thinning led to a
more isotropic structure in the first postmenopausal years whereas the structure became more anisotropic in the later years [45]. They hypothesized that, in the later years, the remaining trabeculae would be more widely sepa-rated, less connected and some more thickened leading to an increase of anisotropy.
It has been well established that the calcaneus structure is heterogeneous [32,46]. Lin et al. [32] have studied the cal-caneus microarchitecture on MRI images. They analyzed 20 to 25 ROIs 1 × 1 cm2 in each calcaneus. They found a
spatial heterogeneity in the posterior region of 40 %. In our study the ROI was 2.7 × 2.7 cm2 and represented a
much larger area; it was accurately defined by anatomic marks, this point avoiding large variation in fractal analysis [27]. Furthermore our ROI contained both trans-versal and longitudinal trabeculae, if transtrans-versal trabecu-lae disappeared, it should be possible to calculate DA and a high value will be obtained. As the DLI and DTI meas-urements were not yet automated, the parameters were measured in the two symmetrical parts of the FFT spec-trum in order to obtain an average value. In a near future the automation of our method could be performed, allowing applications to large sets of images. In spite of this lack of automatization the reproducibility of the DA parameter was acceptable and allowed for the accurate characterization of osteoporosis changes in small series. At this first step of development, this clinical study must be considered as a preliminary study evaluating the poten-tial of this anisotropy evaluation.
Conclusion
This study has shown that the DA can be determined on plain radiographs using spectral analysis. The reproduci-bility of the DA values may be improved by automating the method. The distinction between fracture cases and control cases is very promising, but further studies are nec-essary to know if the DA evaluation could improve the osteoporotic fracture risk determination when combined with BMD and other textural parameters such as fractal analysis.
Competing interests
The author(s) declare that they have no competing interests.
Authors' contributions
BBI participated in the design of the study, carried out the measurements and the manuscript preparation, G L car-ried out measurements of reproducibility and synthetic images, CC performed statistical analysis and participated to the manuscript preparation, R H supervised the appli-cation of the Fourier Transform and CLB carried out the design of the study and supervised the manuscript preparation.
References
1. Sugita H, Oka M, Toguchida J, Nakamura T, Ueo T, Hayami T:
Ani-sotropy of osteoporotic cancellous bone. Bone 1999, 24:513-16.
2. Frost HM: The mechanostat: a proposal pathogenic
mecha-nism of osteoporosis and the bone mass effects of mechani-cal and nonmechanimechani-cal agents. Bone Miner 1987, 2:73-85.
3. Aspden RM, Hukins DWL: Determination of the direction of
preferrred orientation and the orientation distribution func-tion of collagen fibrils in connective tissues from high X-ray diffraction patterns. J of Applied Crystallography 1979, 12:306-311.
4. Kirky MC, Aspden RM, Hukins DWL: Determination of the
ori-entation distribution function for collagen fibrils in a connec-tive tissu site from a high angle X-ray diffraction pattern. J of
Applied Crystallography 1988, 21:929-934.
5. Wilkinson S, Hukins DWL: Automatic determination of
diffuse-peak positions and the centre of a diffraction pattern. J of
Applied Crystallography 1999, 32:332-335.
6. Jaschouz D, Paris O, Roschger P, Hwang HS, Fratzl P: Pole figure
analysis of mineral nanoparticle orientation in individual trabecula of human vertebral bone. J of Applied Crystallography
2003, 36:494-498.
7. Redon C, Chermant L, Chermant J, Coster M: Assessment of fibre
orientation in reinforced concrete using Fourier image transform. J Microsc 1998, 191:258-265.
8. Defossez H, Hall RM, Walker PG, Wroblewski BM, Siney PD, Purbach B: Determination of the trabecular bone direction from
dig-itised radiographs. Med Eng Phys 2003, 25:719-29.
9. Singh M, Nagrath AR, Maini PS: Changes in trabecular pattern of
the upper end of the femur as an index of osteoporosis. J Bone
Joint Surg Am 1970, 52:457-67.
10. Aggarwal ND, Singh GD, Aggarwal R, Kaur RP, Thapar SP: A survey
of osteoporosis using the calcaneum as an index. Int Orthop
1986, 10:147-53.
11. Whitehouse WJ: The quantitative morphology of anisotropic
trabecular bone. J Microscopy 1974, 101:153-68.
12. Geraets WG: Comparison of two methods for measuring
orientation. Bone 1998, 23:383-8.
13. Harrigan TP, Mann RW: Characterization of microstructural
anisotropy in orthotropic materials using a second rank tensor. J Mater Sci 1984, 19:761-67.
14. Goulet RW, Goldstein SA, Ciarelli MJ, Kuhn JL, Brown MB, Feldkamp LA: The relationship between the structural and orthogonal
compressive properties of trabecular bone. J Biomechanics
1994, 27:375-89.
15. Rüegsegger P, Koller B, Müller R: A microtomographic system
for the nondestructive evaluation of bone architecture. Calcif
Tissue Int 58:24-29.
16. Fajardo RJ, Muller R: Three-dimensional analysis of nonhuman
primate trabecular architecture using micro-computed tomography. Am J Phys Anthropology 2001, 115:327-36.
17. Majumdar S, Kothari M, Augat P, Newitt DC, Lin JC, Lang T, Lu Y, Genant HK: High-resolution magnetic resonance imaging:
three-dimensional bone architecture and biomechanical properties. Bone 1998, 22:445-54.
18. Luo G, Kinney JH, Kaufman JJ, Haupt D, Chiabrera A, Siffert RS:
Rela-tionship between plain radiographic patterns and three-dimensional trabecular architecture in the human calcaneus. Osteoporosis Int 1999, 9:339-45.
19. Caldwell CB, Willett K, Cuncins AV, Hearn TC: Characterization
of vertebral strength using digital radiographic analysis of bone structure. Med Phys 1995, 22:611-15.
20. Geraets WG, Van der Stelt PF, Lips P, Elders PJM, Van Ginkel FC, Burger EH: Orientation of the trabecular pattern of the distal
radius around the menopause. J Biomechanics 1997, 30:363-70.
21. Jiang C, Giger ML, Chinander MR, Martell JM, Kwak S, Favus MJ:
Characterization of bone quality using computer-extracted radiographic features. Med Phys 1999, 26:872-9.
22. Oxnard CE: Bone and bones, architecture and stress, fossils
and osteoporosis. J Biomechanics 1993, 26:63-79.
23. Buck AM, Price RI, Sweetman IM, Oxnard CE: An investigation of
thoracic and lumbar cancellous vertebral architecture using power-spectral analysis of plain radiographs. J Anat 2002, 200:445-56.
Publish with BioMed Central and every scientist can read your work free of charge "BioMed Central will be the most significant development for disseminating the results of biomedical researc h in our lifetime."
Sir Paul Nurse, Cancer Research UK
Your research papers will be:
available free of charge to the entire biomedical community peer reviewed and published immediately upon acceptance cited in PubMed and archived on PubMed Central yours — you keep the copyright
Submit your manuscript here:
http://www.biomedcentral.com/info/publishing_adv.asp
BioMedcentral
24. Wigderowitz CA, Abel EW, Rowley DI: Evaluation of cancellous
structure in the distal radius using spectral analysis. Clin
Orthop Related Res 1997, 335:152-61.
25. Caligiuri P, Giger ML, Favus MJ, Hong J, Doi K, Dixon LB:
Compu-terized radiographic analysis of osteoporosis : preliminary evaluation. Radiology 1993, 186:471-474.
26. Gregory JS, Stewart A, Undrill PE, Reid DM, Aspden RM:
Identifica-tion of hip fracture patients from radiographs using Fourier analysis of the trabecular structure: a cross-sectional study.
BMC Med Imaging 2004, 4:4.
27. Benhamou CL, Lespessailles E, Jacquet G, Harba R, Jennane R, Lous-sot T, Tourliere D, Ohley W: Fractal organization of trabecular
bone images on calcaneus radiographs. J Bone Miner Res 1994, 9:1909-18.
28. Benhamou CL, Poupon S, Lespessailles E, Loiseau S, Jennane R, Siroux V, Ohley W, Pothuaud L: Fractal analysis of radiographic
trabecular bone texture and bone mineral density: two com-plementary parameters related to osteoporotic fractures. J
Bone Miner Res 2001, 6:697-704.
29. Pothuaud L, Lespessailles E, Harba R, Jennane R, Royant V, Eynard E, Benhamou CL: Fractal analysis of trabecular bone texture on
radiographs: discriminant value in postmenopausal osteoporosis. Osteoporosis Int 1998, 8:618-25.
30. Jiang C, Pitt RE, Bertram JEA, Aneshansley DJ: Fractal-based image
texture analysis of trabecular bone architecture. Med Bio
Engi-neer Computing 1999, 37:413-18.
31. Lespessailles E, Jacquet G, Harba R, Jennane R, Loussot T, Viala JF, Benhamou CL: Anisotropy measurement obtained by fractal
analysis of trabecular bone at the calcaneus and radius. Rev
Rhum [Eng. Ed.] 1996, 63:337-43.
32. Lin JC, Amling M, Newitt DC, Selby K, Srivastav SK, Delling G, Genant HK, Majumdar S: Heterogeneity of trabecular bone structure
in the calcaneus using magnetic resonance imaging.
Oste-oporosis Int 1998, 8:16-24.
33. Geraets WGM, Van der Stelt PF, Netelenbos CJ, Elders PJM: A new
method for automatic recognition of the radiographic trabecular pattern. J Bone Miner Res 1990, 5:227-33.
34. Glüer C, Blake G, Lu Y, Blunt BA, Jergas M, Genant HK: Accurate
assessment of precision errors: how to measure the repro-ducibility of bone densitometry techniques. Osteoporosis Int
1995, 5:262-70.
35. Rosner B, Willett WC, Spiegelman D: Correction of logistic
regression relative risk estimates and confidence intervals for systematic within-person measurement error. Stat Med
1989, 8:1051-69.
36. Pothuaud L, Benhamou CL, Porion P, Lespessailles E, Harba R, Levitz P: Fractal dimension of trabecular bone projection texture is
related to three-dimensional microarchitecture. J Bone Miner
Res 2000, 15:691-99.
37. Genant HK, Engelke K, Fuerst T, Gluer CC, Grampp S, Harris ST, Jer-gas M, Lang T, Lu Y, Majumdar S, Mathur A, Takada M: Noninvasive
assessment of bone mineral and structure: state of the art. J
Bone Miner Res 1996, 11:707-30.
38. Newitt DC, Majumdar S, Van Rietbergen B, Von Ingersleben G, Harris ST, Genant HK, Chesnut C, Garnero P, Mc Donald B: In vivo
assess-ment of architecture and micro-finite eleassess-ment analysis derived indices of mechanical properties of trabecular bone in the radius. Osteoporosis Int 2002, 131:6-17.
39. Odgaard A, Jensen EB, Gundersen JG: Estimation of structural
anisotropy based on volume orientation. A new concept. J
Microscopy 1990, 157:149-62.
40. Cruz-Orive LM, Karlsson LM, Larsen SE, Wainschtein F:
Character-izing anisotropy : a new concept. Micron and Microscopica Acta
1992, 23:75-76.
41. Jhamaria NL, Lal KB, Udawat M, Banerji P, Kabra SG: The
trabecu-lar pattern of the calcaneum as an index of osteoporosis. J of
Bone and Joint Surgery 1983, 65:195-98.
42. Mosekilde L, Viidik A, Mosekilde L: Correlation between the
compressive strength of iliac and vertebral trabecular bone in normal individuals. Bone 1985, 6:291-95.
43. Ciarelli TE, Fyrie DP, Schaffler MB, Goldstein SA: Variations in
three-dimensional cancellous bone architecture of the prox-imal femur in female hip fractures and in controls. J Bone
Miner Res 2000, 15:32-40.
44. Geraets WG, Van der Stelt PF, Lips P, Van Ginkel FC: The
radio-graphic trabecular pattern of hips in patients with hip frac-tures and in elderly control subjects. Bone 1998, 22:165-73.
45. Zhao J, Jiang Y, Recker RR, Draper mW, Genant HKI: liac
three-dimensional trabecular microarchitecture in premenopau-sal healthy women and postmenopaupremenopau-sal osteoporotic women with and without fracture. J Bone Miner Res 2001, 17:S468.
46. Laugier P, Fournier B, Berger G: Ultrasound parametric imaging
of the calcaneus: in vivo results with a new device. Calcif Tissue
Int 1996, 58:326-31.
Pre-publication history
The pre-publication history for this paper can be accessed here: