Publisher’s version / Version de l'éditeur:
Technical Note (National Research Council of Canada. Division of Building Research), 1965-02-01
READ THESE TERMS AND CONDITIONS CAREFULLY BEFORE USING THIS WEBSITE.
https://nrc-publications.canada.ca/eng/copyright
Vous avez des questions? Nous pouvons vous aider. Pour communiquer directement avec un auteur, consultez la
première page de la revue dans laquelle son article a été publié afin de trouver ses coordonnées. Si vous n’arrivez pas à les repérer, communiquez avec nous à PublicationsArchive-ArchivesPublications@nrc-cnrc.gc.ca.
Questions? Contact the NRC Publications Archive team at
PublicationsArchive-ArchivesPublications@nrc-cnrc.gc.ca. If you wish to email the authors directly, please see the first page of the publication for their contact information.
NRC Publications Archive
Archives des publications du CNRC
For the publisher’s version, please access the DOI link below./ Pour consulter la version de l’éditeur, utilisez le lien DOI ci-dessous.
https://doi.org/10.4224/20354459
Access and use of this website and the material on it are subject to the Terms and Conditions set forth at
Calculation of Motor Vehicle Noise Alongside Level and Depressed
Roadways
Northwood, T. D.; Olynyk, D.
https://publications-cnrc.canada.ca/fra/droits
L’accès à ce site Web et l’utilisation de son contenu sont assujettis aux conditions présentées dans le site LISEZ CES CONDITIONS ATTENTIVEMENT AVANT D’UTILISER CE SITE WEB.
NRC Publications Record / Notice d'Archives des publications de CNRC:
https://nrc-publications.canada.ca/eng/view/object/?id=7116977e-0bb6-45af-b36e-0c8fec5505e6 https://publications-cnrc.canada.ca/fra/voir/objet/?id=7116977e-0bb6-45af-b36e-0c8fec5505e6
Vehicle Noise BACKGROUND INFORMATION
セ
セi
APPROVED BY NBH DATE - February 1965NOTlE
CHECKED BY RESTRICTED CIRCULATIONDIVISION OF BUILDING RESEARCH
'f
E
C
JH[
N II CAlL
Inquiry Reply
CA'LCULATION OF MOTOR:-, VEHICLE- NOrSE ALONGSIDE .LEVE-L AND DEPRESSED ROADWAYS
This report is a study of the probable intensity of traffic noise for two highway cross-sections of the depressed type as com-pared with existing city thoroughfares. Truck and passenger car noise data were used to calculate the "noisiness" of free flowing traffic on these types of roadways. The objective of the study was to determine the change in noise conditions that may result when an existing city th;oroughfare is modified by the addition of a depressed-level through highway.
Of the many published reference s to motor vehicle noise, the one used here is the recent study by Galloway and Clark 1, on the noise of individual vehicles as a function of speed. Large samples were taken of vehicles of various ages, manufacturer, models, etc. Three general relations are given: one for passenger cars on an almost level highway, a second for large trucks on an almost level highway, and a third for trucks climbing a grade of approximately 5 per cent. The findings on passenger cars indicated that their noise output at a given speed was relatively independent of whether or not they were climbing a grade. Octave band analysis of the data for the three vehicle classes yielded average spectra for each vehicle class. The above data were then fitted to obtain "per-ceived noise level" as a function of speed for each of the vehicle classes. The perceived noise level (expressed in PN -dB) is a
SUBJECT
PREPARED BY T. D. Northwood and D. Olynyk
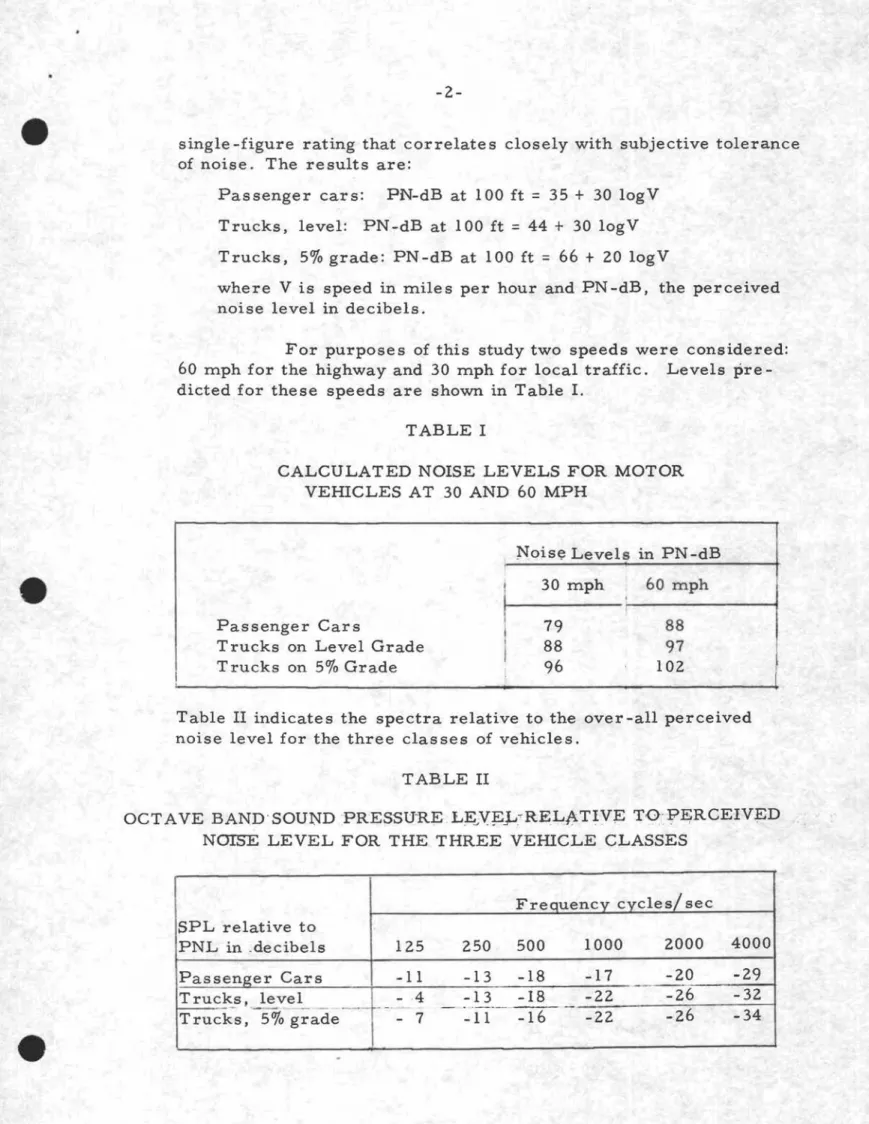
-2-TABLE I -29 -32 -34 -20 セMMMMQ -26 -26 2000 4000 88 97 102 60 mph cles/ sec 1000 79 88 96 30 mph Fre 250 500 -11 -13 -18 -17 - 4 -13 -18 ⦅ZZBZZGMMMセMMMMMMQ-22 - 7 - セゥャᄋMM
-=T6 -
-22 125 Passenger CarsTrucks on Level Grade Trucks on 5% Grade
Passen er Cars Trucks, level Truck-s, 5% grade
nッゥウセ Levels in PN -dB
CALCULATED NOISE LEVELS FOR MOTOR VEHICLES AT 30 AND 60 MPH
TABLE II
Passenger cars: PN-dB at 100 ft = 35
+
30 logV Trucks, level: PN -dB at 100 ft = 44+
30 logY Trucks, 5% grade: PN-dB at 100 ft=
66 + 20 logVwhere V is speed in miles per hour and PN -dB, the perceived noise level in decibels.
single -figure rating that correlate s closely with subjective tolerance of noise. The results are:
SPL relative to PNL in .decibels
For purposes of this study two speeds were considered: 60 mph for the highway and 30 mph for local traffic. Levels pre-dieted for these speeds are shown in Table 1.
Table II indicates the spectra relative to the over-all perceived noise level for the three classes of vehicles.
OCTAVE BAND'SOUND PRESSU-RE lZeyセェjセrelゥ|tiv[e TO:PE;RCEIVED NOISE LEVEL FOR THE THREE VEHICLE CLASSES
factor
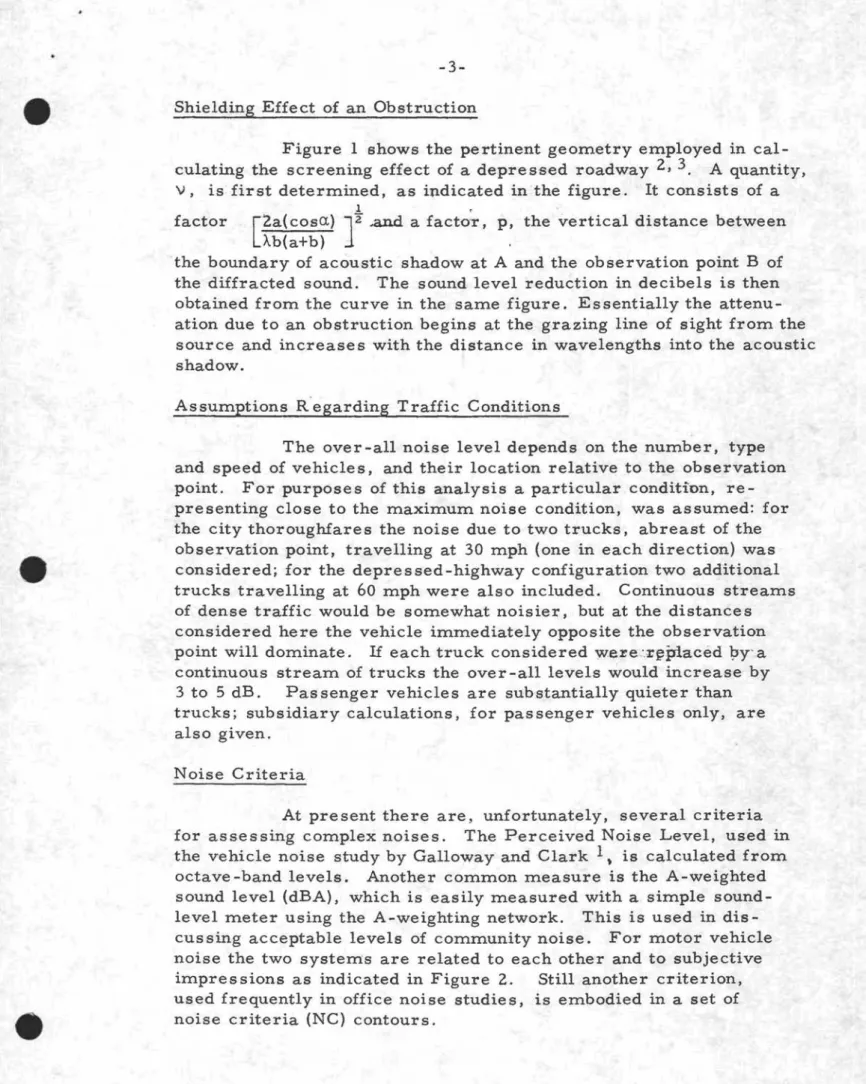
Shielding Effect of an Obstruction
Figure 1 shows the pertinent geometry employed in
cal-culating the screening effect of a depressed roadway 2,3. A quantity,
'V, is first deterIllined, as indicated in the figure. It consists of a
1 •
[2a( cosa)Ab(a+b)
J2
.and a factor, p, the vertical distance between,the boundary of acoustic shadow at A and the observation point B of
the diffracted sound. The sound level reduction in decibels is then
obtained from the curve in the same figure. Essentially the attenu-ation due to an obstruction begins at the grazing line of sight from the source and increases with the distance in wavelengths into the acoustic shadow.
Assumptions R'egarding Traffic Conditions
The over-all noise level depends on the number, type and speed of vehicle s, and their location relative to the observation
point. For purposes of this analysis a particular condition,
re-presenting close to the maximum noise condition, was assumed: for the city thoroughfares the noise due to two trucks, abreast of the observation point, travelling at 30 mph (one in each direction) was considered; for the depressed-highway configuration two additional
trucks travelling at 60 mph were also included. Continuous streams
of dense traffic would be somewhat noisier, but at the distances considered here the vehicle immediately opposite the observation
point will dominate. If each truck considered were '.r?irlaced
9Y'
acontinuous stream of trucks the over-all levels would increase by
3 to 5 dB. Pas senger vehicles are substantially quieter than
trucks; subsidiary calculations, for passenger vehicles only, are also given.
Noise Criteria
At present there are, unfortunately, several criteria
for assessing complex noises. The Perceived Noise Level, used in
the vehicle noise study by Galloway and Clark 1. is calculated from
octave -band levels. Another common measure is the A-weighted
sound level (dBA), which is easily measured with a simple
sound-level meter using the A-weighting network. This is used in
dis-cussing acceptable levels of community noise. For motor vehicle
noise the two systems are related to each other and to subjective
impressions as indicated in Figure 2. Still another criterion,
used frequently in office noise studies, is embodied in a set of noise criteria (NC) contours.
-4-Building Locations and Heights
It is assumed in all cases that both sides of the street are lined with 5-storey buildings set at the property line. Noise levels are calculated for each floor of the buildings. Higher buildings would give similar re suIts, continuing the gradual reduction in sound level with height. A set-back from the street line would result in signi-ficant reductions in noise level at the building surface if the distance to the nearest traffic lane were substantially increased (e. g. doubled).
PROCEDURE
Figure 3 is a schematic cross-section of a typical business street consisting of four traffic lanes and two parking lanes. Figure 4 is an asymmetrical multilane street consisting of a six-lane thorough-fare similar to Figure 3 plus two two-lane residential traffic routes (assumed to be quiet). Figure 5 shows a depressed six-lane highway with two lanes on each side for local traffic. Figure 6 is a similar depressed highway except for sloped shoulders and a greater width.
It will be seen that some sections of the depressed road are screened from lower parts of the nearest building; on the other hand, the buildings themselves act as reflectors, directing extra energy to the buildings opposite. In the case of a narrow canyon-like street flanked by tall buildings, the sound is attenuated very slowly as it travels upward with multiple reflections off the buildings. For purposes of this analysis the direct sounds plus the first-order re-flections off the buildings and the walls of the depressed portions were considered. Higher -order reflectiOhs . are not important in the case of 5-storey buildings, but would become so for builcHngs above 10 storeys. The noise level up the buildings due to the com-bined direct and reflected sounds is shown in Table III; the dominant path or source is indicated in each case. A similar tabulation, for passenger vehicles only, is given in Table IV. The detailed infor-mation for truck traffic is given in Appendix A, Tables A-I to A-4. Calculations were made for the frequency range 125 to 4000 cycles/ sec, which includes all significant contributions to the perceived noise level. In each case the noise source was taken to be at a height of 3 feet from the roadway; this is a compromise for tire, engine and exhaust noise (the last sometimes being at roof level for trucks).
TABLE III
NOISE LEVELS IN PNdB AT EACH OF THE 5 STOREY -LEVELS FROM TRUCKS ON A LEVEL GRADE
Type of
Highway Storey-Levels
Cross -Section
1 2 3
I
4 5Business Street 101 100 99 9a' 96
Dominant Source A(100) A(99) A(98) A(96) A(94)
(dB) (see Fig. 3)
City thoroughfare Right Side: 99 98 96 95
with extra resi- 100 A(99) A(98) A(97) A(95) A(94)
dentia1 lane s.
Dominant Source Left Side: 91 91 91 91
(dB) (see Fig. 4) 91 B(89) B(89) B(89) B(89) B(89)
Depressed Highway- 100 101 101 102 101
Vertical Shoulders A(lOO) A(99) A(97) C(98) C(98)
Dominant Source (dB) (see Fig. 5)
Depressed Highway- 101 102 101 100 99
Sloped Shou1de r s A(lOl ) A(lOO) A(98) A(96) A; C(95) Dominant Source
(dB) (see Fig. 6)
-TABLE IV
NOISE LEVELS IN PN dB AT EACH OF THE 5 STOREY -LEVELS FROM PASSENGER CARS
Type of Storey-Levels
Highway
Cross -Section 1 2 3 4 5
Business Street 92 91 90 89 87
City thDroughfare Right Side: 91 90 89 87 86
with extra
resi-dential lane s Left Side: 82 82 82 82 82
Depressed Highway- 91 92 92 93
92
Zエvセセ[イエゥ」。ャ Shoulders,.
. セM - -'-... --":.. , , II ,. Depressed Hlghway- 92 I 93 92 91 I 90 i j Slope,d Shoulde,r s . . j , . 1 --,
-6-DISCUSSION
It will be seen that, although there are difference s in detail, the levels calculated for the depressed highway configurations are not significantly worse than those for a busy city thoroughfare. The one case where there is a substantial increase is when the resi-dential lane s of Figure 4 (no traffic as sumed) a:Fe replaced by high-way and local thoroughfares (Figure 5 or 6).
It is of interest to compare the calculated levels with recommended indoor residential levels (Table V).
TABLE V
RECOMMENDED MAXIMUM LEVELS (TO BE EXCEEDED NO MORE THAN 10 PER CENT OF THE TIME) INSIDE LIVING
ROOMS AND BEDROOMS (FROM REF. 4)
.-
-Situation Day Night
Busy urban areas 50 dBA 35 dBA
:Suburban areas, away 45 dBA 35 dBA
from main traffic route s
--As suming open windows (attenuation about 15 dB), the acceptable level for a busy urban area would be about 65 dBA (NC -60)
during the day and 50 dBA (NC-45) at night. None of the cases
considered meets this requirement. This is a not unexpected con-clusion: it means that the level produced by two trucks passing simultaneously is about 35 dBA higher than the acceptable daytime
level for a residential occupancy. With ordinary windows closed,
providing an effective attenuation of 25 dBA, a further protection of
10 dBA is provided. With double windows, adequately sealed,
an-other 15 or 20 dB may be achieved, which would in most cases
reduce traffic noise to unimportance. Commercial buildings or
air-conditione'd apartment buildings, without too much glass in
the street walls, would be the most appropriate construction for
such an area. Perhaps the assumed traffic density is rather severe,
but it is likely to be approached during busy periods.
The calculations reported here refer to traffic moving at
uniform speed on almost level roads. Local traffic will be subject to
large fluctuations in noise level in the vicinity of traffic lights, due to
periodic slowing down (brake noise s) and accelerations. Similar
local peculiarities will occur in the vicinity of access ramps to 。ョセ
REFERENCES
1. W. J. Galloway and W. E. Clark, "Prediction of Noise from Motor Vehicles in Freely Flowing Traffic", Fourth
Inter-national Congress on Acoustics, Copenhagen, 21-28 August 1962. 2. Michael Rettinger, "Noise Level Reduction of 'Depressed'
Freeways", Noise Control, July 1959.
3. M. Rettinger, "Noise Level Reductions of Barriers", Noise Control, September 1957.
4. Alan Wilson et a1 (The Committee on the Problem of Noise), "Noise", Final Report, July 1963.
- - - -- - -
8
-APPENDIX A
CALCULATIONS OF NOISE LEVELS FROM TRUCKS ON
. . . . .
:,
LEVEL GRADE FOR FOUR ROAD CONFIGURATIONS TABLE A-I
BUSINESS STREET (FIG. 3)
Source Storey-Levels
1 2 3 4 5
A(direct) 100 99 98 96 94
A(fir st refle ction) 85 85 85 85 85
A(total contribution) 100 99 98 96 94
B(direct) 93 93 93 92 91
B (fir st refle ction) 88 88 87 87 87
B(total contribution) 94 94 94 93 92
.-
-Total level 101 100 99 98 96
TABLE A-2
CIl;Y THOROUGHFARE, WITH EXTRA 'RESIDENTIAL LANES (FIG. 4)
- - -
- - -Source Storey-Levels 1 2 3 4 5 Right Side A(direct) 99 98 97 95 94 A(fir st reflection) 78 78 78 78 78 A(total contribution) 99 98 97 95 94 B(direct) 92 92 91 91 90 B(first reflection) 79 79 79 79 79 B(total contribution) 92 92 91 91 90 Total level 100 99 98 96 95 Left Side A(direct) 85 85 85 85 85A(fir st fefle ct ion) 82 82 82 82 82
A(total contribution) 87 87 87 87 87 B(direct) 88 88 88 88 88 B(fir st reflection) 80 80 80 80 80 B(total contribution) 89 89 89 89 89 . MMMBMMMセMMM -. Total level 91 91 91 91 91
TABLE A-3
DEPRESSED HIGHWAY WITH VERTICAL SHOULDERS (FIG. 5)
. - - -
--Source Storey-Levels 1 2 3 4 5-A(direct) 99 99 97 96 94 1--
- -
セN-
--A(fir st refle ction) 92 76 76 76 76
A(total contribution) lbo 99 97 '96 94
B(direct) 83 83 83 83 83
-B(first reflection) 80 80 80 80 80 B(total contribution) 85 85 85 85 85-
- -
--
-C(direct) 82 84 89 98 98 C(first reflection) 82 89 89 89 89 C(total contribution) 85 90 92 98 98--
-
--D(direct) 83 94 94 94 94D(fir st refle ction) 83 91 91 91 91
D(total contribution) 86 96 96 96 96
Total level 100 101 101 102 101
TABLE A-4
DEPRESSED HIGHWAY WITH SLOPED SHOULDERS (FIG. 6)
Source Storey-Levels
-
-
-
---
----.. M⦅NセMM MMMセ ---- .---'- . . -1 2 3 4 5-
---_.
A(direct) 101 100 98 96 95 ---A(first reflection) 75 75 75 75 75 セ⦅N ... ---- -- - - - I - - - - 1 -A(total contribution) 101 100 98 1- 96 95 . 1 - - ----
- I - - -B(direct) 81 81 81 81 81 --B(first reflection) 80 80 80 80 80 1 - - -B(total contribution) 84 84 84 84 84-C(direct) 89 96 95 95 95 C(first reflection)
-
-
-
-
-C(total contribution) 89 96 95 95 95 D(direct) 87 93 93 93 92 -I--
. -D(first reflection)-
-
-
-
-D(total 」ッョエイゥ「オエゥセョl __ 87. . 93 93_1--.}l
セRN_
i
_.-- Total levelI
101 102 101 100 99-
...7
A
65
4
v
3
2
lilt,u.-/
1
FIGURE
1
SHIE L0 I NG EFFEe T 0 F AN 0 BSTRue TION
co