HAL Id: inserm-01153590
https://www.hal.inserm.fr/inserm-01153590
Submitted on 20 May 2015
HAL is a multi-disciplinary open access
archive for the deposit and dissemination of
sci-entific research documents, whether they are
pub-lished or not. The documents may come from
teaching and research institutions in France or
abroad, or from public or private research centers.
L’archive ouverte pluridisciplinaire HAL, est
destinée au dépôt et à la diffusion de documents
scientifiques de niveau recherche, publiés ou non,
émanant des établissements d’enseignement et de
recherche français ou étrangers, des laboratoires
publics ou privés.
frailty: the Whitehall II prospective cohort study.
Kim Bouillon, G David Batty, Mark Hamer, Severine Sabia, Martin Shipley,
Annie Britton, Archana Singh-Manoux, Mika Kivimäki
To cite this version:
Kim Bouillon, G David Batty, Mark Hamer, Severine Sabia, Martin Shipley, et al.. Cardiovascular
disease risk scores in identifying future frailty: the Whitehall II prospective cohort study.. Heart,
BMJ Publishing Group, 2013, 99 (10), pp.737-42. �10.1136/heartjnl-2012-302922�. �inserm-01153590�
ORIGINAL ARTICLE
Cardiovascular disease risk scores in identifying
future frailty: the Whitehall II prospective
cohort study
Kim Bouillon,
1G David Batty,
1,2Mark Hamer,
1Severine Sabia,
1Martin J Shipley,
1Annie Britton,
1Archana Singh-Manoux,
1,3,4Mika Kivimäki
1,5▸ Additional material is published online only. To view please visit the journal online (http://dx.doi.org/10.1136/ heartjnl-2012-302922). 1
Department of Epidemiology and Public Health, University College London, London, UK 2Centre for Cognitive Ageing and Cognitive Epidemiology, University of Edinburgh, Edinburgh, UK
3INSERM U1018, Centre for Research in Epidemiology and Population Health, Hôpital Paul Brousse, Villejuif, France 4Centre de Gérontologie, Hôpital Ste Périne, AP-HP, Paris, France
5
Finnish Institute of Occupational Health, Helsinki, Finland
Correspondence to Dr Kim Bouillon, Department of Epidemiology and Public Health, University College London, 1–19 Torrington Place, London WC1E 6BT, UK; kim.bouillon.09@ucl.ac.uk Received 17 August 2012 Revised 27 December 2012 Accepted 28 December 2012 Published Online First 16 March 2013
To cite: Bouillon K, Batty GD, Hamer M, et al. Heart 2013;99:737–742.
ABSTRACT
Objectives To examine the capacity of existing cardiovascular disease (CVD) risk algorithms widely used in primary care, to predict frailty.
Design Prospective cohort study. Risk algorithms at baseline (1997–1999) were the Framingham CVD, coronary heart disease and stroke risk scores, and the Systematic Coronary Risk Evaluation.
Setting Civil Service departments in London, UK. Participants 3895 participants (73% men) aged 45–69 years and free of CVD at baseline.
Main outcome measure Status of frailty at the end of follow-up (2007–2009), based on the following indicators: self-reported exhaustion, low physical activity, slow walking speed, low grip strength and weight loss. Results At the end of the follow-up, 2.8% (n=108) of the sample was classified as frail. All four CVD risk scores were associated with future risk of developing frailty, with ORs per one SD increment in the score ranging from 1.35 (95% CI 1.21 to 1.51) for the Framingham stroke score to 1.42 (1.23 to 1.62) for the Framingham CVD score. These associations remained after excluding incident CVD cases. For comparison, the corresponding ORs for the risk scores and incident cardiovascular events varied between 1.36 (1.15 to 1.61) and 1.64 (1.50 to 1.80) depending on the risk algorithm.
Conclusions The use of CVD risk scores in clinical practice may also have utility for frailty prediction.
INTRODUCTION
Frailty is a clinically recognised geriatric syndrome characterised by declines in functioning across an array of physiological systems.1 Common symp-toms of frailty are weight loss, exhaustion, low physical activity, slow walking speed at‘usual pace’ and low grip strength.1 In the elderly, there is
growing evidence that frailty predicts various adverse health outcomes such as disability,2
institu-tionalisation,2falls,3fractures,3hospitalisation4and mortality.3In order to design interventions for
pre-venting frailty, it is important to identify individuals at risk of developing the syndrome.
In addition to cardiovascular disease (CVD), there is increasing evidence to suggest that CVD risk factors measured in midlife predict a wide range of old-age health outcomes including cogni-tive decline and dementia,5 late-life depression6 and disability.7Although few large-scale prospective
studies have examined the association between
CVD risk factors and frailty, such a link is plausible for at least two reasons. First, several studies have shown a cross-sectional association between CVD and frailty.2In one cross-sectional study, subclinical
CVD diagnosed using non-invasive testing (carotid ultrasound, ankle–arm index, electrocardiography, echocardiography and cerebral MRI) was related to frailty after excluding clinically diagnosed CVD.8
Second, several individual risk factors included in multi-factorial prediction algorithms of CVD, such as the Framingham score, have been associated with frailty status: high blood pressure,9diabetes,9
low high-density lipoprotein (HDL)-cholesterol level10and cigarette smoking.11
In this study, we hypothesised that CVD risk scores used to assess 10-year risk of CVD would be associated with subsequent frailty status in people who were initially CVD-free. If a strong association between CVD risk scores and frailty is confirmed, these scores, importantly already routinely adminis-tered in clinical practice, would present a conveni-ent way to idconveni-entify individuals at an increased risk of frailty later in life and in need of early prevent-ive measures. Evidence from randomised controlled trials suggest that exercise programmes12 and selected drugs (eg, dehydroepiandrosterone13 and
testosterone14) can reverse frailty.
METHODS Study population
Data were drawn from the Whitehall II study, an ongoing longitudinal study of 10 308 (67% men) London-based British civil servants aged 35– 55 years in 1985.15Study inception ( phase 1) took place during 1985–1988 and involved a clinical examination and self-administered questionnaire. Subsequent phases of data collection have alter-nated between postal questionnaire alone ( phases 2 (1988–1990), 4 (1995–1996), 6 (2001), 8 (2006) and 10 (2011)), and postal questionnaire accom-panied by a clinical examination approximately every 5 years ( phases 3 (1991–1993), 5 (1997– 1999), 7 (2002–2004) and 9 (2007–2009)).
We utilised CVD risk factors measured at phase 5 (‘baseline’ for the purposes of our analyses) to assess the risk of developing frailty at phase 9 when the frailty components were first measured. This design provides a 10-year follow-up corresponding to that of the CVD risk prediction models we uti-lised.16–19
Open Access Scan to access more
CVD risk factors at baseline
Blood samples were collected following either an 8-h overnight fast or at least a 4-h fast after a light fat-free breakfast. Serum for lipid analyses was refrigerated at −4°C and assayed within 72 h. Total cholesterol was determined by an enzymatic proced-ure using the automated cholesterol oxidase-phenol aminophe-nazone (CHOD-PAP) method. Serum HDL-cholesterol concentrations were measured from the supernatant after pre-cipitation of non-HDL-cholesterol with phosphotungstate. Systolic blood pressure was measured twice with the Hawksley random zero sphygmomanometer in the sitting position after 5 min rest. We used the average of the two readings in the present analyses. Participants reported the medications used in the previous 14 days; responses were coded using the British National Formulary codes.20 Antihypertensive therapy was based on the use of the following drugs: diuretics, β-blockers, ACE inhibitors, calcium channel blockers and other antihyper-tensive drugs. Current smoking (yes/no) was ascertained by self-report. Prevalent diabetes mellitus was defined based on reported doctor-diagnosed diabetes mellitus or use of diabetes medication, or when participants had a baseline fasting plasma glucose level >126 mg/dl (>7.0 mmol/l).21 Presence of atrial
fibrillation and left ventricular hypertrophy was determined on the ECG using the Minnesota Code:22atrialfibrillation is coded
as 8-3-1 and left ventricular hypertrophy as 3-1-0.
CVD risk scores at baseline
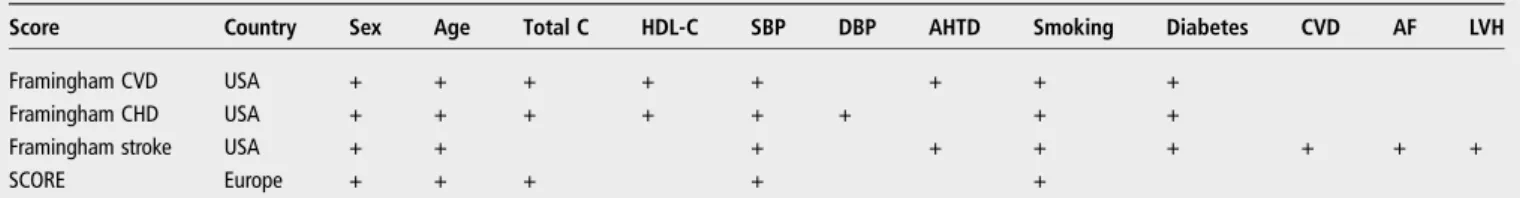
In addition tofirst relating individual CVD risk factors to later frailty risk, we also examined the predictive capacity of four established CVD risk score algorithms: the Framingham CVD,18 coronary heart disease (CHD),19stroke prediction models17and SCORE (systematic coronary risk evaluation).16 Table 1 sum-marises all components included in the models, described below.
Outcomes at follow-up
Frailty was measured using the Fried frailty scale at the end of follow-up ( phase 9, 2007–2009). This measure comprises the following components: self-reported exhaustion, low physical activity, slow walking speed, low grip strength and weight loss (cut-offs for each component are based on that of Friedet al).1
A total frailty score was calculated by allocating a value of 1 to each of the criteria if present, resulting in a range of 0–5. Participants were classified as ‘frail’ if they had at least three out offive of the frailty components; as ‘pre-frail’ if they had 1–2; and as ‘non-frail’ if they had none of these components.1 Validated CVD outcomes (non-fatal CHD, non-fatal stroke, and a composite of non-fatal CVD cases including both groups) were assessed over the follow-up period (1997–1999 to 2007– 2009). More details are available in the supplementary web appendix.
Statistical analyses
Each CVD risk factor at baseline was described according to the frailty status (frail, pre-frail, and non-frail) at year 10 of follow-up using theχ2test, Fisher’s exact test or analysis of
vari-ance as appropriate. We then summarised these associations using binary logistic regression analyses with frailty status dichotomised: frail versus pre-frail/non-frail. As the mean risk scores in men were systematically higher than those in women ( p values for all four scores <0.0001), we standardised these risk scores into standard scores (mean=0, SD=1) in men and women separately. The OR of being frail or pre-frail was esti-mated per one SD increase (higher score represents greater CVD risk) in the risk scores over the 10-year follow-up. As sex did not modify the relation of the standardised risk scores with frailty at follow-up (all p values for sex interaction >0.61), men and women were combined in the analysis.
In examining the associations between individual risk factors and later frailty, we initially produced sex-adjusted models and then adjusted for the other risk factors to explore the independ-ent effect of individual CVD risk factors with frailty. Binary logistic regression models were then used to examine the impact of a one SD increment in the risk scores on frailty at follow-up. We also examined the association between the CVD risk scores and incident cardiovascular events (CVD, CHD and strokes) to compare the strength of their associations to that with frailty. In addition, we conducted several sensitivity analyses. (1) To examine whether the association between the risk scores and frailty was mediated by underlying CVD, we estimated the strength of this association after excluding incident CVD cases. (2) To examine whether the association between the risk scores and frailty was biased by missing data, we imputed data for missing frailty status and individual CVD risk factors included in the risk scores. This was done for participants eligible at phase 5 and alive at the end of follow-up (n=7412) using the method of multiple imputation by chained equations performed with an SAS-callable software application, IVEware.23 (3) We
tested whether the CVD risk scores also predict‘pre-frailty’ in a cohort excluding the frailty cases (see supplementary web appendix). Finally, to explore the extent to which the relation-ship between the risk scores and frailty was driven by specific CVD risk factors included in the scores, analyses on the risk scores–frailty associations were adjusted individually for each of their risk factors (see supplementary web appendix, table S1). A greater attenuation in the association after adjustment indicates a greater contribution of that specific risk factor. All analyses were performed with SAS V.9.1.
RESULTS
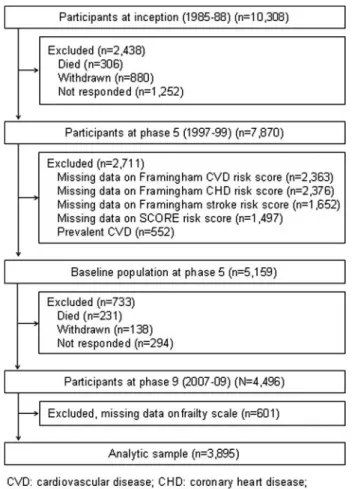
Of the 7870 study members who participated at phase 5, a total of 3895 participants (1037 women) aged 45–69 years consti-tuted the analytic sample (figure 1). Compared with participants
Table 1 Composition of the SCORE and Framingham CVD, CHD and stroke risk algorithms
Score Country Sex Age Total C HDL-C SBP DBP AHTD Smoking Diabetes CVD AF LVH
Framingham CVD USA + + + + + + + +
Framingham CHD USA + + + + + + + +
Framingham stroke USA + + + + + + + + +
SCORE Europe + + + + +
AHTD, antihypertensive drug; AF, atrial fibrillation; CVD, cardiovascular disease; CHD, coronary heart disease; C, cholesterol; DBP, diastolic blood pressure; LVH, left ventricular hypertrophy; SBP, systolic blood pressure; SCORE, Systematic Coronary Risk Evaluation.
alive at phase 9 but excluded (owing to non-participation at phases 5 and 9, prior history of CVD at phase 5, and missing data on the CVD risk scores or the frailty scale, total n=3517), persons included in the analytic sample (n=3895) were 1.1 years younger ( p<0.0001), less likely to be female (26.6% vs 34.5%, p<0.0001) and less likely to be from the lower socio-economic group (10.0% vs 20.0%, p<0.0001) (see supplemen-tary web appendix, table S2).
In table 2 we present the baseline characteristics of partici-pants according to frailty status at the end of follow-up, on average 10.5 years (SD=0.5) after the measurement of CVD risk scores. Of the 3895 participants, 2.8% were classified as frail, 37.1% as pre-frail and 60.1% as non-frail. In comparison with non-frail participants, frail participants were more likely to be older, female, use antihypertensive treatment, smoke and have diabetes. Frail participants were also more likely to have experienced a CVD event during the follow-up relative to their non-frail counterparts (incidence 16.7% vs 8.5%, p=0.01).
In table 3, we present the association between the individual CVD risk factors at baseline and frailty at follow-up. In the model including all risk factors, only two were independently associated with future frailty: increased age and use of antihy-pertensive treatment. Thus, a one SD increment in age (5.9 years for men and women) increased the odds of being frail by 56% (OR=1.56, 95% CI 1.28 to 1.92) and using an antihy-pertensive treatment increased the odds by 77% (OR=1.77, 95% CI 1.10 to 2.94).
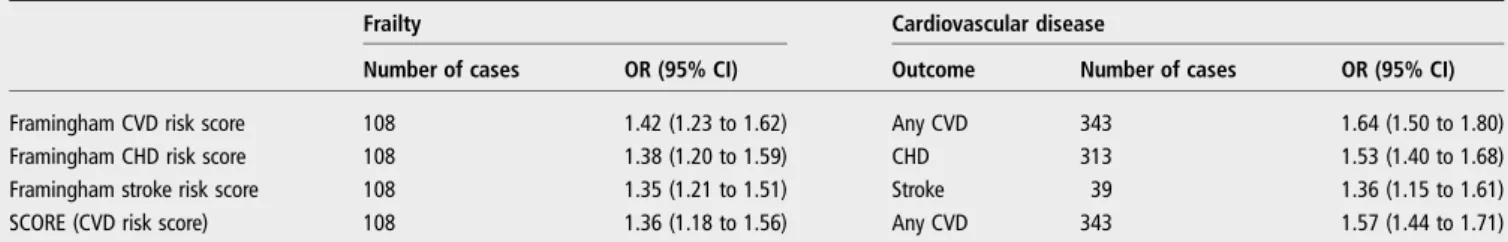
Table 4 shows the association of a one SD increment in the CVD risk scores with future frailty and cardiovascular events. All risk scores had a similar strength of association with frailty, with the ORs ranging from 1.35 (95% CI 1.21 to 1.51) for the Framingham stroke risk score to 1.42 (95% CI 1.23 to 1.62) for the Framingham CVD risk score. As expected, the association of the CVD risk scores was stronger in relation to predicting CVD events, with ORs ranging from 1.36 (95% CI 1.15 to 1.61) for the Framingham stroke risk score to 1.64 (95% CI 1.50 to 1.80) for the Framingham CVD risk score. The strength of the association between the CVD risk scores and frailty remained essentially the same after exclusion of incident CVD cases, and in multiple imputation (see supplementary web appendix, table S3). The CVD risk scores also predicted pre-frailty although to a lesser extent than for frailty (see supplementary web appendix, table S4).
In supplementary web appendix, table S1, we present results of analyses in which the four CVD risk scores were adjusted for each of their risk factors. The association between risk scores and frailty was attenuated after adjustments for age and antihy-pertensive treatment, but is still statistically significant, suggest-ing that this association was not driven by any specific risk factor.
DISCUSSION
Our mainfinding from this cohort of middle aged individuals was that four different CVD risk scores were associated with an elevated risk of frailty. Thus, one sex-specific SD increment in the risk scores increased the odds of being classified as frail at the end of the 10-year follow-up by 35–42%. The strength of this association was only slightly diminished after exclusion of cases of CVD during the follow-up, suggesting that the predict-ive risk score-frailty associations were not drpredict-iven by co-morbid CVD. Furthermore, we found that these scores stratified the risk of developing frailty. To the best of our knowledge, the link between scores from CVD risk factor engines and future frailty has not been examined.
Although initially designed to predict CVD, our results suggest that the CVD risk scores also appear to be a predictive marker of general health such as frailty status. In a previous study, the Framingham CVD risk score was also found to be associated with cognitive decline.5 Our finding in relation to frailty is plausible given that each risk factor—age, total choles-terol, HDL-cholescholes-terol, systolic blood pressure, smoking and diabetes—included in these scores has also been shown to be associated with various other health outcomes including cancer, which, after CVD, is the second leading cause of death in eco-nomically developed countries.24 One plausible mechanism linking risk scores to both CVD and frailty is the presence of atherosclerosis in arteries and related chronic systemic in flamma-tion.25 Atherosclerotic processes can prevent blood flow
through the coronary artery, causing CVD,25 and through the muscles, causing sarcopenia, a clinical feature of frailty.26
We found that the proportion of frailty was higher in women than men (5.1% versus 1.9%, respectively). This is in agreement with previousfindings,27but opposite to what one might expect for CVD, which is more common in men in late middle-age. In our study, the incidence of CVD was 9.9% in men versus 5.7% in women. A potential explanation for the higher incidence of frailty in women pertains to differences in biology between the sexes, with men having greater bone mineral density and muscle mass in old age.28
Figure 1 Flow of study members through the data collection phases in Whitehall II.
This study has some limitations. First, we identified frailty cases by using a measure operationalised by Fried et al,1but a recent review identified that there are more than 20 alternative measures of frailty.29Although there are no gold standard mea-sures, the measure by Fried et al is the most widely used. Second, we assessed CVD risk at the mean age of 55 years. It remains unclear whether ourfindings are generalisable to other age groups because at older ages low rather than high levels of some cardiovascular risk factors (total cholesterol, low-density lipoprotein (LDL)-cholesterol and systolic blood pressure) are associated with poor health outcome, as assessed by activity daily living disability, hospitalisation, functional performance and mortality.30 In relation to CVD prediction, the risk scores
are not recommended to be used at older ages (>75 years); the validity of these scores as risk markers of frailty should be exam-ined in that age in future studies. Third, approximately half of the study members who participated at phase 5 were excluded from the analysis due to death, non-participation, loss to follow-up or missing data. Our sensitivity analysis suggests this is not a major source of bias because the results using the mul-tiple multivariate imputation method were largely similar to
those reported in the main analysis. However, we cannot rule out bias arising from attrition not covered by the missingness-at-random assumption. Finally, our study sample consisted of middle-aged civil servants, limiting the generalis-ability of ourfindings. These limitations can be compared to the main strength of our study, which resides in the use of prospect-ively collected data given that previous studies that have exam-ined the association between CVD or its individual risk factors and frailty used cross-sectional data.2 8 9 Our results suggest a relationship between the CVD risk scores and frailty that is independent of existing CVD. However, these findings, based on observational data, do not provide information about causal-ity as we cannot rule out the confounding effect of unmeasured risk factors.
Besides the clinical utility of CVD risk scores—Framingham CVD, CHD, stroke or SCORE—in predicting risk of cardiovas-cular death and disease, our results suggest that they may also help to identify middle-aged persons who will benefit from interventions designed to prevent frailty. As such, the use of CVD risk scores in clinical practice may also have utility for frailty prediction.
Table 2 Characteristics of participants in the analytical sample (n=3895)
All
Frailty status at follow-up
p Value* Not frail Pre-frail Frail
Number 3895 2342 1445 108
Age, years, mean (SD) 55.2 (5.9) 54.9 (5.7) 55.5 (6.1) 57.9 (6.5) <0.0001 Sex, n (%)
Male 2858 (73.4) 1821 (77.8) 982 (68.0) 55 (50.9) <0.0001
Female 1037 (26.6) 521 (22.4) 463 (32.0) 53 (49.1)
Total cholesterol, mmol/l, mean (SD) 5.92 (1.05) 5.91 (1.02) 5.94 (1.09) 5.99 (1.03) 0.22 HDL cholesterol, mmol/l, mean (SD) 1.46 (0.39) 1.47 (0.39) 1.45 (0.38) 1.47 (0.39) 0.21 Systolic blood pressure, mm Hg, mean (SD) 122.7 (16.0) 122.3 (15.7) 123.3 (16.3) 124.5 (16.1) 0.03 Diastolic blood pressure, mm Hg, mean (SD) 77.6 (10.3) 77.5 (10.2) 77.8 (10.5) 78.4 (11.6) 0.28 Antihypertensive treatment, n (%) No 3515 (90.2) 2137 (91.3) 1293 (89.5) 85 (78.7) <0.0001 Yes 380 (9.8) 205 (8.7) 152 (10.5) 23 (21.3) Smoking, n (%) No 3593 (92.3) 2185 (93.3) 1313 (90.9) 95 (88.0) 0.006 Yes 302 (7.8) 157 (6.7) 132 (9.1) 13 (12.0) Diabetes, n (%) No 3755 (96.4) 2273 (97.1) 1381 (95.6) 101 (93.5) 0.02 Yes 140 (3.6) 69 (3.0) 64 (4.4) 7 (6.5) Atrial fibrillation, n (%) No 3882 (99.7) 2335 (99.7) 1439 (99.6) 108 (100.0) -Yes 13 (0.3) 7 (0.3) 6 (0.4) 0
Left ventricular hypertrophy, n (%)
No 3667 (94.2) 2214 (94.5) 1356 (93.8) 97 (89.8) 0.10 Yes 228 (5.8) 128 (5.5) 89 (6.2) 11 (10.2) Incident CVD at follow-up, n (%) No 3552 (91.2) 2143 (91.5) 1319 (91.3) 90 (83.3) 0.01 Yes 343 (8.8) 199 (8.5) 126 (8.7) 18 (16.7) Incident CHD at follow-up, n (%) No 3582 (92.0) 2165 (92.4) 1324 (91.6) 93 (86.1) 0.05 Yes 313 (8.0) 177 (7.6) 121 (8.4) 15 (13.9)
Incident stroke at follow-up, n (%)
No 3856 (99.0) 2316 (98.9) 1436 (99.4) 104 (96.3) 0.01
Yes 39 (1.1) 26 (1.1) 9 (0.6) 4 (3.7)
*p for heterogeneity.
Acknowledgements We thank all participating men and women in the Whitehall II study; all participating Civil Service departments and their welfare, personnel and establishment officers; the Occupational Health and Safety Agency; and the Council of Civil Service Unions. The Whitehall II study team comprises research scientists, statisticians, study coordinators, nurses, data managers, administrative assistants and data entry staff, who make the study possible.
Contributors MK and GDB conceived the idea for the study and along with KB developed the objectives and design of the study. KB ran the analyses and acts as guarantor of the paper. KB, MK and GDB drafted the paper. All authors contributed to the interpretation of results and revision of the paper, and approved thefinal version of the paper.
Funding This work was supported by grants from the Medical Research Council, UK; Economic and Social Research Council, UK; British Heart Foundation, UK; Health and Safety Executive, UK; Department of Health, UK; BUPA Foundation, UK; National Heart Lung and Blood Institute (R01HL036310), USA; NIH (National Institute on Aging) (R01AG013196; R01AG034454), USA. GDB is a Wellcome Trust Fellow, UK. MS is supported by the British Heart Foundation, ASM is supported by a ‘European Young Investigator Award’ from the European Science Foundation, and MK is supported by the UK Medical Research Council, the EU New OSH ERA research programme, the Academy of Finland, Finland and by a professorial fellowship from the Economic and Social Research Council, UK.
Competing interests None.
Ethics approval This study was approved by the University College London ethics committee, and participants provided written consent.
Provenance and peer review Not commissioned; externally peer reviewed.
Data sharing statement Whitehall II data, protocols, and other metadata are available to the scientific community. Please refer to the Whitehall II data sharing policy at http://www.ucl.ac.uk/whitehallII/data-sharing.
Open Access This is an Open Access article distributed in accordance with the Creative Commons Attribution Non Commercial (CC BY-NC 3.0) license, which permits others to distribute, remix, adapt, build upon this work non-commercially, and license their derivative works on different terms, provided the original work is properly cited and the use is non-commercial. See: http://creativecommons.org/ licenses/by-nc/3.0/
REFERENCES
1 Fried LP, Tangen CM, Walston J, et al. Frailty in older adults: evidence for a phenotype. J Gerontol A Biol Sci Med Sci 2001;56:M146–56.
2 Bandeen-Roche K, Xue QL, Ferrucci L, et al. Phenotype of frailty: characterization in the women’s health and aging studies. J Gerontol A Biol Sci Med Sci
2006;61:262–6.
3 Ensrud KE, Ewing SK, Taylor BC, et al. Frailty and risk of falls, fracture, and mortality in older women: the study of osteoporotic fractures. J Gerontol A Biol Sci Med Sci 2007;62:744–51.
4 Rochat S, Cumming RG, Blyth F, et al. Frailty and use of health and community services by community-dwelling older men: the Concord Health and Ageing in Men Project. Age Ageing 2010;39:228–33.
5 Kaffashian S, Dugravot A, Nabi H, et al. Predictive utility of the Framingham general cardiovascular disease risk profile for cognitive function: evidence from the Whitehall II study. Eur Heart J 2011;32:2326–32.
Table 4 OR per one sex-specific SD increment in score using four CVD risk algorithms for future frailty and cardiovascular diseases (n=3895)
Frailty Cardiovascular disease
Number of cases OR (95% CI) Outcome Number of cases OR (95% CI) Framingham CVD risk score 108 1.42 (1.23 to 1.62) Any CVD 343 1.64 (1.50 to 1.80) Framingham CHD risk score 108 1.38 (1.20 to 1.59) CHD 313 1.53 (1.40 to 1.68) Framingham stroke risk score 108 1.35 (1.21 to 1.51) Stroke 39 1.36 (1.15 to 1.61) SCORE (CVD risk score) 108 1.36 (1.18 to 1.56) Any CVD 343 1.57 (1.44 to 1.71)
CVD, cardiovascular disease; CHD, coronary heart disease; SCORE, Systematic Coronary Risk Evaluation.
Table 3 Association between individual cardiovascular disease risk factors at baseline and frailty at 10-year follow-up (n=3895)
Predictors N (%)
OR (95% CI) for frailty
Adjusted for sex Fully adjusted†
Age, years* 3895 1.58 (1.30 to 1.91) 1.56 (1.28 to 1.92)
Total cholesterol, mg/dl* 3895 1.05 (0.87 to 1.26) 0.96 (0.79 to 1.18)
HDL cholesterol, mg/dl* 3895 0.84 (0.69 to 1.03) 0.90 (0.73 to 1.10)
Systolic blood pressure, mm Hg* 3895 1.15 (0.96 to 1.39) 0.87 (0.65 to 1.15) Diastolic blood pressure, mm Hg* 3895 1.17 (0.97 to 1.42) 1.20 (0.91 to 1.59) Antihypertensive treatment No 3515 (90.2) 1 (ref) 1 (ref) Yes 380 (9.8) 2.42 (1.50 to 3.90) 1.77 (1.10 to 2.94) Smoking No 3593 (92.2) 1 (ref) 1 (ref) Yes 302 (7.8) 1.50 (0.83 to 2.72) 1.62 (0.88 to 2.97) Diabetes No 3755 (96.4) 1 (ref) 1 (ref) Yes 140 (3.6) 1.81 (0.82 to 3.99) 1.29 (0.57 to 2.91) Atrial fibrillation No 3882 (99.7) – – Yes 13 (0.3) – –
Left ventricular hypertrophy
No 3667 (94.1) 1 (ref) 1 (ref)
Yes 228 (5.9) 2.09 (1.10 to 3.97) 1.66 (0.85 to 3.21)
*OR per SD increase.
6 Kivimaki M, Shipley MJ, Allan CL, et al. Vascular risk status as a predictor of later-life depressive symptoms: a Cohort Study. Biol Psychiatry 2012;72:324–30. 7 Pinsky JL, Branch LG, Jette AM, et al. Framingham Disability Study: relationship of
disability to cardiovascular risk factors among persons free of diagnosed cardiovascular disease. Am J Epidemiol 1985;122:644–56.
8 Newman AB, Gottdiener JS, McBurnie MA, et al. Associations of subclinical cardiovascular disease with frailty. J Gerontol A Biol Sci Med Sci 2001;56: M158–66.
9 Lee JS, Auyeung TW, Leung J, et al. Physical frailty in older adults is associated with metabolic and atherosclerotic risk factors and cognitive impairment independent of muscle mass. J Nutr Health Aging 2011;15:857–62.
10 Landi F, Russo A, Cesari M, et al. HDL-cholesterol and physical performance: results from the ageing and longevity study in the sirente geographic area (ilSIRENTE Study). Age Ageing 2007;36:514–20.
11 Strawbridge WJ, Shema SJ, Balfour JL, et al. Antecedents of frailty over three decades in an older cohort. J Gerontol B Psychol Sci Soc Sci 1998;53:S9–16. 12 Peterson MJ, Sloane R, Cohen HJ, et al. Effect of telephone exercise counseling on
frailty in older veterans: project LIFE. Am J Mens Health 2007;1:326–34. 13 Kenny AM, Boxer RS, Kleppinger A, et al. Dehydroepiandrosterone combined with
exercise improves muscle strength and physical function in frail older women. J Am Geriatr Soc 2010;58:1707–14.
14 Kenny AM, Kleppinger A, Annis K, et al. Effects of transdermal testosterone on bone and muscle in older men with low bioavailable testosterone levels, low bone mass, and physical frailty. J Am Geriatr Soc 2010;58:1134–43.
15 Marmot M, Brunner E. Cohort Profile: the Whitehall II study. Int J Epidemiol 2005;34:251–6.
16 Conroy RM, Pyorala K, Fitzgerald AP, et al. Estimation of ten-year risk of fatal cardiovascular disease in Europe: the SCORE project. Eur Heart J
2003;24:987–1003.
17 D’Agostino RB, Wolf PA, Belanger AJ, et al. Stroke risk profile: adjustment for antihypertensive medication. The Framingham Study. Stroke 1994;25:40–3. 18 D’Agostino RB Sr, Vasan RS, Pencina MJ, et al. General cardiovascular risk profile for
use in primary care: the Framingham Heart Study. Circulation 2008;117:743–53. 19 Wilson PW, D’Agostino RB, Levy D, et al. Prediction of coronary heart disease using
risk factor categories. Circulation 1998;97:1837–47.
20 Joint Formulary Committee. British national formulary. 32 edn. London: BMJ Group and Pharmaceutical Press, 1996.
21 American Diabetes Association, Diagnosis and classification of diabetes mellitus. Diabetes Care 2012;35:S64–71.
22 Prineas R, Crow R, Blackburn H. The Minnesota code manual of electrocardiographic findings. Littleton, Massachusetts, USA: John Wright-PSG, 1982.
23 Raghunathan TE, Solenberger PW, van Hoewyk J. IVEware: Imputation and Variance Estimation Software User Guide. http://www isr umich edu/src/smp/ive 2002 (accessed 1 Aug 2012).
24 World Health Organization. The global burden of disease 2004 update. Geneva: World Health Organization, 2008.
25 Hansson GK. Inflammation, atherosclerosis, and coronary artery disease. N Engl J Med 2005;352:1685–95.
26 Morley JE, Perry HM III, Miller DK. Editorial: Something about frailty. J Gerontol A Biol Sci Med Sci 2002;57:M698–704.
27 Rockwood K. What would make a definition of frailty successful? Age Ageing 2005;34:432–4.
28 Newman AB, Brach JS. Gender gap in longevity and disability in older persons. Epidemiol Rev 2001;23:343–50.
29 Sternberg SA, Wershof Schwartz A, Karunananthan S, et al. The identification of frailty: a systematic literature review. J Am Geriatr Soc 2011;59:2129–38. 30 Schupf N, Costa R, Luchsinger J, et al. Relationship between plasma lipids and