HAL Id: inserm-00981320
https://www.hal.inserm.fr/inserm-00981320
Submitted on 22 Apr 2014
HAL is a multi-disciplinary open access
archive for the deposit and dissemination of
sci-entific research documents, whether they are
pub-lished or not. The documents may come from
teaching and research institutions in France or
abroad, or from public or private research centers.
L’archive ouverte pluridisciplinaire HAL, est
destinée au dépôt et à la diffusion de documents
scientifiques de niveau recherche, publiés ou non,
émanant des établissements d’enseignement et de
recherche français ou étrangers, des laboratoires
publics ou privés.
Marie-Quitterie Picat, Rodolphe Thiébaut, François Lifermann, Xavier
Delbrel, Daniel Adoue, Linda Wittkop, Anne-Laure Fauchais, Patrick Rispal,
Jean-François Moreau, Jean-François Viallard
To cite this version:
Marie-Quitterie Picat, Rodolphe Thiébaut, François Lifermann, Xavier Delbrel, Daniel Adoue, et
al.. T-cell activation discriminates subclasses of symptomatic primary humoral immunodeficiency
diseases in adults.. BMC Immunology, BioMed Central, 2014, 15 (1), pp.13.
�10.1186/1471-2172-15-13�. �inserm-00981320�
R E S E A R C H A R T I C L E
Open Access
T-cell activation discriminates subclasses of
symptomatic primary humoral immunodeficiency
diseases in adults
Marie-Quitterie Picat
1,2,3,4, Rodolphe Thiébaut
1,2,3,4*, François Lifermann
5, Xavier Delbrel
6, Daniel Adoue
7,
Linda Wittkop
1,2,3,4, Anne-Laure Fauchais
8, Patrick Rispal
9, Jean-François Moreau
10,11,12and Jean-François Viallard
13,14*Abstract
Background: Symptomatic Primary Humoral Immunodeficiency Diseases (PHID) constitute a highly heterogeneous group of diseases characterized by a shared hypogammaglobulinemia, resulting in increased risk of recurrent or severe infections. Associations have been described with a variety of immunological abnormalities involving B and T-cell differentiation, T-cell activation and innate immunity. However, PHID discrimination remains based on B-lymphocyte abnormalities and other components of the immune system have not been sufficiently taken into account. We carried out unsupervised and supervised methods for classification in a cohort of 81 symptomatic PHID patients to evaluate the relative importance of 23 immunological parameters and to select relevant markers that may be useful for diagnosis and prognosis.
Results: We identified five groups of patients, among which the percentage of PHID complications varied substantially. Combining the set of markers involved in PHID supported the existence of two distinct mechanisms associated with complications. Switched memory B-cell attrition and CD8+ HLA-DR + activated T-cell increase were the prominent abnormalities observed in PHID complications. Furthermore, in a subgroup of 57 patients with common variable immunodeficiency, the classification that added CD8+ HLA-DR + to the consensual EUROclass classification was better than the EUROclass model in predicting complications.
Conclusion: These results highlight the importance of T-cell activation that may improve discrimination of PHID patients in specific subgroups and help to identify patients with different clinical outcomes.
Keywords: Symptomatic primary humoral immunodeficiency, T-cell activation, HLA-DR marker, Hierarchical clustering, Principal component analysis, Common variable immunodeficiency, IgG subclass deficiency, Good’s syndrome
Background
Primary Humoral Immunodeficiency Diseases (PHID) are a heterogeneous group of diseases characterized by a deficit in immunoglobulin (Ig) production, resulting in increased risk of recurrent or severe infections [1]. In adults, after elimination of secondary causes, in
particular lymphoid hemopathies, drug-related causes or renal/digestive leakage of Ig, three major symptomatic PHID have to be entertained: Common Variable Im-munoDeficiency [2] (CVID), IgG SubClass ImmunoDefi-ciency [3] (IgG SD) or Good’s syndrome [4]. Although recurrent respiratory tract infections is common to nearly all patients with symptomatic PHID, distinct clinical complications have been described [5-7] accor-ding to the occurrence of autoimmune manifestations, lymphoid hyperplasia, chronic enteropathy, spleno-megaly and/or granulomatous disease. It has been shown that both outcome and prognosis vary within these
* Correspondence:rodolphe.thiebaut@isped.u-bordeaux2.fr;jean-francois. viallard@chu-bordeaux.fr
1
INSERM, ISPED, Centre INSERM U897-Epidemiologie-Biostatistique, Bordeaux F-33076, France
13Department of Internal Medicine and Infectious Diseases, Bordeaux
University Hospital, Pessac F-33604, France
Full list of author information is available at the end of the article
© 2014 Picat et al.; licensee BioMed Central Ltd. This is an Open Access article distributed under the terms of the Creative Commons Attribution License (http://creativecommons.org/licenses/by/2.0), which permits unrestricted use, distribution, and reproduction in any medium, provided the original work is properly credited.
subgroups of phenotypes in PHID [4,6]. Immunoglobu-lin substitution reduces the incidence of acute infections but does not solve the appearance of complications that are the major cause of morbidity and death among patients with symptomatic PHID [4,8].
The various attempts of PHID classifications have fo-cused on CVID because of their frequency [2]. Different classification proposals have attempted to define CVID using flow cytometry techniques based on B-cell differen-tial phenotyping [9,10]. Recently, data from the EURO-class group including over 300 European CVID patients, unified previous findings with a classification based on the percentage of B cells among circulating lymphocytes and the percentage of switched memory B cells (smB) among B cells [5]. However, this updated classification does not include other components of immune dysregulation, either causal or consequential, that have been reported in CVID patients. Giovanetti et al. [11] performed an in-depth analysis of the T-cell compartment in CVID patients and demonstrated multiple T-cell abnormalities. T-cell ac-tivation is an important process underlined [12,13] that need to be explored, together with T-cell regulation [14,15]. Indeed, gammadelta T cells [16] and innate cell abnormalities reported in Natural Killer cells (NK) [17] or myeloid dendritic (mDC) and plasmacytoid dendritic cells (pDC) [18] may further contribute to the heterogeneous presentation of CVID. Literature on IgG subclass defi-ciency is poor and immunological characteristics of these patients have not been explored as they have been in CVID. In parallel, Good’s syndrome is characterized by hypogammaglobulinemia and thymoma, low or absent B cells, variable defects in cell-mediated immunity with a CD4 T lymphopenia, an inverted CD4/CD8+ T-cell ratio and reduced T-cell mitogen proliferative responses [4].
Because of its intrinsic complexity, distinguishing patients with symptomatic PHID in practice can be chal-lenging. Particularly, the median delay of diagnosis re-ported in CVID is 7 years [2]. Some patients with IgG subclass deficiency might develop non infectious compli-cations as those observed in CVID [19], suggesting that these two entities could have common determinants. Moreover, IgG subclass deficiency may progress to have typical common variable immunodeficiency [3]. The immunophenotypic evaluation of symptomatic PHID could provide diagnostic clues as well as information use-ful to manage patients, to predict clinical outcomes [20,21] and to improve classification schemes. The pur-pose of our study was therefore to characterize subgroups of PHID patients that could be defined by differentiation, activation and regulation markers of B and T-lymphocytes expressing αβ or γδ TCR, natural killer cells and dendritic cells using supervised and unsupervised methods of classi-fication appropriate for the high-dimensional data [22] generated by flow cytometry [23,24].
Methods
Design and data collection
The ALTADIH Cohort is a prospective hospital-based cohort of symptomatic PHID patients [1], initiated at the Bordeaux University Hospital and five other public hospitals (Agen, Dax, Limoges, Pau and Toulouse) in Aquitaine, South-Western France. First patients were enrolled in 2007. Patients included were over eighteen years old with primary hypogammaglobulinemia (serum IgG level < 5 g/L for CVID, or IgG subclass deficiency or Good’s syndrome). They were already followed for symptomatic or newly diagnosed PHID (Ig level deter-mined before substitution therapy). Differential diagno-ses of hypogammaglobulinemia have been excluded and the reduction in the level of the seric gammaglobulins was confirmed at least 3 times at 3-month intervals for each patient, thus excluding transient hypogammaglobu-linemia. A standardized questionnaire was filled by physi-cians at each hospital contact, according to routine clinical management procedures, generally every 6 months. Clin-ical data collected focused on infections and PHID com-plications while biological data focused on innate and adaptive markers.
The ALTADIH Cohort was approved by the Bordeaux University Institutional Review Board on December 20th, 2006. Each patient gave informed written consent before participating in the study. Some PHID patients were also enrolled in the French national prospective Cohort DEFI [7].
In this paper, the study is cross-sectional. We only deal with inclusion measurements.
Flow cytometric analysis of peripheral blood lymphocytes
Peripheral blood samples were collected at each visit for systematic lymphocyte phenotyping of PHID patients under or not current immunoglobulin substitution. Blood samples from each contributing center were ana-lyzed centrally at the Bordeaux University Hospital Laboratory of Immunology, by flow cytometry using a FC500 flow cytometer from Beckman-Coulter.
All blood samples were withdrawn on EDTA anti-coagulant in Vacutainers 5 ml tubes (BD, Biosciences, Mountain View, CA) and kept at room temperature until processed. All samples were analyzed fresh follow-ing withdrawal within a workfollow-ing day. Followfollow-ing manu-facturer recommendations, labeling were carried out on whole blood and red blood cells lyzed at room temperature with a Versalyse (Beckman-Coulter, France, ref = A0937) lysing solution added with Iotest fixative so-lution (Beckman-Coulter, France, ref = A07800). Events were acquired with the dedicated CXP-1 software. In these settings, we did not use any viability staining.
Unless specified, all monoclonal antibodies were pur-chased from Beckman-Coulter (France) whose catalog
references are reported below and in Additional file 1: Table S1. We used the following panel of monoclonal antibodies (Mab):
– B cells subsets: anti- CD19 (ref: A07766), -CD27 (ref: 6607107), -CD21 (ref: PN IMU473U) and -sIgD (ref: 736000)
– CD8+ T-cell differentiation: anti-CD8 (ref: A07756), -CD45RA (ref: PN IM 271U), -CCR7 from R&D (Minneapolis, MN, USA ref: FAB197A)
– HLA-DR T-lymphocyte activation markers, we used the following panel of Mab: anti-CD45, -3, -4 and -8 (ref: 6607013) -HLA-DR (ref: PNA40579).
– CD25 T-lymphocyte activation marker: anti-CD3, -4 and -8 (ref: 6607013) -CD25 (ref: IM2646)
– CD28 T-lymphocyte activation marker: anti-CD3, -4 and -8 (ref: 6607013) -CD28 (ref: 6607108)
– CD38 T-lymphocyte activation marker: anti-CD3, -4 and -8 (ref: 6607013) -CD38 (ref: A07780)
– regulatory T-cell: anti-CD4 (ref: A07750), -CD25 (ref: IM2646) -CD127 (ref: PN IM1980U) – NK and B cells: anti-CD45, -56, -19 and -3
(ref: 6607073) -CD16 (ref: A07766)
– myeloid and plasmacytoid dendritic cells, we used the Beckman Coulter kit (ref: A23413 for mDC and A23416 for pDC).
– T cells expressing the gamma/delta TCR: anti-Vdelta2 (ref: PN IM1464) and anti-pan-delta (ref: PN IM1418U).
T and B-cell subpopulation counts were obtained using the flow count beads kit from Beckman-Coulter Flow Count (ref: 7547053) following a lyse and no wash procedure according to the manufacturer's recommen-dations. Markers of CD4+ T-cell differentiation were not performed in this study.
Results are expressed as percentages of total circulating lymphocytes or of CD19+, CD3+, CD4+ or CD8+ lym-phocytes as appropriate, and/or absolute counts in cells/ mm3 as appropriate. An exception are dendritic cells, whose numbers are expressed per milliliter of blood, ob-tained by calculations from the leukocyte count.
Concerning the gating strategies, as examples, we choose to show in Additional file 2: Figure S1, the gating strategy used to assessed CD3+, CD3 + CD4+, CD3 + CD8+, and the proportion of cells expressing HLA-DR among these subsets: in Panel A, applied to a normal healthy donor whereas, in Panel B, applied to a CVID patient. Panel C depicts the B/NK cells phenotyping of the CVID patient.
Statistical analyses
Analyses were performed using SAS® 9.1 (SAS Institute, Inc., Cary, NC) and XLSTAT® 2010 software (Addinsoft,
Paris, France). Clinical and therapeutic data were de-scribed as numbers and percentages. Immunoglobulin serotypes and immunological markers were described as medians and InterQuartile Range values (IQR). We con-ducted multidimensional exploratory analyses (principal component analysis and cluster analysis) to study the links between immunological markers and clinical char-acteristics. To run the multidimensional exploratory ana-lyses, CD19+ B cells, CD3+, CD4+, CD8+ T cells, regulatory T cells, NK cells and gamma/delta T-cells have been used in absolute counts (cells/mm3). CD3 + HLA-DR + activated T cells have been used in percentages of CD3+, CD4 + HLA-DR + in percentages of CD4+, and CD8 + HLA-DR + in percentages of CD8+. Differentiation markers of T-cells and CD8 + CD57+ have been used in percentages of CD8+ and differentiation markers of B-cells have been used in percentages of CD19+. Numbers of dendritic cells were expressed per milliliter of blood and gamma/delta2 T-cells in percentages of gamma/delta T-cells. The use as absolute numbers or percentage has been defined before performing any statistical analyses (see Tables with each immunological marker for a sum-mary of the units used to run the multidimensional ex-ploratory analyses). Robustness analyses have been performed using absolute count in place of percentage and vice versa and results were not substantially different.
Principal component analysis
Principal Component Analysis (PCA) is an unsupervised dimension-reduction method that generates Principal Components (PC), that are linear combinations of the original variables [25] (in our case, represented by differ-entiation, activation and regulation markers of B and T-lymphocytes, natural killer cells, dendritic cells and T-cells expressing a gamma/delta TCR). Each compo-nent explains a part of the variability of the data. We used 2D plots to project data on the plane spanned by the first two components to display 23 immunological markers involved in PHID (missing data excluded). As data run in the principal component analysis have been normalized as referred to the sample (minus sample mean and divided by standard deviation), data are presented on a unit correlation circle of radius 1 (see Figure 1). Because each component is a weighted linear combination of the original variables, a compo-nent may have a meaning according to the contribution of each immunological marker. We chose to present the plan spanned by the two major principal components because they explained the most, variability of data (> 10%). On this plan, the contribution of markers is un-equal and depends on the contribution of each marker on each axis. A given marker may contribute on the third axis and therefore would not be well represented on the first two axes. PCA was also performed in CVID
patients. A PCA on markers of 12 healthy donors is given in Additional file 3: Figure S2.
Cluster analysis
Hierarchical clustering is a common method used to de-termine clusters of similar data points [26]. Ward’s hier-archical clustering method was used here [27]. This method aggregates consecutively the patients presenting the closest immunological characteristics, by maximizing inter-class variance using Ward’s criterion. This process leads to the construction of a classification tree (patients with missing immunological data excluded), which allowed us to identify some distinct subgroups of PHID patients. The projection of the identified clusters onto the first two principal components then helped us characterize them according to immunological markers. A cluster analysis was also performed in CVID patients.
PHID complication analyses
PHID complications were described in each subgroup of patients identified by the cluster analysis in order to pro-vide clinical-immunological links. These complications are those defined by H Chapel et al. [6] to distinguish different clinical phenotypes (autoimmunity, lymphoid hyperplasia
and chronic enteropathy) and granulomatous disease and splenomegaly in addition [12]. Univariable logistic regres-sion was performed to study the association between PHID complications and the 23 immunological markers (variables with a p-value < 0.25 were further tested). A forward-selection procedure was used to build a final mul-tivariable model. The first marker included in the model was the most significant in univariable analysis. The next variable included was the one with most significant associ-ation with complicassoci-ations in the remaining set and so on until any additional marker became non significant. As the immunological markers in our study were expressed in different units, we reported the Odds Ratio (OR) per 1 standard deviation for a unit free representation.
CVID substudy
The most consensual classification in symptomatic PHID concerns CVID. EUROclass [5] is the classification com-monly used in CVID, segregating patients with nearly absent B cells (less than 1%), severely reduced switched memory B cells (less than 2%), and expansion of CD21lowB cells (more than 10%). To evaluate if T-cell markers could improve this classification [28], we evaluated the improvement in predict-ive value for CVID complications by a net reclassification
PC1 (27%)
Figure 1 23 immunological markers involved in PHID, plotted on the first two Principal Components (PC). ALTADIH Cohort, 2007-2010. Immunological markers are well represented by the component when they are far from the center and close to the corresponding axis. Two markers are: 1) positively correlated if close to each other; 2) not correlated if in a rectangular position; 3) negatively correlated if on the opposite side.
approach [29]. To do so, we estimated predicted probabi-lities of CVID complications using two models: one with EUROclass, the other with EUROclass and CD8+ HLA-DR + (the most significantly associated in our analyses). Based on these two models, we categorized the predicted probabilities into two clinical meaningful categories (probability < 50% or ≥ 50%) and cross-tabulated the clas-sifications. The improvement in reclassification can be quantified as the sum of differences in proportion of indi-viduals moving up minus the proportion moving down for people who developed complications and the proportion of individuals moving down minus the proportion moving up for people who didn’t develop complications. Predict-ive capacity was also evaluated using the area on the re-ceiving operating characteristics curve (c statistics).
Results
Patient characteristics
Sociodemographic and clinical characteristics
Between January 2007 and March 2010, 81 PHID patients were enrolled in the ALTADIH Cohort (among whom 33 were also included in the DEFI Cohort), including 57 CVID patients, 21 IgG subclass deficit patients and 3 patients with
Good’s syndrome. At the time of evaluation, none of the PHID patients had evidence of an acute infection. The ma-jority of patients were followed at the Bordeaux University Hospital (66 patients). Baseline epidemiological and clinical characteristics are reported in Table 1. Of the 81 patients, 59% were women. The median age at PHID diagnosis was 41 years old (IQR: 35–54). The most frequent symptoms in disease histories were respiratory tract infections. Altogether, 38% of the patients developed one or more complications: splenomegaly, autoimmune manifestations, granulomatous disease, lymphoid hyperplasia and/or chronic enteropathy (Table 1). More than 80% of the patients were given subcutaneous or intravenous im-munoglobulin substitution regimen.
Biological characteristics
Immunoglobulin serum levels before substitution for IgG, IgA and IgM in PHID patients were significantly reduced: baseline levels IgG (median: 4.3, IQR: 3.1–5.3 g/L; normal range: 6.6–12.8 g/L), IgA (median: 0.5, IQR: 0.05–1.2 g/L; normal range: 0.7–3.4 g/L), IgM (median: 0.4, IQR: 0.2– 0.8 g/L; normal range: 0.5–2.1 g/L). Specifically, in CVID patients, median baseline IgG was 3.8 g/L (IQR: 1.7-4.4 g/L),
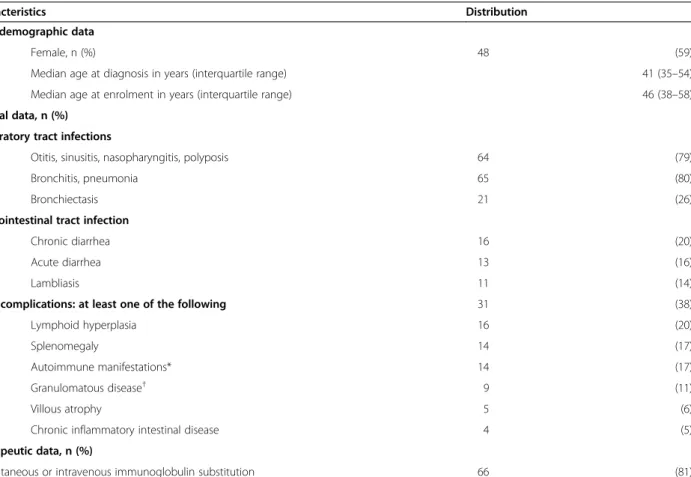
Table 1 Baseline characteristics of 81 PHID patients, ALTADIH Cohort, 2007-2010
Characteristics Distribution
Sociodemographic data
Female, n (%) 48 (59)
Median age at diagnosis in years (interquartile range) 41 (35–54) Median age at enrolment in years (interquartile range) 46 (38–58) Clinical data, n (%)
Respiratory tract infections
Otitis, sinusitis, nasopharyngitis, polyposis 64 (79)
Bronchitis, pneumonia 65 (80)
Bronchiectasis 21 (26)
Gastrointestinal tract infection
Chronic diarrhea 16 (20)
Acute diarrhea 13 (16)
Lambliasis 11 (14)
PHID complications: at least one of the following 31 (38)
Lymphoid hyperplasia 16 (20) Splenomegaly 14 (17) Autoimmune manifestations* 14 (17) Granulomatous disease† 9 (11) Villous atrophy 5 (6)
Chronic inflammatory intestinal disease 4 (5) Therapeutic data, n (%)
Subcutaneous or intravenous immunoglobulin substitution 66 (81)
*Autoimmune anemia, autoimmune neutropenia, autoimmune thrombocytopenia, Hashimoto thyroiditis, Goujerot-Sjögren syndrome.
†
median baseline IgA was 0.3 g/L (IQR: 0.05-1.00 g/l) and median baseline IgM was 0.3 g/L (IQR: 0.1-0.6 g/L). Base-line immunological marker values in PHID patients are reported in Table 2 (values of normal patients are reported in Additional file 4: Table S2). Some patients were included in ALTADIH at diagnosis, before the introduction of IgG replacement therapy, and had a longitudinal follow-up of their immunological parameters. The replacement therapy did not change the values of these parameters on two years of monitoring.
Principal component analysis of differentiation, activation and regulation markers of B and T-lymphocytes, natural killer cells, dendritic cells and T-cells expressing a gamma/delta TCR
For studying the association between the various im-munological markers reported in the pathogenesis of
PHID, statistical analyses would have been hampered by the high number of markers studied, some of them be-ing highly correlated (e.g. activation markers). In order to circumvent these biases, we used PCA to reduce the multidimensionality of the dataset and capture immuno-logically relevant information. The first two principal components accounted for 43% of the variability among immunological markers (Figure 1). The first principal component, accounting for 27% of the marker variabil-ity, separated regulatory T-cells from activated cells (HLA-DR + on CD3+, CD4+ and CD8+ grouped to-gether) and CD19 + CD27 + IgD- switched memory B cells from CD19 + CD27-IgD + naïve B cells. The second principal component, which accounted for 16% of vari-ability, mainly represented T-cell differentiation, oppo-sing CD45RA + CCR7+ naïve CD8+ T cells and CD45RA + CCR7- terminal effector CD8+ T cells. Activated CD3+,
Table 2 Baseline immunological marker values of 81 PHID patients, ALTADIH Cohort 2007-2010
Unit Median IQR
Total circulating lymphocytes (TCL) cells/mm3 1384 (1017, 2000)
B cells CD19+ cells/mm3 128 (62, 193)
% TCL 9.37 (6.21, 12.91)
Naïve CD27-IgD+ % CD19+ 74.01 (56.42, 83.35)
Switched CD27-IgD- % CD19+ 2.62 (1.86, 5.16)
Marginal zone CD27 + IgD+ % CD19+ 9.42 (4.70, 15.37) Switched memory CD27 + IgD- % CD19+ 8.07 (3.63, 19.45)
T cells CD3+ cells/mm3 1078 (746, 1585) CD4+ cells/mm3 657 (422, 941) CD8+ cells/mm3 329 (228, 524) CD4+/CD8+ ratio 1.99 (1.30, 2.70) CD8+ T cells Naïve CD45RA + CCR7+ % CD8+ 18.01 (6.79, 36.07) Central memory CD45RA-CCR7+ % CD8+ 1.25 (0.59, 2.48) Effector memory CD45RA-CCR7- % CD8+ 34.39 (24.47, 46.90) Terminal effector CD45RA + CCR7- % CD8+ 33.48 (23.31, 48.26) Immunosenescent CD8 + CD57+ % CD8+ 15.97 (8.04, 31.75) Activated T cells
HLA-DR CD3 + HLA-DR+ % CD3+ 12.87 (7.99, 20.37) CD4 + HLA-DR+ % CD4+ 7.96 (5.14, 13.79) CD8 + HLA-DR+ % CD8+ 24.49 (14.31, 41.11) Regulatory T cells CD4 + CD25 + CD127- cells/mm3% TCL 32 1.10 (16, 63) (0.51, 1.76) Natural Killer cells CD3-CD16 + CD56+ cells/mm3 126 (75, 194) Dendritic cells
Myeloid mDC /ml 9381 (6597, 15611)
Plasmacytoid pDC /ml 4671 (2810, 7427)
Gammadelta cells cells/mm3 33 (15, 72)
Gammadelta 2 cells % GD 56.32 (22.19, 77.17)
CD4+ and CD8+ T cells expressing HLA-DR + were positively correlated to each other in PCA (Spearman rank correlation coefficient r = 0.88 between CD3+ HLA-DR + and CD4+ HLA-DR+; r = 0.90 between CD3+ HLA-DR + and CD8+ HLA-DR+; r = 0.70 be-tween CD4+ HLA-DR + and CD8+ HLA-DR+). HLA-DR + activation markers were also correlated to CD45RA + CCR7-terminal effector CD8+ T cells and to CD8 + CD57+, known to be a marker of senescence [30]. Hence, this first analysis and an additional analysis extended to 38 markers available on 72 patients including CD21+ B cells (see Additional file 5: Figure S3) led us to conclude that all activation markers were highly correlated and one of them could be chosen to reflect alone the T-cell activation process. In addition, the first two components defined an upper-left corner grouping HLA-DR + activa-tion markers with CD45RA + CCR7- terminal effector CD8+ T cells and the CD8 + CD57+ senescence marker.
PCA using 23 immunological markers of CVID pa-tients only (excluding IgG SubClass Immuno deficient and Good`s patients) gave consistent results as those ob-served with the whole PHID population.
Classification of PHID patients according to cluster analysis
Next, an unsupervised classification was performed to de-fine groups of patients that would be more homogeneous
according to immunological markers. Hierarchical cluster analysis could be performed for 79 PHID patients of the 81 in the ALTADIH cohort (2 CVID patients not classi-fied). Based on cubic clustering criterion, we would have chosen two clusters but the identification of five popula-tions of PHID patients, as revealed by the five branches of the tree down stream (Figure 2), was chosen as these five clusters were clinically relevant. Clusters 1 and 2, made up by patients with CVID or IgG subclass immunodeficiency, were grouped together, separated from clusters 3, 4 and 5, mainly made up by patients with CVID or either Good’s syndrome. In the cluster analysis in CVID diagnoses (excluding patients with Good’s syndrome and IgG sub-class immunodeficiency), the patients were grouped in the same way than in the previous cluster analysis performed on the whole population (identification numbers of CVID patients given for detailed parallel between Figure 2 and Additional file 6: Figure S4).
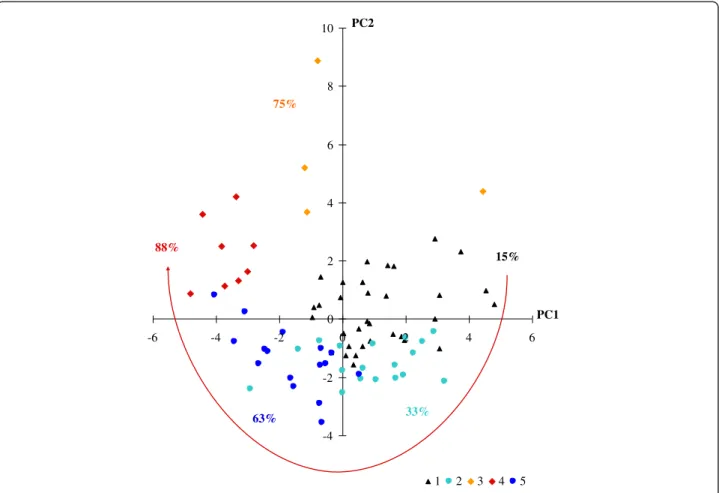
The projection of PHID patients, classified in the above 5 defined clusters, onto the plan spanned by the first two principal components led to define their im-munological characteristics (Figure 3 that needs to be read in conjunction with Figure 1; Table 3). For example, patients plotted in the upper-left corner of Figure 3, mainly patients of cluster 4, are characterized by vari-ables plotted in the same quadrant in Figure 1, in particular HLA-DR + markers. Thus, the 33 patients making up cluster 1 (23 CVID patients and 10 IgG SD
1
2
3
4
5
33
18
4
8
16
Clusters
15%
33%
75%
88%
63%
n patients
PHID complications
Figure 2 Classification of 79 PHID patients by hierarchical cluster analysis, according to 23 immunological markers. ALTADIH Cohort, 2007-2010. The arrow defines the number of clusters. Patients with IgG subclass immunodeficiency are depicted in green. Patients with Good’s syndrome are depicted in blue. Other patients are CVID patients. The percentage of PHID complications by cluster is indicated.
patients) were characterized by normal innate and adap-tive immunity. They were represented on the upper-right corner that grouped innate cells, CD19+ B-cells, CD19 + CD27 + IgD- switched memory B-cells, CD3+, CD4+, CD8+ T-cells, and regulatory T-cells (Figure 1). Cluster 2 (lower-right corner, Figure 3) represented 18 patients (8 CVID patients and 10 IgG SD patients) char-acterized by increased naïve CD8+ T-cells. Cluster 1 and cluster 2 looked similar and were combined in an up stream clustering. Cluster 3 (1 patient with Good’s syndrome and 3 CVID patients) and cluster 4 (8 CVID patients) were characterized by an increase of HLA-DR + activation, ter-minal effector CD8+ T cells and immunosenescence marker (Table 3). As expected, these patients were repre-sented in the upper-left corner near CD3+, CD4+ and CD8+ T cells expressing HLA-DR+, CD45RA + CCR7-terminal effector CD8+ T cells, and the CD8 + CD57+ marker (Figure 1). In cluster 3, one CVID patient had been splenectomized before enrolment (in 2001). In this patient, splenectomy deeply affects the absolute numbers but not grossly the percentages of the lymphocyte subpop-ulations in the blood. In parallel, the patient with Good’s
syndrome in cluster 3 was differently plotted, i.e. in the upper-right corner near CD8+, reflecting the high blood CD8+ T-cell absolute numbers known in Good’s syn-drome. Cluster 5 (lower-left corner, Figure 3) consisted of 16 patients with B-cell deficiency (13 CVID, 1 IgG SD and 2 Good’s syndrome): the lower-left corner where no immunological parameters are plotted has to be inter-preted as the symmetrical and diagonal opposite of the upper-right corner. Thus, the meaning of cluster 5 (lower-left corner, Figure 3) is a cluster gathering B-cell deficiencies because the patients are plotted on the op-posite corner of the plot of CD19+, CD27 + IgD+, CD27 + IgD-, CD27-IgD- which all are markers plotted in the upper-right corner. Table 3 confirms the given interpretation of the clusters.
PHID complications according to clusters and T-cell activation
Interestingly, the proportion of patients with PHID compli-cations (information not used in the previous analysis) var-ied significantly between the clusters: 15%, 33%, 75%, 88% and 63% in clusters 1 to 5 respectively (Figure 3, Table 4). -4 -2 0 2 4 6 8 10 -6 -4 -2 0 2 4 6 PC1 PC2 1 2 3 4 5 63% 88% 75% 15% 33%
Figure 3 Immunological interpretation of 5 clusters of CVID plotted on the first two principal components. ALTADIH Cohort, 2007-2010. The percentage of CVID complications, noted next to the clusters, increased in a clockwise manner as phenotypes approach the projection of activated HLA-DR + markers plotted in Figure 1 (red arrow).
As shown by the dendrogram (Figure 2), clusters 3, 4 and 5 were closer to each other than clusters 1 and 2, in which the rate of complications was the lowest. Among the 8 pa-tients in cluster 4, 7 (88%) presented with a splenomegaly (14 splenomegaly recorded in the cohort) and 4 (50%) with a granulomatous disease (9 granulomatous diseases re-corded in the cohort). Patients in cluster 5, characterized by a severe loss of switched memory B cells, also presented a high percentage of complications (63%) (Figure 3, Table 4). In Figure 3, the highest percentages of complications (from clusters 3 and 4) are in the upper-left corner, and the lowest (from cluster 1) on the upper-right. Hence, visually, compli-cation rates increased in a clockwise manner.
To quantify the independent effects of immunological markers, we then performed a supervised analysis based on a logistic regression model. As the activated HLA-DR + CD3+, CD4+ and CD8+ T-cells were correlated positively in the PCA, CD8+ HLA-DR + was chosen for the ascendant multivariable analysis (as it was the most significantly associated with PHID complications in uni-variable analysis (Table 5). The final model contained the following three markers. Increased CD8+ HLA-DR + T-cells were strongly associated with PHID complications (odds ratio per one standard deviation = 2.55; confidence interval [1.33; 4.89]; p-value = 0.0047). Both decreased plasmacytoid dendritic cells (odds ratio per one standard
Table 3 Baseline immunological characteristics of 5 clusters of 79 PHID patients, ALTADIH Cohort, 2007-2010 Cluster 1 Cluster 2 Cluster 3 Cluster 4 Cluster 5
n = 33 n = 18 n = 4 n = 8 n = 16 IgG g/L 4.37 (3.80, 5.32) 5.73 (4.7, 6.3) 4.68 (2.69, 5.29) 1.44 (0.30, 2.71) 3.69 (1.65, 4.22) IgA g/L 0.63 (0.14, 1.62) 1.02 (0.07, 1.55) 0.60 (0.04, 2.09) 0.15 (0.01, 0.43) 0.19 (0.05, 0.79) IgM g/L 0.55 (0.31, 1.09) 0.48 (0.24, 0.78) 0.54 (0.34, 0.62) 0.16 (0.05, 0.42) 0.27 (0.20, 0.47) B cells CD19+ cells/mm3 157 (128, 244) 128 (102, 211) 49 (20, 87) 122 (94, 176) 51 (29, 119) CD27-IgD+ % CD19+ 68.85 (52.03, 74.47) 68.89 (57.94, 77.24) 49.52 (10.73, 80.43) 90.89 (82.94, 93.31) 84.03 (70.93, 90.82) CD27-IgD- % CD19+ 2.80 (2.18, 4.38) 3.90 (2.24, 6.42) 6.13 (2.64, 23.40) 2.40 (1.67, 2.58) 2.65 (1.72, 4.22) CD27 + IgD+ % CD19+ 15.01 (10.11, 23.19) 10.53 (4.42, 13.73) 5.67 (2.43, 8.57) 3.57 (2.21, 7.20) 4.92 (1.32, 7.92) CD27 + IgD- % CD19+ 14.39 (7.08, 20.05) 13.93 (7.26, 24.33) 7.77 (2.43, 19.38) 2.55 (0.94, 3.91) 2.97 (0.36, 6.66) T cells CD3+ cells/mm3 1363 (1076, 1787) 1045 (883, 1456) 2756 (1472, 4183) 831 (658, 1075) 579 (407, 837) CD4+ cells/mm3 835 (571, 1214) 789 (573, 967) 848 (609, 1227) 382 (302, 565) 308 (244, 565) CD8+ cells/mm3 477 (358, 604) 270 (159, 383) 1621 (710, 2682) 293 (196, 362) 213 (141, 266) CD4+/CD8+ ratio 1.89 (1.45, 2.42) 2.77 (2.31, 4.08) 0.60 (0.42, 1.06) 1.26 (0.67, 2.65) 1.89 (1.17, 2.61) CD8+ T cells CD45RA + CCR7+ % CD8+ 19.05 (11.11, 34.59) 28.47 (13.32, 43.67) 1.52 (0.56, 2.75) 4.91 (1.53, 53.19) 35.56 (10.29, 53.19) CD45RA-CCR7+ % CD8+ 0.83 (0.46, 1.90) 4.60 (1.96, 7.97) 0.53 (0.21, 0.82) 0.82 (0.30, 1.20) 1.37 (0.85, 1.96) CD45RA-CCR7- % CD8+ 31.28 (24.26, 36.96) 43.13 (32.60, 57.14) 36.82 (16.56, 57.25) 39.24 (30.69, 59.20) 29.14 (17.47, 42.55) CD45RA + CCR7- % CD8+ 41.48 (32.61, 52.32) 22.30 (16.87, 27.10) 40.75 (13.96, 59.90) 48.28 (30.47, 63.41) 29.25 (18.76, 39.37) CD8 + CD57+ % CD8+ 17.52 (9.42, 30.97) 7.38 (4.41, 15.97) 27.36 (19.36, 47.30) 39.61 (33.78, 51.16) 13.51 (8.35, 23.44) Activated T cells CD3 + HLA-DR+ % CD3+ 12.04 (7.62, 16.95) 9.87 (7.11, 12.83) 52.00 (32.71, 59.56) 46.56 (40.76, 57.25) 13.65 (6.19, 20.33) CD4 + HLA-DR+ % CD4+ 5.88 (4.94, 9.17) 6.75 (4.95, 9.13) 48.30 (26.32, 56.25) 43.87 (30.88, 49.95) 11.54 (6.52, 18.33) CD8 + HLA-DR+ % CD8+ 25.48 (14.86, 31.93) 19.73 (14.18, 26.44) 53.48 (37.05, 65.52) 62.14 (47.01, 76.39) 15.12 (10.65, 28.64) Regulatory T cells cells/mm3 54 (33, 76) 41 (24, 82) 18 (13, 22) 19 (12, 24) 15 (8, 18)
NK cells cells/mm3 143 (100, 214) 174 (121, 230) 268 (146, 388) 75 (55, 103) 41 (26, 70)
Dendritic cells
Myeloid /ml 11940 (8751, 17805) 11422 (6616, 13457) 9122 (5662, 29989) 7795 (4086, 10548) 5420 (4107, 9683) Plasmacytoid /ml 7217 (4801, 11084) 6152 (3599, 9836) 2771 (1766, 8490) 3073 (1351, 3618) 2766 (2194, 4255) Gammadelta cells cells/mm3 44 (20, 74) 27 (11, 54) 396 (178, 579) 19 (6, 92) 16 (9, 26)
Gammadelta 2 % GD 62.96 (40.85, 73.68) 78.71 (75.00, 89.39) 13.40 (8.77, 30.62) 6.59 (4.09, 25.61) 25.00 (12.41, 55.96)
deviation = 0.49; confidence interval [0.25; 0.96]; p value = 0.0363) and decreased switched memory B cells (odds ra-tio per one standard deviara-tion = 0.51; confidence interval [0.28; 0.94]; p value = 0.0312) were also associated with PHID complications.
Classification of CVID patients according to EUROclass and CD8+ HLA-DR + marker
In symptomatic PHID, the only disease for which a con-sensual classification exists is CVID. Among the 57 CVID patients in the ALTADIH cohort, EUROclass dis-tinguishes 1 patient with equal or less than 1% of B cells of lymphocytes (B- group) from the 56 patients with a higher percentage (B + group). B + patients were divided into 15 patients with severe deficiency of class-switched memory B cells (≤ 2% of B cells, smB- group) and 40 pa-tients with more than 2% of class-switched memory B cells (smB + group). The smB status of one patient could not be evaluated. EUROclass also discriminates between patients according to the expansion of CD21low B cells: above or below 10% within B cells (CD21low versus CD21norm). In our study, among 14 PHID patients with splenomegaly, 11 (79%) were classified in the CD21lowgroup.
As we found a strong association between PHID compli-cations and increased CD8+ HLA-DR + T-cells (expressed as percentages of CD8+ lymphocytes) and because CD8+ HLA-DR + has been involved in CVID [12], we examined whether the inclusion of CD8+ HLA-DR + in addition to EUROclass criteria, would improve the prediction of CVID complications (Table 6). Among 19 patients with CVID complications and classified with less than 50% risk using EUROclass, 10 were reclassified with a risk greater than 50% when adding the CD8+ HLA-DR + activation marker. Moreover, the addition of CD8+ HLA-DR + to the model increased its predictive value (c statistic 0.57 without
CD8+ HLA-DR + versus 0.77 with CD8+ HLA-DR+, a value close to 1 indicating a good prediction). Specifically, adding CD8 + HLA-DR + to EUROclass model leads to a substantial increase in sensitivity (from 24% to 60%) and some loss of specificity (from 90% to 80%) (Additional file 7: Tables S3 and Additional file 8: Table S4).
Discussion
In the present study, we focused on three PHID in adults with symptomatic implications: CVID, IgG SD and Good’s syndrome (referred in the 2011 update of Primary Immunodeficiency by the International Union of Immunological Societies [1]). We used unsupervised and supervised statistical methods on a cohort of 81 PHID patients in an attempt to select relevant markers that may be useful for diagnosis and prognosis of these patients.
Our rationale to pool patients diagnosed with CVID, IgG SubClass Immuno deficient and Good`s patients, and thus, to include in the ALTADIH cohort the active file of PHID patients with symptoms in Aquitaine, South-Western France, was based on the following argu-ments: 1) Because of its complexity, distinguishing pa-tients with symptomatic PHID can be challenging for the diagnosis and the treatment. That is why we did not focus only on CVID patients, and we wanted to address the symptomatic PHID population seen in clinical rou-tine practice by physicians, including IgG SubClass Immuno deficient patients as well as Good's patients; 2) Literature on IgG subclass deficiency is poor and im-munological characteristics of these patients have not been explored as they have been in CVID. Indeed, IgG subclass deficiency may progress to have typical CVID [3]. Thus, the study of both CVID and IgG subclass defi-ciency in a combined analysis was a novel aspect of our
Table 4 Type of PHID and PHID complications in 5 clusters of 79 PHID patients, ALTADIH Cohort, 2007-2010
Cluster 1 Cluster 2 Cluster 3 Cluster 4 Cluster 5 n = 33 n = 18 n = 4 n = 8 n = 16
n % n % n % n % n %
Type of PHID
CVID 23 (70) 8 (44) 3 (75) 8 (100) 13 (82)
IgG subclass deficiency 10 (30) 10 (56) 0 (0) 0 (0) 1 (6) Good’s syndrome 0 (0) 0 (0) 1 (25) 0 (0) 2 (12) PHID complications (at least one of the following) 5 (15) 6 (33) 3 (75) 7 (88) 10 (63) Lymphoid hyperplasia 2 (6) 5 (28) 1 (25) 3 (38) 5 (31) Splenomegaly 1 (3) 2 (11) 1 (25) 7 (88) 3 (19) Autoimmune manifestations 3 (9) 1 (5) 1 (25) 2 (25) 7 (44) Granulomatous disease 0 (0) 1 (5) 2 (50) 4 (50) 2 (13) Villous atrophy 0 (0) 2 (11) 0 (0) 0 (0) 3 (19) Chronic inflammatory intestinal disease 0 (0) 2 (11) 1 (25) 1 (13) 0 (0)
work; 3) Good syndrome (thymoma with immunodefi-ciency) was listed as a predominantly antibody deficiency in the 2009 update of Primary Immunodeficiency by the International Union of Immunological Societies [1]. Based on our view to include eligible patients with symptomatic PHID seen in routine clinical practice and this pivotal article, we do not have any arguments to ex-clude it from eligibility criteria.
First, PCA gave some insight to the association be-tween the 23 immunological markers measured. An in-crease in the proportion of HLA-DR + T-cell as an indication for activation, positively correlated to an in-crease in CD45RA + CCR7- terminal effector CD8+ T-cells and to the CD8 + CD57+ immunosenescence marker, defined one group of markers. In parallel, a de-fect in B-cell differentiation (increased CD19 +
CD27-IgD + naïve B cells and by symmetry, decreased CD19 + CD27 + IgD- switched memory B cells) might identify another distinct pathway. The PCA gave the opportunity to explore and to observe graphically the links between immunological markers and we made the choice to present the plane spanned by the two first principal components because they explained the most the data variability (43%). Next, we performed a hierarchical clus-ter analysis on the basis of the cell profile under investi-gation. As it was more relevant biologically, cluster analysis was performed with immunological markers ra-ther than with principal components. Thus, the variance left on other principal components was not an obstacle for the cluster analysis.
The cluster analysis separated five major groups in our PHID population with distinct rates of complications.
Table 5 Immunological markers association with CVID complications
Unit Odds ratio 95% confidence interval p-value B cells CD19+ cells/mm3 0.65 [0.36; 1.15] 0.1373 CD27-IgD+ % CD19+ 1.49 [0.89; 2.48] 0.1310 CD27-IgD- % CD19+ 0.54 [0.24; 1.23] 0.1401 CD27 + IgD+ % CD19+ 0.62 [0.34; 1.12] 0.1124 CD27 + IgD- % CD19+ 0.93 [0.29; 0.86] 0.0119 T cells CD3+ cells/mm3 0.68 [0.40; 1.17] 0,1646 CD4+ cells/mm3 0.45 [0.26; 0.78 ] 0,0046 CD8+ cells/mm3 1.04 [0.66; 1.62 ] 0.8818 CD4+/CD8+ ratio 0.99 [0.63; 1.56 ] 0.9649 CD8+ T cells CD45RA + CCR7+ % CD8+ 0.69 [0.43; 1.13] 0.1385 CD45RA-CCR7+ % CD8+ 0.75 [0.46; 1.25] 0.2710 CD45RA-CCR7- % CD8+ 1.38 [0.86; 2.20] 0.1800 CD45RA + CCR7- % CD8+ 0.77 [0.48; 1.23] 0.2666 CD8 + CD57+ % CD8+ 1.30 [0.83; 2.06] 0.2567 Activated T cells CD3 + HLA-DR+ % CD3+ 2.99 [1.56; 5.73] 0.0010 CD4 + HLA-DR+ % CD4+ 2.70 [1.40; 5.23] 0.0032 CD8 + HLA-DR+ % CD8+ 2.75 [1.54; 4.90] 0.0006
Regulatory T cells cells/mm3 0.41 [0.22; 0.78] 0.0065 Natural Killer cells cells/mm3 0.75 [0.46; 1.21] 0.2369 Dendritic cells
Myeloid /ml 0.65 [0.36; 1.17] 0.1532
Plasmacytoid /ml 0.37 [0.18; 0.73] 0.0046
Gammadelta cells cells/mm3 1.30 [0.79; 2.13] 0.3028
Gammadelta 2 cells % GD 0.52 [0.32; 0.85] 0.0087
Univariable logistic regression analysis (Odds ratio per 1 standard deviation). ALTADIH Cohort, 2007-2010.
Particularly, patients in cluster 5 (13 with CVID, 1 with IgG SD and 2 with Good’s syndrome), 63% of whom suffering PHID complications, were characterized by a severe loss of CD19 + CD27 + IgD- switched memory B-cells whereas patients in clusters 3 and 4, mainly with CVID (75% and 88% of whom having PHID complica-tions, respectively) were characterized by increased HLA-DR + activation of T-cells. Regarding available data for activated T cells or B cell subsets for 12 normal healthy donors (Additional file 4: Table S2) and data from PHID patients in Table 3, activated T cells were higher in PHID patients from clusters 3 and 4, and switched memory B cells were particularly lower in PHID patients from clusters 4 and 5. Furthermore, the strong association we found between PHID complica-tions and increased CD8+ HLA-DR + T-cells reinforced the importance of the link between T-cell activation and clinical complications. More importantly, in a substudy with CVID patients, the classification that added CD8+ HLA-DR + to EUROclass was superior to the EUROclass model in predicting CVID complications. The advantage of adding CD8+ HLA-DR + to EUROclass resulted in a substantial increase of sensitivity and some loss of speci-ficity to determine CVID complications. As a consensus does not exist for the cut-off of probability, we explored a threshold of 50% (Additional file 7: Tables S3, Additional file 8: Table S4).
Our results on switched memory B-cell defect, defin-ing PHID cluster 5 in particular, are consistent with pre-vious findings on B-cell phenotype in PHID [4,5,9,10]. Our study also highlights the importance of considering T-cell activation [12,13] in PHID (clusters 3 and 4 with increased T-cell activation with the highest percentage of complications, comprising mainly CVID patients and
the three patients with Good’s syndrome identified in our cohort as PHID types). Moreover, the occurrence of two complications considered in addition to those de-fined by H Chapel et al. [6] (ie: splenomegaly and granu-lomatous disease) were found with the highest frequency in the clusters 3 and 4 with increased T-cell activation, suggesting that the HLA-DR + activation marker could help to discriminate them. However, this cross-sectional analysis of data from the ALTADIH cohort does not allow us to determine whether increased T-cell activa-tion is a causal factor of PHID progression or if it is in-duced by PHID complication. Only longitudinal analyses of activation markers would help in deciphering the role of T-cell activation, determining whether or not patients with normal phenotype will progress to an abnormal phenotype and will develop complications. Adding T-cell parameters for discriminating PHID patients is import-ant to better dissect these heterogeneous syndromes. This has been previously suggested in CVID [31] by sev-eral authors especially the Rome group [11] (Giovannetti et al.) as well as the Czech group [32] (Vlková et al.) and the French DEFI group [7] (Mouillot et al.). These au-thors suggested CD4 naïve T cell percentage as add-itional marker in CVID. Markers of CD4+ T-cell differentiation were not performed in our study. At the time of research protocol writing, set up in 2005, the im-portance of CD4+ T-cell differentiation has not been re-ported in PHID literature as it would be few years later. Thus, markers of CD4+ T-cell differentiation have not been planned in the ALTADIH protocol and the pro-spective design of the study did not allow for this B-cell marker to be assessed afterwards. This is a clear limita-tion of the study. However, previous authors also highlighted that a decrease of naive CD4 cells was also
Table 6 Reclassification of 55 CVID patients smB+/-, separated according to experience of complications
Model with EUROclass Model with EUROclass and CD8+ HLA-DR+ Total Predicted probabilities (%) < 50% ≥50%
Patients who experienced CVID complications
< 50% 9 19
≥ 50% 1 5 6
Total 10 15 25
Patients who didn’t experience CVID complications
< 50% 22 5 27
≥ 50% 2 1 3
Total 24 6 30
ALTADIH Cohort, 2007-2010.
The agreements between the two models for classifying the patients are depicted in gray. Adding CD8 + HLA-DR + to EUROclass model leads to better determine CVID complications for 10 patients who experienced CVID complications (upward movement in category for patients who experienced CVID complications) and to better determine the absence of CVID complications for 2 patients who did not experience CVID complications (downward movement in category for patients who did not experience CVID complications). In parallel, it leads to worsened classification for 1 patient who experienced CVID complications (downward movement in category for patients who did experience CVID complications) and 5 patients who did not experience CVID complications (upward movement in category for patients who did not experience CVID complications).
associated to T-cell activation and it would not be un-reasonable to consider T-cell activation as an indirect marker of decreased naive CD4 cells in our study. In addition, the signification of the memory status in the CD4+ compartment has been a subject of debates until recently as exemplified by Su LF, et al. [33].
Conclusion
To date, PHID diseases have only been examined through the analysis of separated compartments of the immune system. On this ground, our approach of combining a wide set of immunological markers using appropriate stat-istical methods for the high-dimensional is a novel aspect in PHID. The meaning of the identified clusters would need to be validated with a larger number of patients, for example the French national prospective Cohort DEFI [7]. It would be the opportunity to include markers of CD4+ T-cell differentiation in the analyses and consider potential other markers, as mucosal associated invariant T cells [34,35], recently reported in CVID [36].
In conclusion, by combining a wide set of immuno-logical markers, this study reveals that T-cell activation could be of additional value to discriminate patients with specific PHID features. Such information might have im-plications for diagnosis and clinical management. A sys-tematic recording of the HLA-DR + phenotype in every patient with PHID seems relevant.
Additional files
Additional file 1: Table S1. References of the panels of monoclonal antibodies used for identifying cells by flow cytometry using a FC500 flow cytometer from Beckman-Coulter.
Additional file 2: Figure S1. Gating strategies for for flow cytometric assessment of activated T-lymphocytes and other major lymphocyte sub-populations in the blood on a CVID patient.
Additional file 3: Figure S2. Immunological markers of 12 healthy donors, plotted on the first two principal components.
Additional file 4: Table S2. Immunological marker values of normal patients.
Additional file 5: Figure S3. Thirty-eight immunological markers involved in PHID on the two first principal components. ALTADIH Cohort, 2007-2010.
Additional file 6: Figure S4. Classification of 55/57 CVID patients by hierarchical cluster analysis, according to 23 immunological markers involved in the disease. ALTADIH Cohort, 2007-2010.
Additional file 7: Table S3. Sensibility [95% confidence interval] and specificity [95% confidence interval] of the model EUROclass to determine CVID complications with a probability ≥ 50% or < 50%. Additional file 8: Table S4. Sensibility [95% confidence interval] and specificity [95% confidence interval] of the model EUROclass and CD8+HLA-DR+ to determine CVID complications with a probability ≥ 50% or < 50%.
Abbreviations
CVID:Common Variable ImmunoDeficiency; GD: GammaDelta T cells; Ig: Immunoglobulin; IgG SD: IgG SubClass ImmunoDeficiency;
IQR: InterQuartile Range; mab: Monoclonal antibody; mDC: Myeloid dendritic
cells; NK: Natural Killer cells; OR: Odds Ratio; PCA: Principal Component Analysis; PC: Principal Component; PC1: First Principal Component; PC2: Second Principal Component; pDC: Plasmacytoid Dendritic Cells; PHID: Primary Humoral Immunodeficiency Diseases; SD: Standard Deviation; smB: Switched memory B cells; T reg: Regulatory T cells.
Competing interests
The authors declare that they have no competing interests. Authors’ contributions
DA, XD, A-LF, FL, PR, and J-FV enrolled PHID patients in the cohort and provided clinical data. J-FM performed the flowcytometric analysis. M-QP was involved in data collection. M-QP and RT participated in the study design and performed the statistical analysis of the data. M-QP wrote the manuscript. J-FM, RT, LW and J-FV critically read the manuscript. All authors read and approved the final manuscript.
ALTADIH study group members
Scientific committee: Dr F. Lifermann, Pr J-F. Moreau, R. Thiébaut, Pr J-F. Viallard Participating Hospital Departments (participating physicians): Bordeaux University Hospital (Pr J-F. Viallard); Agen Hospital (Dr P. Rispal); Dax Hospital (Dr F. Lifermann); Limoges Hospital (Dr A-L. Faucher); Pau Hospital (Dr X. Delbrel); Toulouse Hospital (Pr D. Adoue); Bordeaux Immunology Department: Pr P. Blanco, J-C. Carron, K. Eschechel, M. Garcie, Pr J-F. Moreau, Dr I. Pellegrin
Methodology: R. Thiébaut, M-Q. Picat, L. Wittkop Data collection: D. Jacquemart, M-Q. Picat
Computing and data management: G. Dupouy, C. Maldonado, I. Perrot Statistical analysis: M-Q. Picat, R. Thiébaut
Acknowledgments
The authors thank all patients for their participation.
The authors thank Myriam Garcie, Kamal Eschechel, Jean-Claude Carron and Céline Cognet for the skillful collaboration in carrying out the immunophe-notyping. They are grateful to Joanna Lewis, PhD in Biostatistics (University College London, United Kingdom), for expert reviewing of the English. This study was supported by a grant from the French Ministry of Health (French inter-regional Clinical Research Hospital Program: PHRC 2006-A00576-45)). Marie-Quitterie Picat was supported by funding from the French Foundation for Medical Research (FRM).
Author details
1INSERM, ISPED, Centre INSERM U897-Epidemiologie-Biostatistique, Bordeaux
F-33076, France.2University of Bordeaux, ISPED, Centre INSERM
U897-Epidemiologie-Biostatistique, Bordeaux F-33076, France.3Department
of Medical Information, Bordeaux University Hospital, Bordeaux F-33000, France.4INRIA SISTM, F-33405 Talence, France.5Department of Internal
Medicine, Dax Hospital, Dax F-40107, France.6Department of Internal Medicine, Pau Hospital, Pau F-64046, France.7Department of Internal
Medicine, Purpan Hospital, Toulouse F-31059, France.8Department of Internal Medicine, Dupuytren Hospital, Limoges F-87042, France.
9
Department of Internal Medicine, Agen Hospital, Agen F-47923, France.
10University of Bordeaux, Bordeaux F-33076, France.11CNRS, UMR 5164,
Bordeaux F-33076, France.12Bordeaux University Hospital, Laboratory of Immunology, Bordeaux F-33076, France.13Department of Internal Medicine
and Infectious Diseases, Bordeaux University Hospital, Pessac F-33604, France.
14Hôpital Haut-Lévêque - Service de médecine interne, 5, avenue de
Magellan, Pessac 33604, France.
Received: 31 May 2013 Accepted: 28 February 2014 Published: 12 March 2014
References
1. Al-Herz W, Bousfiha A, Casanova JL, Chapel H, Conley ME, Cunningham-Rundles C, Etzioni A, Fischer A, Franco JL, Geha RS, Hammarström L, Nonoyama S, Notarangelo LD, Ochs HD, Puck JM, Roifman CM, Seger R, Tang ML: Primary immunodeficiency diseases: an update on the classification from the international union of immunological societies expert committee for primary immunodeficiency. Front Immunol 2011, 2:54.
2. Oksenhendler E, Gerard L, Fieschi C, Malphettes M, Mouillot G, Jaussaud R, Viallard JF, Gardembas M, Galicier L, Schleinitz N, Suarez F, Soulas-Sprauel P,
Hachulla E, Jaccard A, Gardeur A, Théodorou I, Rabian C, Debré P, Viallard JF, Gardembas M, Galicier L, Schleinitz N, Suarez F, Soulas-Sprauel P, Hachulla E, Jaccard A, Gardeur A, Théodorou I, Rabian C, DEFI Study Group, et al: Infections in 252 patients with common variable immunodeficiency. Clin Infect Dis 2008, 46(10):1547–1554.
3. Preud’homme JL, Hanson LA: IgG subclass deficiency. Immunodefic Rev 1990, 2(2):129–149.
4. Kelesidis T, Yang O: Good’s syndrome remains a mystery after 55 years: a systematic review of the scientific evidence. Clin Immunol 2010, 135:347–363. 5. Wehr C, Kivioja T, Schmitt C, Ferry B, Witte T, Eren E, Vlkova M, Hernandez
M, Detkova D, Bos PR, Poerksen G, von Bernuth H, Baumann U, Gutenberger S, Schlesier M, Bergeron-van der Cruyssen F, Le Garff M, Debré P, Jacobs R, Jones J, Bateman E, Litzman J, van Hagen PM, Plebani A, Schmidt RE, Thon V, Quinti I, Espanol T, Webster AD, Chapel H, et al: The EUROclass trial: defining subgroups in common variable immunodeficiency. Blood 2008, 111(1):77–85.
6. Chapel H, Lucas M, Lee M, Bjorkander J, Webster D, Grimbacher B, Fieschi C, Thon V, Abedi MR, Hammarstrom L: Common variable immunodeficiency disorders: division into distinct clinical phenotypes. Blood 2008, 112 (2):277–286.
7. Mouillot G, Carmagnat M, Gerard L, Garnier JL, Fieschi C, Vince N, Karlin L, Viallard JF, Jaussaud R, Boileau J, Donadieu J, Gardembas M, Schleinitz N, Suarez F, Hachulla E, Delavigne K, Morisset M, Jacquot S, Just N, Galicier L, Charron D, Debré P, Oksenhendler E, Rabian C, DEFI Study Group: B-cell and T-cell phenotypes in CVID patients correlate with the clinical phenotype of the disease. J Clin Immunol 2010, 30(5):746–755. 8. Cunningham-Rundles C: How I, treat common variable immune
deficiency. Blood 2010, 116(1):7–15.
9. Piqueras B, Lavenu-Bombled C, Bergeron-van der Cruyssen F, Mouthon L, Chevret S, Debré P, Schmitt C, Oksenhendler E: Common variable immunodefi-ciency patient classification based on impaired B cell memory differentiation correlates with clinical aspects. J Clin Immunol 2003, 23(5):385–400. 10. Warnatz K, Denz A, Drager R, Braun M, Groth C, Wolff-Vorbeck G, Eibel H,
Schlesier M, Peter HH: Severe deficiency of switched memory B cells (CD27(+)IgM(-)IgD(-)) in subgroups of patients with common variable immunodeficiency: a new approach to classify a heterogeneous disease. Blood 2002, 99(5):1544–1551.
11. Giovannetti A, Pierdominici M, Mazzetta F, Marziali M, Renzi C, Mileo AM, De Felice M, Mora B, Esposito A, Carello R, Pizzuti A, Paggi MG, Paganelli R, Malorni W, Aiuti F: Unravelling the complexity of T cell abnormalities in common variable immunodeficiency. J Immunol 2007, 178(6):3932–3943. 12. Viallard JF, Blanco P, Andre M, Etienne G, Liferman F, Neau D, Vidal E,
Moreau JF, Pellegrin JL: CD8 + HLA-DR + T lymphocytes are increased in common variable immunodeficiency patients with impaired memory B-cell differentiation. Clin Immunol 2006, 119(1):51–58.
13. Rezaei N, Wing JB, Aghamohammadi A, Carlring J, Lees A, Asgarian-Omran H, Pourpak Z, Sarrafnejad A, Kardar GA, Shahrestani T, Masoumi F, Zare A, Saghafi S, Sarrafzadeh S, Foster RA, Heath AW, Read RC: B-cell-T-cell activation and interaction in common variable immunodeficiency. Hum Immunol 2010, 71(4):355–362.
14. Fevang B, Yndestad A, Sandberg WJ, Holm AM, Muller F, Aukrust P, Frøland SS: Low numbers of regulatory T cells in common variable
immunodeficiency: association with chronic inflammation in vivo. Clin Exp Immunol 2007, 147(3):521–525.
15. Horn J, Manguiat A, Berglund LJ, Knerr V, Tahami F, Grimbacher B, Fulcher DA: Decrease in phenotypic regulatory T cells in subsets of patients with common variable immunodeficiency. Clin Exp Immunol 2009, 156(3):446–454. 16. Viallard JF, Bloch-Michel C, Caubet O, Parrens M, Texier-Maugein J, Neau-Cransac M,
Taupin JL, Moreau JF, Pellegrin JL: Gammadelta T lymphocytosis associated with granulomatous disease in a patient with common variable immunodeficiency. Clin Infect Dis 2002, 35(12):134–137. 17. Fulcher DA, Avery DT, Fewings NL: Invariant natural killer (iNK) T cell
deficiency in patients with common variable immunodeficiency. Clin Exp Immunol 2009, 157(3):365–369.
18. Scott-Taylor TH, Green MR, Raeiszadeh M, Workman S, Webster AD: Defective maturation of dendritic cells in common variable immunodeficiency. Clin Exp Immunol 2006, 145(3):420–427.
19. Garg V, Lipka S, Rizvon K, Singh J, Rashid S, Mustacchia P: Diffuse nodular lymphoid hyperplasia of intestine in selective IgG 2 subclass deficiency, autoimmune thyroiditis, and autoimmune hemolytic anemia: case report and literature review. J Gastrointestinal Liver Dis 2012, 21(4):431–434.
20. Park MA, Li JT, Hagan JB, Maddox DE, Abraham RS: Common variable
immunodeficiency: a new look at an old disease. Lancet 2008, 372(9637):489–502. 21. Aghamohammadi A, Parvaneh N, Rezaei N: Common variable
immunodeficiency: a heterogeneous group needs further subclassification. Expert Rev Clin Immunol 2009, 5(6):629–631. 22. O’Gorman MR, Zollett J, Bensen N: Flow cytometry assays in primary
immunodeficiency diseases. Methods Mol Biol 2011, 699:317–335. 23. Lugli E, Roederer M, Cossarizza A: Data analysis in flow cytometry: the
future just started. Cytometry A 2010, 77(7):705–713.
24. Lugli E, Pinti M, Nasi M, Troiano L, Ferraresi R, Mussi C, Salvioli G, Patsekin V, Robinson JP, Durante C, Cocchi M, Cossarizza A: Subject classification obtained by cluster analysis and principal component analysis applied to flow cytometric data. Cytometry A 2007, 71(5):334–344.
25. Ringner M: What is principal component analysis? Nat Biotechnol 2008, 26(3):303–304.
26. Everitt B: Cluster analysis is a generic term for a wide range of numerical methods for examining data. Stat Methods Med Res 2004, 13(5):343–345. 27. Ward J: Hierarchical grouping to optimize an objective function.
J Am Stat Assoc 1963, 58(301):236–244.
28. Giovannetti A, Pierdominici M, Aiuti F: T-cell homeostasis: the dark(ened) side of common variable immunodeficiency. Blood 2008, 112(2):446. 29. Pencina MJ, D'Agostino RB Sr, D'Agostino RB Jr, Vasan RS: Evaluating the
added predictive ability of a new marker: from area under the ROC curve to reclassification and beyond. Stat Med 2008, 27(2):157–172. 30. Focosi D, Bestagno M, Burrone O, Petrini M: CD57+ T lymphocytes and
functional immune deficiency. J Leukoc Biol 2010, 87(1):107–116. 31. Yong PF, Thaventhiran JE, Grimbacher B: "A rose is a rose is a rose," but
CVID is not CVID common variable immune deficiency (CVID), what do we know in 2011? Adv Immunol 2011, 111:47–107.
32. Vlková M, Thon V, Sárfyová M, Bláha L, Svobodník A, Lokaj J, Litzman J: Age dependency and mutual relations in T and B lymphocyte abnormalities in common variable immunodeficiency patients. Clin Exp Immunol 2006, 143(2):373–379.
33. Su LF, Kidd BA, Han A, Kotzin JJ, Davis MM: Virus-specific CD4(+) memory-phenotype T cells are abundant in unexposed adults. Immunity 2013, 38(2):373–383.
34. Guerri L, Dusseaux M, Martin E, Soudais C, Lantz O: Mucosal-associated invariant T cells: unconventional development and function. Trends Immunol 2011, 32(5):212–218.
35. Young MH, U’ren L, Huang S, Mallevaey T, Scott-Browne J, Crawford F, Lantz O, Hansen TH, Kappler J, Marrack P, Gapin L: MAIT cell recognition of MR1 on bacterially infected and uninfected cells. PLoS One 2013, 8(1):e53789. 36. Litzman J, Nechvatalova J, Xu J, Ticha O, Vlkova M, Hel Z: Chronic immune
activation in common variable immunodeficiency (CVID) is associated with elevated serum levels of soluble CD14 and CD25 but not endotoxaemia. Clin Exp Immunol 2012, 170:321–332.
doi:10.1186/1471-2172-15-13
Cite this article as: Picat et al.: T-cell activation discriminates subclasses of symptomatic primary humoral immunodeficiency diseases in adults. BMC Immunology 2014 15:13.
Submit your next manuscript to BioMed Central and take full advantage of:
• Convenient online submission
• Thorough peer review
• No space constraints or color figure charges
• Immediate publication on acceptance
• Inclusion in PubMed, CAS, Scopus and Google Scholar
• Research which is freely available for redistribution
Submit your manuscript at www.biomedcentral.com/submit