Publisher’s version / Version de l'éditeur:
Advances in Cement Research, 5, 20, pp. 171-176, 1993-10
READ THESE TERMS AND CONDITIONS CAREFULLY BEFORE USING THIS WEBSITE.
https://nrc-publications.canada.ca/eng/copyright
Vous avez des questions? Nous pouvons vous aider. Pour communiquer directement avec un auteur, consultez la première page de la revue dans laquelle son article a été publié afin de trouver ses coordonnées. Si vous n’arrivez Questions? Contact the NRC Publications Archive team at
[email protected]. If you wish to email the authors directly, please see the first page of the publication for their contact information.
NRC Publications Archive
Archives des publications du CNRC
This publication could be one of several versions: author’s original, accepted manuscript or the publisher’s version. / La version de cette publication peut être l’une des suivantes : la version prépublication de l’auteur, la version acceptée du manuscrit ou la version de l’éditeur.
Access and use of this website and the material on it are subject to the Terms and Conditions set forth at
Computer simulation of impedance behaviour in hydrating Portland
cement systems
Gu, P.; Xie, P.; Beaudoin, J. J.
https://publications-cnrc.canada.ca/fra/droits
L’accès à ce site Web et l’utilisation de son contenu sont assujettis aux conditions présentées dans le site LISEZ CES CONDITIONS ATTENTIVEMENT AVANT D’UTILISER CE SITE WEB.
NRC Publications Record / Notice d'Archives des publications de CNRC:
https://nrc-publications.canada.ca/eng/view/object/?id=d2661ab5-ab37-4e2c-a1d6-c9e1e3a33577 https://publications-cnrc.canada.ca/fra/voir/objet/?id=d2661ab5-ab37-4e2c-a1d6-c9e1e3a33577http://www.nrc-cnrc.gc.ca/irc
Com put e r sim ula t ion of im pe da nc e be ha viour in hydra t ing Port la nd
c e m e nt syst e m s
N R C C - 3 5 2 2 5
G u , P . ; X i e , P . ; B e a u d o i n , J . J .
O c t o b e r 1 9 9 3
A version of this document is published in / Une version de ce document se trouve dans:
Advances in Cement Research, 5, (20), pp. 171-176, October, 1993
The material in this document is covered by the provisions of the Copyright Act, by Canadian laws, policies, regulations and international agreements. Such provisions serve to identify the information source and, in specific instances, to prohibit reproduction of materials without written permission. For more information visit http://laws.justice.gc.ca/en/showtdm/cs/C-42
Les renseignements dans ce document sont protégés par la Loi sur le droit d'auteur, par les lois, les politiques et les règlements du Canada et des accords internationaux. Ces dispositions permettent d'identifier la source de l'information et, dans certains cas, d'interdire la copie de documents sans permission écrite. Pour obtenir de plus amples renseignements : http://lois.justice.gc.ca/fr/showtdm/cs/C-42
f'
Advances in Cement Research, 1993,5, No. 20, 171-176
Computer simulation of impedance behaviour
in hydrating Portland cement systems
Ping Gu, * Ping Xie* and
1.
J. Beaudoint
UNIVERSITY OF OTTAWA: NATIONAL RESEARCH COUNCIL. OTTAWA
Computer simulation is applied to reveal the microstructural influence on the impedance behaviour of a hydrating cement paste system. Changes in two major parameters, porosity and mean pore size, have been taken into account in constructing the impedance spectrum. Simulation results show that a decrease in porosity leads to a decrease in both high-frequency resistance R] and highfrequency arc diameter R2.It has no effect on phase angle shift. A change in mean pore size has a more significant influence than a change in porosity on impedance behaviour, i.e. R] and R2 of a hydrating cement paste system. It also affects the extent of phase-angle shifi.
Introduction
Alternating current impedance spectroscopy appears destined to play an important role in fundamental and applied electrochemistry and materials science investigations.1 However, this technique has been
applied in cement science only in recent years.2-9Useful
information related to the microstructure of hydrating cement systems was obtained. Interpretation of an impedance spectrum (IS) usually requires modelling with an equivalent circuit until the electrical response of the elemental microstructure of the cement paste is well simulated. The usefulness of the analyses depends on the physical meaning of each selected reinforced concrete (RC) component in the circuit that relates to the micro-structure of hydrating cement paste.
In previous worklO-12a simple electrical conductivity model and the corresponding equivalent circuit have been
*
Department of Civil Engineering, University of Ottawa, Ottawa, Canada, KIN 6N5.tMaterials Laboratory, Institute for Research in Construction, National Research Council, Ottawa, Canada, KIA OR6.
Paper received 13 January 1993.
proposed. New relations between high-frequency resistance (HFR), high-frequency arc (HFA) diameter and microstructural parameters such as porosity and mean pore size have been derived and their validity has been demonstrated by a series of experiments. An understanding of the effect of each individual microstructural variable on the IS is essential for interpretation of the data. In this Paper, a theoretical simulation of impedance behaviour of a hydrating cement paste system is described. The effects of microstructural factors, porosity and mean pore size are considered. The effects of porosity and mean pore size on the impedance behaviour of a cement paste system under a condition of constant ionic concentration in the liquid phase are demonstrated.
An equivalent circuit model for the
hydrated Portland cement system
A typical IS for a cement system plotted in the imaginary against real plane is shown in Fig. I(a). The single arc in the high-frequency range is associated with the bulk cement paste effect; a second arc in the relatively low-frequency region is due to electrode interface effects. The corresponding electrical equivalent circuit that describes the impedance behaviour of a hydrated cement paste system is shown in Fig. 1(b).'·8 This circuit, unlike other proposed electrical equivalent circuits,Z-5 is derived from a simple physical model of a hydrating cement paste system. All the RC parameters have a clear physical significance.IO-IZ Frequency is denoted by w (w = 2"j). R, is the HFR: its value can usually be determined by extrapolating the HFA to intercept the real axis at the high-frequency end. The diameter of the HFA
R2 and C
z
are solid-liquid interfacial resistance and interfacial capacitance respectively. These values can also be detennined experimentally. ParametersRetand Cdlare related to the cement paste electrode surface effect. The 171Ping Gu et al.
Real; !J
(a)
Bulk cement paste effect R,
]セ
C1r(0
"KセIH⦅i
v'rC] Pro)
(5)whereK' is a constant related to cell geometry, C1r is the ionic conductivity of the interface, Ao is the equivalent conductivity of the pore solution at infinite dilution,{3is
an experimental constant associated with ionic interactions
and viscosity of the pore solution etc., [C] is the concentration of ions in the bulk pore solution, 0"is the thickness of the Stern layer, k, and k, are constants related to pore geometry and ionic strength of pore
solution and temperature respectively, Q! is the area
fraction-volume fraction ratio of the pores, P is the porosiry of the cement matrix, and rois the mean pore size, determined from a pore-size distribution curve obtained by mercury intrusion porosimetry.
A hydrating cement paste system is very complex. Most of the constants (i.e. Ao ,(3, 0", ex, k, andk,)in equations
(4)and(5)are difficult to determine. The overall effect, however, can be determined experimentally. This is facilirated in a hydrating Portland cement paste system when the ionic concentration in the pore solution is relatively constant (at hydration times greater than 24 h). Equations (4) and (5)can then be simplified to
R, -
cMBGセ[MpᄏI
(6)Electrode effect
Bulk cement paste effect Electrode effect
r---,
,
,
I C2 ! Cdl,
,
,
,
I Rj I H-'-..J-I,,
,
,
, R,,
,
L J (b)Fig, ]. (a) Plot of an BFA in the impedance complex plane
obtained for cement paste systems,' (b) a corresponding equivalent circuit for hydrating cement paste
former is the charge transfer resistance due to electrochemical reaction at the cement-electrode surface: in a non-electric-polarization system, Rot is usually very large. The latter is the electrode-cement system interface capacitance, or so-called double layer capacitance. The formation of Cd! is due to the existence of a boundary between the electrode and cement matrix in which the potential difference across the interphase results in the charge alignment at both the cement (with its electrolyte) and electrode surfaces. The interphase behaves as a capacitor. This cement-electrode capacitance effect always exists and its signal is usually picked up in the low-frequency range.
The total impedance value of the equivalent circuit
(Fig. l) is The moduli,s and phase angle are given by
Modulus = v'(real'+img') (10)
Phase angle
=
tan-I (img) (11) real,
,
I II
I
I
(9)(7)
K,
+
K,
+ __-=-R"'L'
⦅セ(l-ex)+exP Pro[l
+
(WTo)'J I+
(wCd,Rot)'(8)
real
=
K,
R,
=-Pro
whereKjandK2are constants. SinceR2CZ = 1 0
=
lIwo,whereWo = 21rlo ifo
=
apex frequency), substitution ofequations(6)and(7)into equations(2)and(3)yields the real and imaginary impedance for a cement paste system
(1)
+ Rot - jRot'Cd!W
1
+
(wCd, Rot)'and the real and imaginary terms are
(2) (3) real=R+ R, + Rot , 1+(w ,R,)C ' I
+
(wCd,Rot), . _ (R,'C,w+
Rot'Cd,w ) [mg - -I+
(wC,R,)' I+
(wCd,Rot)'From previous investigations,10-12JIFRR, and the HFA diameter R, are functions of ionic concentration of the pore solution and porosity of the hydrating cement paste system, and can be expressed by .
R, = K'
C
-ex(II-P») (aッHQMサSセイ」}I{」}I
(4)172
It is apparent from equations(8)and(9)that porosity and mean pore size have a direct effect on the bulk impedance behaviour of the hydrating cement paste system. K1and
K, are constants related to cell geometry, chemical
composition of the cement and ionic concentration of the pore solution, etc. Their values can be estimated experimentally.10-12
Experimental procedure
Materials
Type 10 Portland cement was used. Its chemical composition (wt%) was SiO,
=
19·83, CaO=
61·21,Impedance behaviour in hydrating Portland cement systems
-100
Fe,O,
=
3·20, AI,O,=
4·18, MgO=
4·09,SO,
=
3·93, Na,O=
0·45, K,O=
0·82. The silica fl1me used was supplied by the SKW Co., Montreal. Its composition was SiO,=
95·17, CaO=
0·23, Fe,O,=
0·13, AI,O,=
0·21, MgO=
0·15,SO,
=
0,12, Na,O=
0·10, K,O=
0·27,Specimen preparation
The fresh cement paste was mixed in a conventional Hobart mixer at a water/cement
+
silica fume ratio of 0·35, and placed into a 1·2 cmdia. X 1·5 em stainless steel cylindrical cell described in previous worK.7•8Thesample was in a 100% relative humidity environment for 24 h and was then immersed in lime solution for the remainder of the test period.
- - 1 6 9 h --+-194 h _ _ 380h -75 Cl
セ
-50t
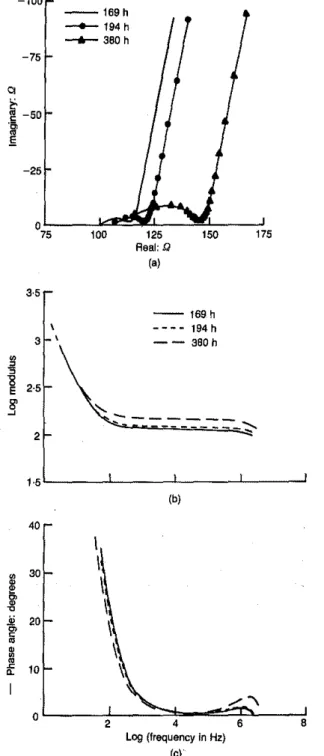
-25 100 125 Aeal:Q (a) 150 175Fig. 2. Plots of experimental impedance data for hydrating
cement paste at 169. 194 and 380 h: (a) imaginary-real
impedance; (b) log modulus-log frequency; (c) phase angle-log frequency
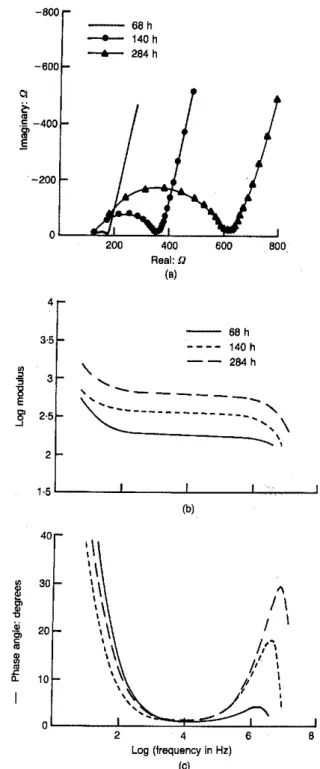
> 5 is due to the cement solid-liquid interfacial capacitance. The value of log modulus (Figs 2(b) and 3(b» increased with hydration time, as well as with the phase angle in the HFR (log frequency> 5, Figs 2(c) and 3(c». Compared with cement paste, the curves for cement-silica fume pastes exhibit: (a) a rapid growth of the diameter with time, (b) a rapid increase of the modulus and phase angle in the HFR and (c) less depression of the HFA at longer hydration times. All the above phenom-ena are due to the effect of silica fume in accelerating
Impedance measurements
Impedance data were collected using a model 1260 impedance gain-phase analyser from Schlumberger Technologies. Measurements were made logarithmically in the frequency range from 20 MHz down to I Hz with ten readings per decade.
Results and discussion
Impedance spectra of hydrating cement paste and
paste containing silica fume
Figure 2 shows plots of impedance data in the complex plane for the hydrating cement paste at 169, 194 and 380 h. Alternating current impedance behaviour of hydrating cement-silica fume mixtures at 68, 140 and 284 h is shown in Fig. 3. Addition of silica fume significantly changes the impedance properties of the cement paste.
An HFA in the real-imaginary plot (Figs 2(a) and 3(a»
was observed and continued to grow in diameter with
time. These spectra exhibit a typical HFA contributed by the bulk solid-liquid interfacial capacitance and a 'tai!' or part of a second arc (at lower frequencies) corresponding to the effect of the cement system-electrode interfacial double-layer capacitance. The growth of the HFA accompanies microstructural changes during the cement hydration process. One disadvantage of the plot in the complex plane (imaginary-real or Cole-Cole or Nyquist plots") is that the spacing of the frequencies along the curve is highly non-linear. A more fundamental way of plotting the impedance over a wide range of frequencies is reflected in the log modulus - log frequency or phase angle -log frequency plots, e.g. Bode plots.14 These are complementary plots where the spacing on the frequency scale is explicitly stated. Moreover, frequency plots simplify identification of the effects caused by individual RC parameters in the
equivalent circuit network. For instance, six decades of
frequency are shown in Figs 2(b) and 3(b). In the range log frequency
<
2, the increase in log modulus values is caused by the cement matrix-electrode surface capacitance, and the decrease of log modulus in the range3·5 \ 3
,
0 fj "8 2·5 E 8' セ 2 1·5 40 0 30 セ co•
セ..
20 co c•
m•
セ 10 0. 0 - - 169h _ _ _M 194h - - 380h (b)\
\
\
\
I
\
セ...
,
2 4 6 8 Log (frequency In Hz) (e)Ping Gu et al.
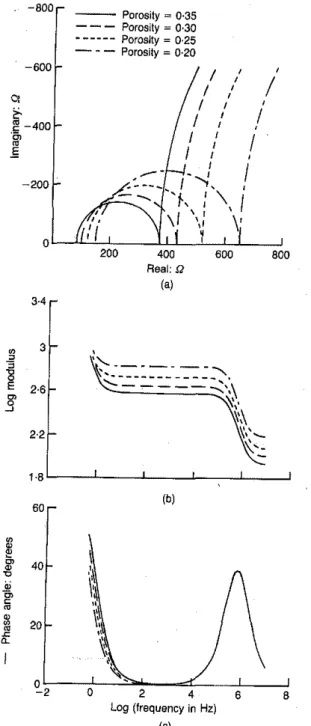
Effect of porosity on impedance behaviour
The impedance spectra at various porosity values were
calculated using equations (8)-(11) and the following arbitrary values: (X = I, KI = 30Il, K, = 5Il I'm,
ro = 0 ·06 I'm andWo = 2 MHz. The values of Cdland R" were assigned as 50 I'F/cm' and 30 klllcm' for all
the calculations. Results are presented as imaginary-real
(Fig. 4(a», log modulus-log frequency (Fig 4(b» and phase angle-log frequency (Fig. 4(c» plots. In the imaginary-real plot, only the HFA and part of the second arc are displayed.It is clearly demonstrated that the HFR
RI and the arc diameter R, increase as porosity decreases. The values ofRI and R" starting with 85 Il
and 285 Il at P
=
0·35, increase to 150Il and 5000 respectively at P=
0, 20. Details are listed in Table 1. The 'tails' of all impedance spectra are parallel due to constant values of Cdl and Rot.Figure 4(b) contains four frequency domains. In the range log frequency
<
I, the increase in log modulus values is caused by the cement matrix -electrode surface capacitance Cdl • In the range 5>
log frequency>
2,the curve with a zero slope corresponds to the cement signal. A stronger ion-ion interaction would be expected more in small pores than in large ones. Close proximity of surfaces would hinder the oscillation of hydrated ions. A broad pore-size distribution would result in a wide spread of relaxation times. A narrow pore-size distribution would result in a significantly reduced spread of relaxation times. Less depression of the HFA would then be observed."
The assigned porosity values in the range 35 %-20% correspond to the actual porosity values measured in a hydrating cement paste system from 3 to 28 days hydration. The mean pore size change from 0·1 toO·OJ I'm also corresponds to the actnal mean pore size change of a hydrating cement-silica fume paste system from 3 to 28 days hydration.
Computer simulation
The objective of the computer simulation in this work was to reveal the effect of microstructural parameters, i.e. porosity and mean pore size, on the impedance behaviour of cement systems in a qualitative' way. Therefore the following simplifications and assumptions were made.
The effect of ionic concentration of the pore solution
is constant.
The electrode effect can be separated from that of the bulk paste since the effect of microstructure, i.e. bulk arc, appears only in the HFR. The electrode effect is not discussed in this Paper.
(c) The dispersion angle effect was neglected in this
simulation.
(d) The constants in equations (8) and (9), such as K"
K2 and el, were estimated from experimental
results.10-12 BOO. 600 400 Real:Q (a) 200 2 4 (a) 68 h (b) 3·5 140 h
"-
284 h 3"
-200 40セ|
\1
•
30II
セ \"
/
\
l
,,1
\セ
20I \
I
c \/,-•
|セ,
\ セ,
\•
|セ
l'
\
セ , I 0- 10 \/1'
\
\,
,
,
-0 (b) 2 4 6 8 Log (frequency in Hz) (e) '.5 L _ _....l. L _ _---l--:;;_---'Fig. 3. Plots of experimental impedance data for the hydrating
cement-silica fume paste at68,140 and284h: la) imaginary-real impedance; Ih) log modulus-log frequency; Ie) phase
angle-log frequency - - 68h - + - 140h _ _ 284h -800
"
l-400f
-600cement hydration reactions. Silica fume addition results
in a reduction in the number oflarge pores, a smaller mean pore size and lower total porosity.
The impedance loops plotted in the real-imaginary plane (Figs 2(a) and 3(a» are not perfect semicircles. Depression of the HFA in the impedance spectra of cement paste is explained in terms of a spread of relaxation times. Pore size and pore surface chemistry could limit the oscillation frequencies of the hydrated ions and water molecules which respond to the applied alternating current
Impedance behaviour in hydrating Portland cement systems
Porosity:% R,:O R,:O C,:F
35 85 285 !·75xlO-<J
30 100 333 1.50x 10- 9
25 120 400 1·25 x 10- 9
20 150 500 1.00x 10- 9
In the four calculated cases in Fig. 4(b) the parallel upward movement of the curves as porosity decreases indicates an increase of bothR, andR2. It is interesting that the change of porosity alone does not affect the shift of the phase angle as the curves are superimposed in the high-frequency range. This result is compared below with
the case where the mean pore size varies.
Table 1. RC parameters obtainedby computer simulation at
various porosity values
,
/
,
/
,/
I
,
\ /
\'
/ II
I
II
- - - Porosity"" 0·35 - - - Porosity=0'30 セ --- Porosity= 0·25 - - - Porosity=0·20 -600 -800 -200 q セ セ -400 Nセ .§o
'---"-'--'-;;:;;---'7::"---'-=.L....-,J 400 600 800 Real:Q (a)solid-liquid interfacial resistance or the value of the HFA diameter R2• The decrease of log modulus in the range S
<
log frequency<
7 is due to the cement solid-liquid interfacial capacitance C2•A constant value of modulus beyond log frequency = 7 corresponds to the HFR. The phase angle-log frequency plot is also useful in separating the effects associated with RC parameters. In Fig. 4(c), the phase-angle peak in the high frequency range 4<
log frequency<
8 indicates the existence of cement solid-liquid interfacial capacitance C2,whereas the part of a peak in the low-frequency area (log frequency<
2) is related to the cement matrix -electrode surface capacitance Cd"Table2.RCparameters forcement paste obtained by computer simulation at various mean pore size values
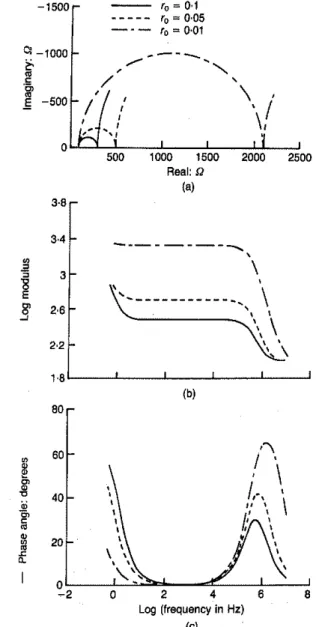
Effect of mean pore size on impedance behaviour
Theoretical simulations of the effect of mean pore size
on the impedance spectrum at a constant porosity were
conducted by assigning the following arbitrary values:
CI = 1, K, = 30 Il, K2
=
5 Il I'm, P=
0·25,Wo = 2 MHz, Cdl
=
50 J.lF and Rot = 30 kll. All three plots are shown in Fig. 5, i.e. imaginary-real impedance, log modulus-log frequency and phase angle-log frequency, where r o= 0·1,0·05 and 0·01 I'm. The simulated RC parameters are given in Table 2.The effect of mean pore size on the impedance spectrum is much greater than that of porosity. The imaginary-real impedance plot (Fig. 5(a» shows that the diameter of the HFA increases significantly from 2000 to 2000 Il as the mean pore size changes from 0 . I I'm to 0·01 I'm.
The effect of mean pore size can also explain the experi-mental observation that the HFA diameter is larger for the silica fume-cement paste system than for the ordinary Portland cement (OPC) paste. The silica fume-cement system has a smaller mean pore size than the OPC
system.7 A significant increase in the modulus
corres-ponds to an increase in the HFA, as indicated in Fig. 5(b). The phase angle-log frequency plot (Fig. 5(c» is also affected by the mean pore size. Total porosity alone does not affect the extent of phase-angle shift. The simulation appears to explain observed behaviour.
In a hydrating OPC system, both porosity and mean pore size (as well as ionic concentration in the liquid phase) change with hydration time. Therefore, a change in the IS would not be linear. Variation of ionic
Mean pore RI:O R2:O C2:F
size !-tm 0·10 100 200 2·50xlO- 9 0·05 100 400 1·25 X 10-9 O·Ot 100 2000 2.50x 10⁻¹⁰ (b) 40 20 3·4 0 3 0
"
"8
E 2·6'"
0 -' 2·2 1-8 60I
ゥセ|Lセ
"
ャセ
"セセ
.\セᆳ
セG[[RMMセPMMBGGGGGZGRMMGGGTャZM⦅NNNNNNjVMMMjX Log (frequency in Hz) (c)fゥァセ 4. Computer simulation a/impedancespectra forhydrating cement paste systems at various porosity values (the mean pore size is fixed atfa = O· 05 Il-m): (a) imaginary-real impedance; (b) log modulus-log frequency; (c) phose。ョァャ・セゥッァ frequency
oGMGMセセMMLlMMNNLNLセMNNNオMMG 500 1000 1500 2000 2500 Real:Q (a) Ping Gu et at. -1500 C< -1000
Nセ
I
-500'0
=:0·1'0
=:0-05'0
=:0·01...
MセMM , . / ...,
/
'
\
, I
'
\,
Conclusions
I. The effect of varying porosity on impedance behaviour of a hydrating cement paste system has been demonstrated by computer simulation. Varying porosity leads to changes in both HFRR,and HFA diameterR"
but has no effect on the shift of phase angle.
2. A change in mean pore size has a greater influence than a change in total porosity on the impedance behaviour of hydrating cement paste systems. It affects both the HFA diameter and the shift of phase angle.
,
3·8 304---...
セ,
"
0 3\
"8
,
,
E,
\
3'
2'6 MMMMMMMMMMMセ...
,
,
,
..
,
\
, 2,2,,
\ 1,8 (b) 80 60 "•
/
, セ ,\
'"
1,-,
•
,
"C 40t
t,/
",
,
\
セ,,
•
20,
\ セ,
セ,
0-,
,
<;''::-2MMPAMGMMGMGMGセRMM、TAoMMMVセMMLjX Log (frequency in Hz) (e)Fig. 5. Computer simulation a/impedance spectra for hydrating cement paste systems with pore structure characterized by various values of mean pore sizef o(porosity = O· 25): (a) imaginary-real impedance; (h) log modulus-log frequency; (c) phase angle-log frequency
concentration in the liquid phase 'would also make the impedance behaviour of hydrating cement paste more complicated. Changes in IS with ionic concentration in the pore solution will be dealt with in a further paper.
176
Acknowledgements
Financial support by NSERC and the Network of Centers of Excellence on High Performance Concrete is gratefully acknowledged. The Authors would like to thank B. Myers and Gordon Chan for their assistance with the experimental apparatus.
References
1. BONANOS N" et al. (McDONALD 1.R. (Ed.») Application of
impedance spectroscopy, Wiley, New York, 1987, chapter 4.
2. MCCARTER W.J. et aI. J. Mater, Sci, Lett., 1988,7, No. 10.
1056,
3. MCCARTER W,J.andBROUSSEAUR.Cern. Concr. Res., 1990,20, 891.
4. BRANTERVIKK. andNIKLASSONG, A.Cern. Concr. Res., 1991,
21, 469.
5. SCUDERIC,A, et ai, J. Mater. Sci., 1991,26,349,
6, CHRISTENSENB, J,etal.J,Am"Cerarn. Soc., 1992, 75, No.4,
939-945,
7. PINGGuet al. Cern. Concr. Res., 1992,22, No.5, 833-840.
8. PINGGuet al. Cern. Concr. Res., 1993,23, No.1, 157-168.
9, PINGGuet ai. Cern. Concr. Res., 1993,23, No.3, 581-591.
10. PINGXIEetal. Cern. Coner. Res., 1993,23, No.2, 359-367.
11. PINGGuet al. Cern. Coner. Res., 1993, 23, No.3, 531-540.
12. ZHONGZT Xuet al. Application of A.C, impedance techniques in studies of porous cementitious materials.II.Relationships between ACIS behaviors and the porous mil:rostructure, Cern. Coner. Res., 1993, 23, No, 4, 853-862.
13. COLEK. S. and COLER. H.J. Chern. Phys. 1941, 9,341-351. 14. BODE H. W. In Network analysis and feedback amplifier design,
VanNostrand, New York, 1945.
Discussion contributions on this Paper should reach the Editor by 30June1994