EURASIAN JOURNAL OF BUSINESS AND
MANAGEMENT
http://www.eurasianpublications.com
12
D
OES
I
DIOSYNCRATIC
R
ISK
M
ATTER
?
E
VIDENCE FROM THE
J
APANESE
S
TOCK
M
ARKET
Bing Xiao
Université d’Auvergne, France. Email: bixiao@yahoo.fr
Abstract
It would seem that a relationship exists between the idiosyncratic risk and stock returns, and the idiosyncratic risk exhibits a positive and statistically significant trend. The goal of this paper is to use data from Japanese markets to investigate the two issues for the 2000-2014 period and provide further evidence that adds to the existing conflicting results. Our results suggest that existence of a positive relationship between the equally weighted measure of idiosyncratic risk and subsequent stock returns, but we don’t find a rise in idiosyncratic volatility over the period. Keywords: Idiosyncratic Risk, Stock Markets Volatility, Stocks Returns
JEL Classifications: G10, G11, G12
1. Introduction
The relationship between idiosyncratic risk and future market returns is conflicting and confusing. Campbell et al. (2001) analyzed long-term trends in both firm-level and market volatility in US stock markets from 1962 to 1997. They reported that only firm-specific risk exhibited a significant upward trend during the 1962-1997 period, while market and industry volatilities showed no significant trend. Their empirical evidence suggests that idiosyncratic risk commands a positive risk premium. Goyal and Santa-Clara (2003) claimed that the average stock variance is positively related to market returns, but Ang et al. (2009) showed that stocks with high idiosyncratic risk deliver abysmally low returns. Guo and Savickas (2008) and Kearney and Poti (2008) found that market returns are positively related to lagged market variance and negatively related to lagged idiosyncratic variance in US. Kearney and Poti (2008) suggested that market and average idiosyncratic variance predict market returns because they jointly proxy for average correlation, and hence for a component of systematic risk.
However, not all the empirical studies agree with these findings and these evidences are clearly at odds with traditional asset pricing theories which predict that only systematic (market) risk should matter in equilibrium. Investors bearing idiosyncratic risk, which can be eliminated through diversification, should get no reward for it. The evidence on the relation between idiosyncratic volatility and stock returns has been disputed in a number of more recent articles.
The evidence shows that idiosyncratic risk has predictive power only in the case of small capitalization stocks. Wei and Zhang (2005) showed that the positive relation between market returns and lagged idiosyncratic volatility is sample specific. Brown and Ferreira (2004) found that only the idiosyncratic risk of small capitalization stocks had a significant positive
13
relation with future stock returns. Bali et al. (2005) argued that this relation depended on the weighting scheme used to calculate the stock variance and is only valid for small capitalization stocks traded on the NASDAQ (liquidity premium). Angelidis and Tessaromatis (2008a) found that the small stocks idiosyncratic volatility is strong predictor of the small capitalization premium of market returns. Angelidis and Tessaromatis (2008b) argued that there was a positive relationship between the equally weighted measure of idiosyncratic risk and subsequent stock returns, but no relation was found between the value weighted measure of idiosyncratic risk – which by construction over-weights large capitalization stocks – and future market returns.
The recent literature on idiosyncratic risk focuses also on another main issue: Whether the risk exhibits a significant positive trend. Campbell et al. (2001) report that firm-specific risk exhibits a significant upward trend during the 1962-1997 period. But Guo and Savickas (2008) used G7 country data and provided evidence that the value-weighted idiosyncratic volatility increased during the late 1990s and reversed to the pre-1990s level afterward. Brandt et al. (2008) and Bekaert et al. (2008) rejected the hypothesis of a permanent increase in asset-specific risk. Timotheos (2010) argued that the rise of idiosyncratic risk is not a global phenomenon: A high-volatility regime was observed during the 1997-2000 period followed by a low-volatility regime, which implied that the increase couldn't have been attributed to a long-run trend.
Few studies have examined the relation between stock returns and idiosyncratic risk in Japan, with the exception of Guo and Savickas (2008) as well as Ang et al. (2009). Ang et al. (2009) showed that high idiosyncratic volatility had low future average returns across 23 developed markets (including Japan). Guo and Savickas (2008) showed that idiosyncratic volatility had statistically significant predictive power for aggregate stock market returns by using data from G7 countries.
These observations led us to analyze recent changes to the relationship between idiosyncratic volatility and stock returns on the Japanese market. Thus, our paper contributes to the existing finance literature by investigation the idiosyncratic risk in the Japanese stock market during the recent period.
Specifically, the following questions are investigated: Does average idiosyncratic risk increase over time?
Is the relation between average idiosyncratic risk and expected market returns positive, negative, or statistically insignificant?
The structure of this article is as follows: Section 2 describes the measures of idiosyncratic risk, while Section 3 presents the dataset and shows preliminary statistics. Section 4 investigates the forecasting ability of idiosyncratic risk, while the last section concludes. 2. Idiosyncratic Risk
In this paper, we use the CAPM to control for systematic risk. The idiosyncratic risk is thus the residual from the regression of the excess return. Daily idiosyncratic return is calculated as the residual of the following regression (see Angelidis and Andrikopoulos, 2010):
𝑟𝑖 = 𝛼 + 𝛽𝑖𝑟𝑚+ 𝜀𝑖 (1) Where,
𝑟𝑖, the stock return,
𝑟𝑚, the value-weighted market return, 𝜀𝑖, the firm-specific return
IV, Idiosyncratic risk in month t,
14 MV, Market risk in month t,
𝑀𝑉 = 𝑛𝑡 𝑣𝑎𝑟(𝑟𝑖,𝑚) (3) The monthly value-weighted asset-specific risk is calculated as,
𝐼𝑉𝑡 = 𝑁𝑖=1𝑤𝑖,𝑡 𝑛𝑡 𝑣𝑎𝑟(𝜀𝑡,𝑖) (4) 𝑤𝑖,𝑡, the market capitalization weight of stock I in month t-1,
𝑛𝑡, the number of days in month t;
Assuming that the βs of all securities against the market are one, (see Xu and Malkiel, 2001), the variance of stock i at month t,(𝑉𝑖,𝑡), is broken in two parts: a systematic variance which is equal to the variance of the market, (𝑀𝑉𝑡) and an idiosyncratic variance which is equal to the variance of the idiosyncratic return (𝐼𝑉𝑖,𝑡). This relation is described in the following equation:
𝑉𝑖,𝑡 = 𝑀𝑉𝑡+ 𝐼𝑉𝑖,𝑡 (5) Therefore, the average aggregate idiosyncratic variance is calculated as:
𝐼𝑉𝑡𝐸𝑞𝑢𝑎𝑙 = 𝑇𝑉𝑡𝐸𝑞𝑢𝑎𝑙 − 𝑀𝑉𝑡𝐸𝑞𝑢𝑎𝑙 (6) The corresponding value weighted asset specific risk is defined as:
𝐼𝑉𝑡𝑉𝑎𝑙𝑢𝑒 = 𝑇𝑉𝑡𝑉𝑎𝑙𝑢𝑒 − 𝑀𝑉𝑡𝑉𝑎𝑙𝑢𝑒 (7) Where,
𝑇𝑉𝑡 𝐸𝑞𝑢𝑎𝑙
is the equally weighted variance of all securities in month t, 𝑇𝑉𝑡𝑉𝑎𝑙𝑢𝑒 is the value weighted variance of all securities in month t.
3. The Sample
Our data are constituted 225 values from the Nikkei 225 index values in a daily basis over the period from January 2000 to July 2014. During this period, not much research on the idiosyncratic risk on the Japanese market was published. This period also coincides with the first decade after a period of deflation in Japan.
Nikkei 225 Index daily return data are collected form Factset Database. Factset is financial database and designates a software editor. The company provides financial information and analytical software for investment professionals
Campbell et al. (2001) show that a decline in overall market volatility in US stock markets from 1962 to 1997. In Europe, Kearney and Poti (2008) find that European stocks have indeed become more volatile, and that idiosyncratic risk is the largest component of this volatility. Figure 1 plots stocks market volatility of Japanese market (Nikkei 225). We observe a big spike in stock market volatility during the 2000 stock market crash; we also observe another spike during the 2008 crash.
15
Figure 1. Stock Market Volatility Nikkei 225
Table 1 shows that stock market volatility in Nikkei 225, we obtained similar results to those of Guo and Savickas (2008).Using equal weights to calculate the idiosyncratic variance increase idiosyncratic risk, the average VI is 0.018 while that of the EV is 0.024. Value-weighted idiosyncratic volatility is persistent with the first-order autoregressive coefficients 0.89, and the autoregressive coefficient decays slowly. Similar observations are made for the equally weighted idiosyncratic volatility and the stock market volatility.
Table 1.Univariate Statistics Descriptive statistics Value-weighted idiosyncratic volatility Equal-weighted idiosyncratic volatility Stock market volatility (Nikkei 225) Stock market return (Nikkei 225) Mean 0.0180 0.0249 0.0049 0.0004 Max 0.1136 0.1289 0.0336 0.1285 Min 0.0029 0.0069 0.0004 -0.2383 Standard deviation 0.0149 0.0182 0.0047 0.0579 Skew 3.15 2.82 3.26 -0.48 Kurt 16.86 13.73 17.71 3.71 J.- B. 1682 1066 1875 10 AR (1) 0.8889 0.8994 0.7998 0.1517 AR (6) 0.6449 0.6866 0.5942 -0.0813 AR (12) 0.5746 0.6268 0.5004 -0.0094
The persistence of idiosyncratic volatility suggests that an increase in the average idiosyncratic volatility is followed by higher than average idiosyncratic volatility in subsequent months (see Angelidis and Tessaromatis, 2008a). Our statistics are comparable to those of Guo and Savickas (2008), who used data over the 1973-2003 period for Japan. Table 2 shows that idiosyncratic volatility in Japan.
0.00% 0.50% 1.00% 1.50% 2.00% 2.50% 3.00% 3.50% 4.00% 01.2000 01.2002 01.2004 01.2006 01.2008 01.2010 01.2012 01.2014 Index Nikkei 225 volatility
16
Table 2. Univariate Statistics (Guo and Savickas, 2008) (Quarterly Observations) Japan Jan 1973 to Dec 2003 Value-weighted idiosyncratic volatility Equal-weighted idiosyncratic volatility Stock market volatility Stock market return Mean 0.024 0.039 0.007 0.001 Standard deviation 0.013 0.018 0.007 0.107
Notes: The Data Stream data for Japan over the period 1973:Q2 to 2003:Q4 (Guo and Savickas, 2008).
In Table 3, we investigate whether it has a stochastic trend using the augmented Dick-Fuller (DF) unit root test. We consider two specifications. We reject the null hypothesis of a stochastic trend for Japan, our results suggest that stock market volatility appears to be stationary. Our finding is very similarly to that of Guo and Savickas (2008), but we don’t find an upward trend in stock market volatility for Japan.
Table 3. Augmented Dick-Fuller Tests (In comparison to Guo and Savickas, 2008)
VWIV EWIV MV
Constant Trend Constant Trend Constant Trend Nikkei 225 01/2000 – 07/2014 -0.572*** -0.532*** -4.307*** -4.438*** -6.677*** -6.678*** Gao and Savickas (2008) 01/1973 – 12/2003 -3.69*** -3.33* -1.85 -3.85** -1.88 -7.92***
Notes: The table reports the results augmented Dick-Fuller unit root tests.
*Denotes significance at the 10% level.**Denotes significance at the 5% level.***Denotes significance at the 1% level. The critical values corresponding to these significance levels are (-2.57, -2.87, -3.43) for the
test with a constant and (-3.14, -3.43, -4.01) for the test with a linear time trend.VWIV is the value-weighted idiosyncratic volatility; EWIV is the equal-value-weighted idiosyncratic volatility; and MV is stock market
volatility.
Figure 2 plots the equal-weighted idiosyncratic volatility (thin line) along with the value-weighted idiosyncratic volatility (thick line). We observe strong co-movement in both measures of idiosyncratic volatility.
Figure 2. Value-(Thick Line) and Equal-Weighted Idiosyncratic Volatility (Thin Line) of All Stocks 0.00% 2.00% 4.00% 6.00% 8.00% 10.00% 12.00% 14.00% 1.2000 1.2002 1.2004 1.2006 1.2008 1.2010 1.2012 1.2014 Equal-weighted idiosyncratic volatility
17 4. Forecasting Ability of Idiosyncratic Risk
The existing evidence on the relationship between idiosyncratic volatility and future stock returns in the US market is conflicting. In this section, we investigate whether average idiosyncratic volatility forecasts stock market. We examine the relationship between idiosyncratic variance and subsequent stock returns in the Japanese markets by regressing capitalization weighted excess monthly market stock returns on various measures of lagged volatility. We estimate the following equation:
𝑟𝑡+1= 𝛼 + 𝛽𝑋𝑡+ 𝜀𝑡+1 (8) Where,
𝑟𝑡+1, is the log excess monthly return of the market at month t+1
𝑋𝑡, includes different combinations of market and idiosyncratic volatilities. And t = 2000:01, 2014:06
Market variance is included since the CAPM predicts a linear and positive relation between market returns and systematic volatility. Based on the evidence of positive skeweness and excess kurtosis, we take logarithmic transformations of the idiosyncratic risk measures.
Table 4. Forecasting Stock Returns Using Equal and Value-Weighted Idiosyncratic Volatility
Forecasting Stock Returns MV(-1)
Adjusted R²
-0.0261 (-0.028) -0.006
Equal-weighted idiosyncratic volatility Value-weightedidiosyncraticvolatility EWIV(-1) Adjusted R² -0.419* (-1.731) 0.011 VWIV(-1) Adjusted R² -0.437 (-1.484) 0.007 MV(-1) EWIV(-1) Adjusted R² 1.762 (1.443) -0.716** (-2.258) 0.018 MV(-1) VWIV(-1) Adjusted R² 2.078 (1.535) -0.914** (-2.139) 0.015
Notes: The table reports the forecast regression results of stock market returns on the equal-weighted
idiosyncratic volatility (EWIV), value-weighted idiosyncratic volatility (VWIV) and stock market volatility (MV). The t-statistics are reported in parentheses.*Denotes significance at the 10% level. **Denotes significance at the 5% level. The data are used for the Nikkei 225 over the period 2000:01 to 2014:06.
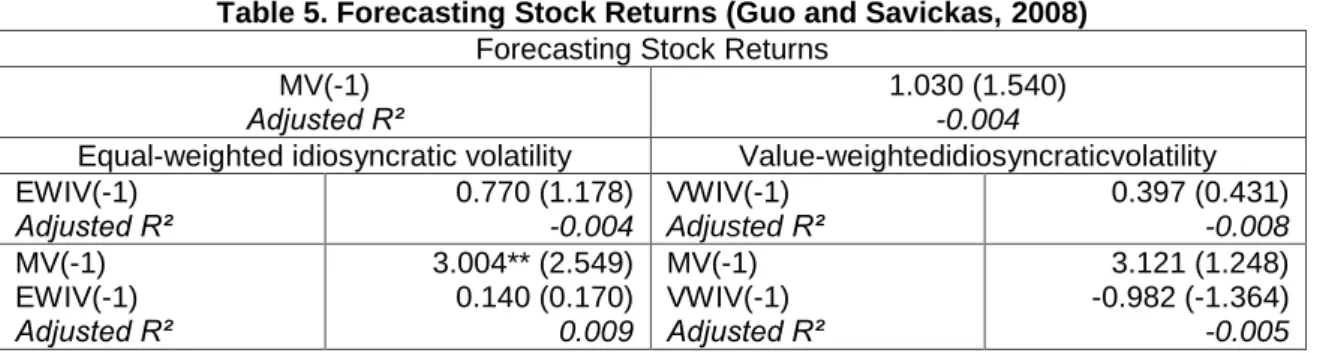
Similarly to Guo and Savickas (2008), we find that the EWIV and VWIV are negatively related to stock market returns (Table 4). We show that MV does not forecast stock market returns. Again, the value-weighted idiosyncratic volatility itself does not forecast stock market returns in Japan. For comparison, we show the results of Guo and Savickas (2008) in Table 5. The equal-weighted idiosyncratic volatility by itself is negative and statistically significant. We show that MV does not forecast stock market returns either (the first row, Table 4). If we include both MV and the EWIV in the forecasting equation, the effect of the EWIV becomes significantly negative, as well as for VWIV.
18
Table 5. Forecasting Stock Returns (Guo and Savickas, 2008) Forecasting Stock Returns
MV(-1) Adjusted R²
1.030 (1.540) -0.004
Equal-weighted idiosyncratic volatility Value-weightedidiosyncraticvolatility EWIV(-1) Adjusted R² 0.770 (1.178) -0.004 VWIV(-1) Adjusted R² 0.397 (0.431) -0.008 MV(-1) EWIV(-1) Adjusted R² 3.004** (2.549) 0.140 (0.170) 0.009 MV(-1) VWIV(-1) Adjusted R² 3.121 (1.248) -0.982 (-1.364) -0.005 5. Conclusions and Suggestions for Future Research
Our study confirms the existence of a positive relationship between the equally weighted measure of idiosyncratic risk and subsequent stock returns on the Japanese stock market. This result poses a problem regarding the validity of the CAPM, according to which the expected yield of securities depends on the systematic risk level. Indeed, according to our finding, beta levels are not able to entirely explain security return rates. Similar to the size effect, the issues of the idiosyncratic risk can be justified by the problems of liquidity and lack of visibility or medium-sized enterprises compared to the rest of the market. It creates the possibility of arbitrage, from which investment funds should profit. Could Asset-specific risk be a proxy for systematic risk omitted from the capital-asset pricing model (CAPM)? It is important to investigate whether our finding on the Nikkei 225 index are also featured in the equity markets of other countries.
References
Ang, A., Hodrick, R.J., Xing, Y., and Zhang, X., 2009. High idiosyncratic volatility and low return: International and further U.S. evidence. Journal of Financial Economics, 91, pp.1-23.
http://dx.doi.org/10.1016/j.jfineco.2007.12.005
Angelidis, T. and Andrikopoulos, A., 2010. Idiosyncratic risk, returns and liquidity in the London Stock Exchange: A spillover approach. International Review of Financial Analysis, 19, pp.214-221. http://dx.doi.org/10.1016/j.irfa.2010.02.002
Angelidis, T. and Tessaromatis, N., 2008a. Does idiosyncratic risk matter? Evidence from European stock markets.Applied Financial Economics, 18, pp.125-137.
http://dx.doi.org/10.1080/09603100601118276
Angelidis, T. and Tessaromatis, N., 2008b. Idiosyncratic volatility and equity returns: UK evidence.International Review of Financial Analysis, 2008, 17, pp.539-556.
http://dx.doi.org/10.1016/j.irfa.2006.10.006
Bali, T.G., Cakici, N., Yan, X., and Zhang, Z., 2005. Does idiosyncratic risk really matter?.The Journal of Finance, 60(2), pp.905-929. http://dx.doi.org/10.1111/j.1540-6261.2005.00750.x
Bekaert, G., Hodrick, R.J., and Zhang, X., 2008. International stock return comovements. ECB Working Paper, No.931.
Brandt, M.W., Brav, A., Graham, J.R., and Kumar, A., 2008. The idiosyncratic volatility puzzle: Time trend or speculative episodes?. McCombs Research Paper Series, No.Fin-02-09. Brown, D.P. and Ferreira, M.A., 2004. Information in the idiosyncratic volatility of small firms.
Maastricht Meetings Paper, No.3020.
Campbell, J.Y., Lettau, M., Malkiel, B.G., and Xu, Y., 2001. Have individual stocks become more volatile? An empirical exploration of idiosyncratic risk. The Journal of Finance, 56(1), pp.1-43. http://dx.doi.org/10.1111/0022-1082.00318
Goyal, A. and Santa-Clara, P., 2003. Idiosyncratic risk matters!. The Journal of Finance, 58(3), pp.976-1007. http://dx.doi.org/10.1111/1540-6261.00555
19
Guo, H. and Savickas, R., 2008. Average idiosyncratic volatility in G7 countries. The Review of Financial Studies, 21(3), pp.1259-1296. http://dx.doi.org/10.1093/rfs/hhn043
Kearney, C. and Poti, V., 2008. Have European stocks become more volatile? An empirical investigation of idiosyncratic and market risk in the Euro Area. European Financial Management, 14(3), pp.419-444. http://dx.doi.org/10.1111/j.1468-036X.2007.00395.x
Timotheos, A., 2010. Idiosyncratic risk in emerging markets. The Financial Review, 45, pp.1053-1078. http://dx.doi.org/10.1111/j.1540-6288.2010.00285.x
Wei, X.S. and Zhang, C., 2005. Idiosyncratic risk does not matter: A re-examination of the relationship between average returns and average volatilities. Journal of Banking and Finance, 29, pp.603-621. http://dx.doi.org/10.1016/S0378-4266(04)00050-0
Xu, Y. and Malkiel, B.G., 2001. Idiosyncratic risk and security returns. AFA 2001 New Orleans Meetings, [online] Available at: <http://ssrn.com/abstract=255303> [Accessed July 2014].