Publisher’s version / Version de l'éditeur:
Vous avez des questions? Nous pouvons vous aider. Pour communiquer directement avec un auteur, consultez la première page de la revue dans laquelle son article a été publié afin de trouver ses coordonnées. Si vous n’arrivez pas à les repérer, communiquez avec nous à PublicationsArchive-ArchivesPublications@nrc-cnrc.gc.ca.
Questions? Contact the NRC Publications Archive team at
PublicationsArchive-ArchivesPublications@nrc-cnrc.gc.ca. If you wish to email the authors directly, please see the first page of the publication for their contact information.
https://publications-cnrc.canada.ca/fra/droits
L’accès à ce site Web et l’utilisation de son contenu sont assujettis aux conditions présentées dans le site LISEZ CES CONDITIONS ATTENTIVEMENT AVANT D’UTILISER CE SITE WEB.
Optics Express, 27, 2, pp. 1507-1519, 2019-01-16
READ THESE TERMS AND CONDITIONS CAREFULLY BEFORE USING THIS WEBSITE. https://nrc-publications.canada.ca/eng/copyright
NRC Publications Archive Record / Notice des Archives des publications du CNRC :
https://nrc-publications.canada.ca/eng/view/object/?id=d85700d9-dfe0-4361-a010-404e324a9beb https://publications-cnrc.canada.ca/fra/voir/objet/?id=d85700d9-dfe0-4361-a010-404e324a9beb
This publication could be one of several versions: author’s original, accepted manuscript or the publisher’s version. / La version de cette publication peut être l’une des suivantes : la version prépublication de l’auteur, la version acceptée du manuscrit ou la version de l’éditeur.
For the publisher’s version, please access the DOI link below./ Pour consulter la version de l’éditeur, utilisez le lien DOI ci-dessous.
https://doi.org/10.1364/OE.27.001507
Access and use of this website and the material on it are subject to the Terms and Conditions set forth at
Spectral degradation of Type II π-phase-shifted fiber Bragg gratings
due to femtosecond laser induced loss
Spectral degradation of Type II
π-phase-shifted fiber Bragg gratings due to
femtosecond laser induced loss
D
ANG
ROBNIC,
*C
YRILH
NATOVSKY,
ANDS
TEPHENJ. M
IHAILOVNational Research Council of Canada, Security and Disruptive Technologies, 100 Sussex Drive, Ottawa, ON K1A 0R6, Canada,
*Dan.Grobnic@nrc-cnrc.gc.ca
Abstract: Narrowband high-temperature stable fiber Bragg gratings (FBGs) can be made by introducing a π-phase shift in the middle of a Type II periodic grating structure. This creates a passband inside the wavelength rejection band. During the inscription of Type II Bragg gratings broadband, optical loss is induced in the fiber core as a result of interaction between the inscription beam and the silica host. The amount of broadband loss will determine the passband’s spectral characteristics (bandwidth and loss).
© 2019 Optical Society of America under the terms of the OSA Open Access Publishing Agreement
1. Introduction
Fiber optic sensors (FOS) have applications in power generation, aerospace, extraction process control, healthcare and environment monitoring [1]. Obvious advantages, such as low weight, small size, immunity to electromagnetic interference, multiplexing capability and high sensitivity, make FOS a desirable alternative to traditional sensing technology. To a large extent, FOS research has focused on low ambient temperature applications. However, the growing demands from the industrial sector to monitor gas turbines, coal gasification reactors, jet engines, nuclear reactors, thermal shields, unconventional oil extraction, high-voltage transformers, etc., has resulted in intense research and development in the field of sensing, including FOS, at high and very high (> 1000°C) ambient temperature [2]. The latter regime is especially challenging due to the fast thermal degradation of sensors.
A fiber Bragg grating (FBG), formed by a periodic change in the refractive index of the fiber core, is a compact FOS that can be easily multiplexed to produce a distributed sensor for real-time monitoring. FOS are already commonly used in low ambient temperature applications such as structural health monitoring of civil structures [3]. However, it is known that Type II FBGs [4], which can be written in fibers with femtosecond (fs) pulse duration laser radiation above a certain intensity threshold, have proven to be stable at temperatures approaching 1000°C [5,6]. Type II FBGs usually have a spectral bandwidth in the range of a few hundred picometers (pm) for a 5 - 10 mm grating length [7] and because of the relatively broad spectrum can be used for only low resolution measurements. While narrowband laser-based sensors for high ambient temperature have been proposed [8], an obvious solution to the demand for sub-picometer measurement accuracy would be the use of π-phase-shifted (π-PS) FBGs [9]. In theory, the characteristic passband in the transmission spectrum can be made extremely small (sub-picometer) [10] by simply increasing the grating length and/or the grating strength. Unfortunately, the inscription of Type II FBGs is associated with induced insertion or scattering loss in the signal transmission along the fiber [11] and increasing the grating length and/or strength results in an increase of the broadband loss of the signal that propagates though the grating. While not identical, a π-PS grating behaves similarly to a FBG Fabry-Pérot (F-P) cavity, where the loss in the cavity will result in attenuation of the signal transmitted at the resonance wavelength and broadening of the passband bandwidth [12]. This degradation of the passband derives from the decrease of the cavity finesse (the cavity loss can be construed as having the effect of decreasing the reflectivity of the cavity mirrors).
#352181 https://doi.org/10.1364/OE.27.001507 Journal © 2019 Received 16 Nov 2018; revised 11 Jan 2019; accepted 12 Jan 2019; published 16 Jan 2019
While these effects have been recently experimentally observed during the inscription of high-temperature stable π-PS FBGs in SMF-28 fibers [13], the purpose of the paper is to establish experimentally and theoretically the limits of the passband characteristics (loss and bandwidth) that are to be expected when a Type II π-PS Bragg grating is inscribed. A further objective of this paper is to establish the relationship between the laser exposure and the passband parameters that will be needed for any specific application. The effects of fs-laser-induced birefringence on the passband are discussed elsewhere [14].
2. Experiment
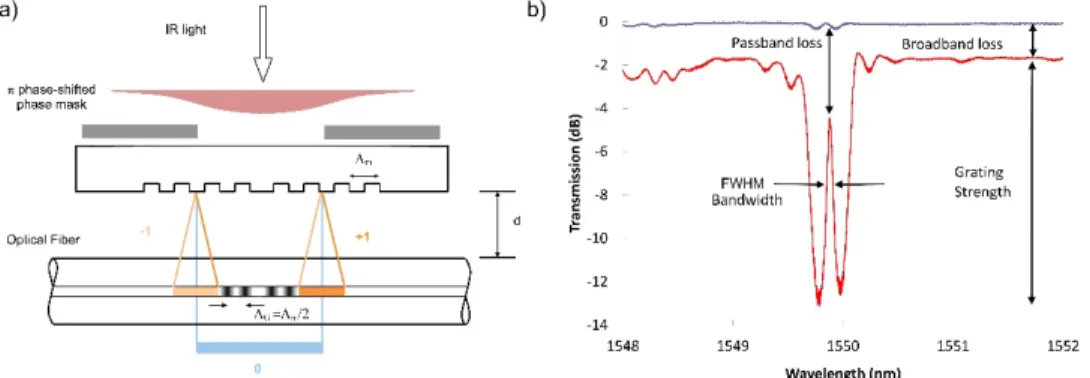
Type II π-PS-FBGs were inscribed in Corning SMF-28 fiber (effective refractive index of the core at 1550 nm is neff = 1.447) using an 80 fs regenerative amplifier operated at a 800 nm wavelength. The laser beam was focused with an acylindrical lens having a 12 mm focal length through a specialized phase mask into the fiber core, resulting in a ~2 μm wide linear-shaped laser focus with a ~20 μm Rayleigh range (Fig. 1(a)). The phase mask had a pitch Λm
of 3.21 μm and a displacement in the center of the grating pattern of 803.25 nm, creating the π-phase shift in the resultant FBG. When two-beam interference from the generated ± 1 orders is used, a third-order resonant Bragg grating with the pitch given by ΛG = Λm/2 is
created. In order to minimize thermal effects in the core, the laser repetition rate was reduced to 1 Hz [15]. The fiber was placed roughly 150 µm away from the phase mask. The 7 mm laser beam was expanded ~3 times along the fiber (i.e., perpendicular to the phase mask’s grooves) and then apertured with a 7 mm slit centered with the phase shift on the phase mask. To inscribe Type II FBGs in the above focusing configuration the fiber was exposed with 1 - 20 pulses. The pulse energy used for the inscription was ~3 times larger than the pulse energy required to induce Type I modification [4] in SMF-28 fiber under otherwise the same writing conditions. The pulse polarization was aligned along the fiber [13,14]. The transmission and reflection spectra of the gratings were monitored using a tunable laser with a 1 pm resolution.
Fig. 1. (a) Schematic of the set-up for fs-laser exposure through a phase-shifted (PS) phase mask; (b) definitions of the spectral characteristics of a lossy π-PS-FBG.
The spectral parameters that are used further in the text to characterize lossy FBGs are presented in Fig. 1(b). The broadband loss is defined as the difference between the signal level before laser exposure and the signal level measured away from the Bragg resonance on the long wavelength side of the transmission spectrum. The passband loss is defined as the difference between the signal level before laser exposure and the signal level at the maximum of the passband. The passband bandwidth is defined as the FWHM of the passband spectrum. The grating strength is defined as the absolute value of the minimum transmission (in dB) of an FBG measured from the signal level on the long wavelength side of the transmission spectrum.
3. Mathematical description of π-PS-FBG with broadband loss
The simplest phase-shifted fiber Bragg grating consists of two periodic structures that are in close proximity and out of phase with each other. A π-phase-shifted FBG (π-PS-FBG) has the phase shift between the two structures set at π-radians. This is created by making a gap in the phase mask pattern that is ¼ of the mask pitch (Fig. 1(a)). A relation between the broadband loss and the passband parameters (i.e., loss and bandwidth) for such a π-PS-FBG is derived below.
3.1 Coupled mode Eq. (-)Transfer matrix (CME-TM) description of π-PS-FBGs with cavity loss
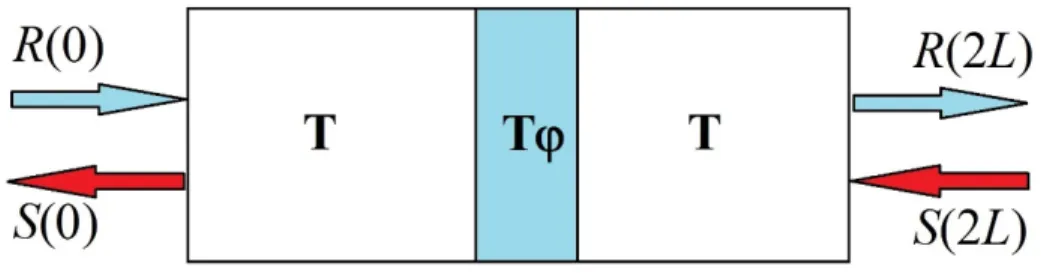
In order to determine the spectral characteristics of electromagnetic field propagating through a low loss π-PS-FBG, the mathematical model is usually based either on an analytical (or numerical) solution of the pertinent coupled mode equations [16] or a transfer matrix approach with the transfer matrix elements calculated using standard coupled mode theory [17]. When the signal propagation in a π-PS-FBG is affected by high loss, which is the case for typical Type II gratings, the process of finding a direct analytical solution of the system of coupled mode differential equation is rather cumbersome and we prefer to use the transfer matrix method instead. The π-PS-FBG is assumed to consist of two identical gratings, with each of them being defined by a transfer matrix T. The phase shift between the constituent identical gratings (see Fig. 2) is represented by a diagonal matrix Tφ, whose elements are given by [17]:
11 exp( ) and 22 exp( )
Tϕ = +ij Tϕ = −ij (1)
where the total phase difference of the signal 2φ is equal to π in our case.
For a uniform FBG characterized by the refractive index modulation (Δn), overlap integral of the grating planes and the fiber core (η), effective refractive index of the core (neff), Bragg
wavelength (λB = 2neffΛG), and grating loss coefficient (αloss), it is also convenient to define
some additional grating parameters, as in [18]:
(
)
eff B
Wavelength detuning : d = 2pn 1/l−1/l (2) loss
DC self coupling coefficient : s d ia− = + (3) B
AC coupling coefficient : k k= ph n lD / (4) The loss coefficient αloss can be calculated from the broadband loss defined in Fig. 1(b).
If R(L), R(0) and S(L), S(0) are respectively the forward (R) and backward (S) field amplitudes at the end and at the beginning of each of the two constituent gratings of length L that form the π-PS-FBG, then according to [18]:
(0) ( ) (0) ( ) R R L S S L = T (5)
If the following notations are introduced:
2 2 1/ 2
cos h( ), sin h( ), ( ) , / , /
A= gL B= gL g= k −s a s g b k gi= = (6) then the elements Tij of the FBG transfer matrix T, as defined in [18], become:
11 , , , 12 21 22
T = +A iaB T =ibB T = −ibB T = −A iaB (7)
The transfer matrix of the π-PS-FBG under consideration (see Fig. 2) is then given by TPS =
Fig. 2. Block diagram of the π-PS-FBG structure described in the text.
The boundary conditions for the field in this π-PS-FBG will be:
( )
0 1,( )
2 0R = S L = (8)
By incorporating these boundary conditions into the transfer matrix equation PS (0) (2 ) (0) (2 ) R R L S S L = T (9)
and performing the multiplication of the transfer matrices, the transmission coefficient τ =
R(2L)/R(0) can be expressed as:
2 2 2
11 12 21
1/τ=T −T T = −1 2α B +2i ABα (10) Equation (10) fully relates the grating spectrum to the broadband loss and grating structure.
Using Eq. (10), the transmission spectrum (Ttran = Ttran(λ) = |τ|2) of a π-PS-FBG having a 7
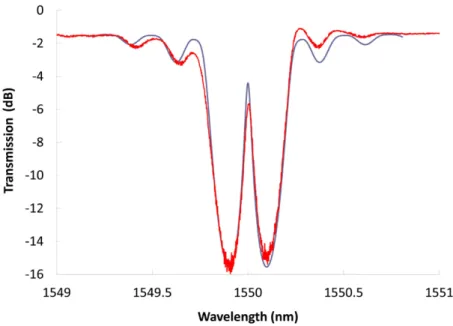
mm length (i.e., L = 3.5 mm), 1.5 dB broadband loss and 14dB grating strength, is numerically calculated as Ttran =τ δ( )2 (the detuning δ being related to λ by Eq. (2)) and presented together with the measured spectrum of a grating of similar physical and spectral characteristics (see Fig. 3). The best fit between the experimental and simulated spectra was achieved for k = 4.56 × 10⁻⁴ µm−1 and αloss = 2.2 × 10⁻⁵ µm−1. It can be observed that while in
both cases the general spectral shape is the same, the measured side lobes are smaller than the simulated ones, which indicates a certain degree of apodization occurring during grating inscription. It can also be seen that the passband loss is slightly larger in the experiment compared to the simulations.
Fig. 3. Measured spectrum of a π-PS-FBG (red) versus a spectrum of a π-PS-FBG simulated using Eq. (10) (blue).
The purpose of the following derivations is to determine the passband loss and passband bandwidth for the detuning δ [Eq. (2)] within a narrow wavelength range around λB from the
spectral shape of the passband TPB = TPB(δ, αloss, k) = |τ(δ, αloss, k)|2 given by Eq. (10). The
passband loss is uniquely defined as PBloss = log10(Tmax), where Tmax is the maximum value of
the passband transmission function Tmax = TPB(0, αloss, k). The passband bandwidth, on the
other hand, can be defined as the FWHM of the spectrum TPB = TPB(δ, αloss, k) either in terms
of wavelength Δλ(αloss, k) or in terms of wavelength detuning Δδ(αloss, k).
3.1.1 Passband loss of the π-PS-FBG at the Bragg wavelength (δ = 0) If we introduce loss 0 2 loss / 1 ( / ) k k α α α =
+ , then according to Eqs. (3) and (6): loss 0 i i α α= γ = α (11)
In this case, the coefficients γ, A and B are real numbers and the derivation of the transmission coefficient using Eq. (10) will allow the calculation of the π-PS-FBG passband maximum transmission Tmax as a function of loss (αloss) and the coupling coefficient k:
2 2 2 2
max 1/ (1 2 0 2 0 )
T =τ = + α B − α AB (12)
3.1.2 π-PS-FBG transmission spectrum for no broadband loss
When αloss =0, all the coefficients defined in Eq. (6) have real values. Then, from Eq. (10):
2 2 2 4
PB( ,0, ) 1/ (1 4 (1 ) ),
T δ k =τ = + α +α B (13)
where α δ= / k2−δ2 .
This formula for the transmission spectrum also allows for the calculation of the bandwidth of a lossless π-PS-FBG. If we define a dimensionless quantity ε = δ/k, then
2 / 1
α ε= −ε and the solution ε0 of the equation TPB(ε, 0, k) = 1/2 is ε0 = B/22 (we are
mainly interested in the case of a narrow bandwidth and relatively high reflectivity, i.e. ε <<1). Since the reflectivity ρ of a uniform grating is related to the grating structure by the well-known relation ρ = tanh2(kL) [18], then B2 = sinh2(kL) term can be expressed as a
function of ρ, which leads to:
0
2ε = −(1 r r) / (14)
Using ε0 = (δ0L)/(kL) and the relation between the reflectivity and kL one arrives at the
following expression for the detuning:
1 0 1 1 (0, ) 2k tan h ( ) L ρ δ δ ρ ρ − − Δ = = (15)
Equation (15) relates the detuning bandwidth to the grating length through L and to refractive index modulation (Δn) through ρ. Since Δδ is directly related to the wavelength bandwidth (Δλ), Eq. (15) also shows that for a fixed ρ in the absence of loss the passband bandwidth is halved when the grating length is doubled. It will be shown later that this property it is not true for gratings with loss. As can be seen in Fig. 4 for the case of a 7 mm π-PS-FBG, the passband bandwidth calculated using Eq. (15) closely follows the correct result of the OPTIVAVE simulator when the reflectivity ρ of the constituent gratings is larger than 40%.
At this point we would like to note that the main experimentally measured quantity that defines the spectrum of lossy π-PS-FBGs in this text is the grating strength in transmission (Fig. 1). On the other hand, the analytical expressions derived hereinafter to describe the spectral characteristics of lossy π-PS-FBGs are expressed in terms of the product kL and, therefore, the reflectivity ρ of the constituent lossless gratings of which the lossy π-PS-FBGs are comprised of.
3.1.3 π-PS-FBG transmission for low broadband loss and high reflectivity
For a weak broadband loss, the loss coefficient (αloss) is a complex number. In the case of a
relatively high grating reflectivity and for a wavelength range close to the Bragg resonance (δ/k <<1, αloss/k <<1, γ = k), the loss can be expressed as:
Fig. 4. Bandwidth calculated using the FBG simulator OPTIWAVE (black bullets) versus the high reflectivity approximation (red squares) using Eq. (15).
1 i 0 with 1 / / and k 0 loss/ loss/k
α α= + α α δ γ δ= ≈ α =α γ α≈ (16)
Under these conditions, Eq. (10) can be used to calculate the transmission spectrum around the Bragg wavelength (i.e., at the passband) as:
1 1 2 4
PB max 4 1 (1 2 0 / ),
T − =T− + α B − α A B (17)
where 1 + 2α02≈1 and α14B4≈0 approximations were used in the derivation of (17). Using Eq.
(17) and the notation ε = δ/k, the solution ε1/2 of the equation TPB = Tmax/2 becomes:
[
]
(
)
1/ 2 max 0
2ε = (1−ρ ρ) / / T 1 2− α / ρ , (18) where, as before, ρ = tanh2(kL). By combining Eqs. (18) and (15) and ignoring the term
0
2α / ρ in Eq. (18) for the case of low broadband loss and high reflectivity, the detuning can be calculated from:
loss max
( , )k T (0, )k
δ α δ
Δ = Δ (19)
This formula relates the passband bandwidth of a lossy π-PS-FBG with the transmission loss
Tmax to the passband bandwidth of an ideal lossless π-PS-FBG when the grating strengths are
equal. Obviously, Eq. (19) is also valid for the wavelength bandwidth (i.e., Δλ(αloss, k)) of the
passband.
3.1.4 Fabry-Perot (F-P) representation of the π-PS-FBG
The π-PS-FBG is a particular case of a F-P fiber interferometer comprised of two identical separate Bragg gratings that are π-radians out of phase with each other.
The general expression for the transmission of a lossy F-P interferometer consisting of two identical mirrors of reflectivity R separated by l is given in [19]:
(
)
2{
(
)
2( )
}
12
( , , ) 1 · 1 · 1 sin ,
T l R V = −R V −RV +F Kl − (20)
where V = exp(-αl) is the loss factor of the interferometer (α is the loss per unit length), F = 4RV/(1-RV)2 is the finesse of the interferometer, and K = 2πn/λ (λ is the wavelength and n is
the effective refractive index of the medium inside the interferometer) is the propagation constant.
Equation (20) can also be applied to a lossy π-phase shifted F-P fiber interferometer with FBG mirrors in order to find ts passband loss Tmax = max [T(λ,R,V)] and the FWHM passband
bandwidth Δλ. In this case, however, l = L0 + 2·Leff, where L0 is the separation between the
Bragg gratings and L is the physical length of each Bragg grating, as defined earlier in the text. Taking into account the fact that the effective penetration length Leff of the signal into a
Bragg gratings is given by [20]:
1 eff / (2 tan h ( )
L =L R − R (21)
and L0 = 0 for the π-PS-FBGs under consideration, the formulas for Tmax and Δλ can be
written as: 2 2 max (1 ) / (1 ) T = −R V −RV (22) 2 eff eff ( / n L ) arcsin(1/ 2 F), λ λ π Δ = + (23)
with Δλ being derived from the condition T(λ,R,V) = Tmax-Tmin/2, where Tmin is the minimum
4. Results and discussion
The outcome of high-intensity fs-laser-glass interactions is dielectric breakdown that results in refractive index changes that are permanent at temperatures approaching the glass transition temperature. For certain exposure conditions (beam intensity, number of pulses and pulse duration) the refractive index changes can be highly birefringent as they are the result of the creation of self-organized nanogratings [21]. The presence of nanogratings in Type II FBGs is likely responsible for their thermal stability at high temperatures, but also for the loss induced in the fiber core during laser exposure [6,13]. In the case of π-PS-FBGs, the broadband loss degrades the spectral shape of the transmission passband.
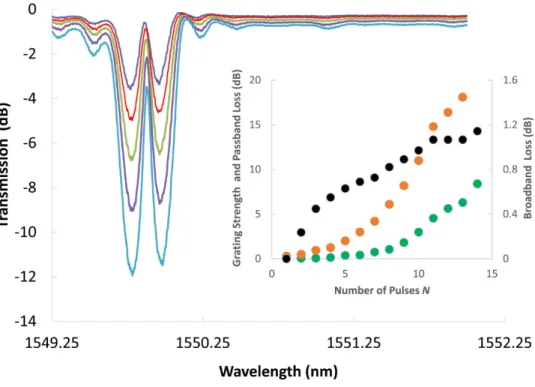
Spectra of π-PS-FBG structures created with up to 14 single pulses, some of which are presented in Fig. 5, were processed to evaluate the spectral parameters of interest defined in Fig. 1(b). By analyzing the spectra in Fig. 5 one can see that the evolution of the broadband loss shows a rapid initial increase for the first few pulses until the grating reaches a 1 dB strength, after which the loss increases at a slower pace (Fig. 5 inset). Conversely, the grating strength in transmission and passband loss initially increase slowly, but then faster after a larger number of pulses N has been accumulated. This may indicate a nonlinear causal relation between the passband loss and broadband loss, the parameters that in the CME-TM and F-P models determine the passband bandwidth. In the particular case of a lossy π-PS-FBG, the broadband loss and the grating strength are also related since they both originate from the same exposure process.
Fig. 5. (Successive transmission spectra recorded after each irradiation pulse starting from N = 5 and ending with N = 9; Inset: Evolution of the broadband loss (black bullets), passband loss (green bullets) and grating strength (orange bullets) with the number of pulses N.
The evolution of the broadband loss and passband loss as a function of the grating strength is shown in Fig. 6(a). While the broadband loss eventually levels off as the grating strength increases, the passband loss keeps on growing together with the grating strength. The direct relationship between the passband loss and the broadband loss is highly nonlinear (Fig. 6(b)).
Fig. 6. (a) Broadband loss (black bullets) and passband loss (red bullets) as a function of grating strength; (b) Passband loss as a function of broadband loss for the data presented in Fig. 6(a).
In order to compare the experimentally measured passband loss with that predicted by the CME-TM model (i.e., Eq. (12)) and the F-P model (i.e., Eq. (21)), the pertinent data are plotted in Fig. 7. It needs to be mentioned that although the simulated data in Fig. 7 are presented as a univariate relationship (i.e., passband loss vs. grating strength), they are actually bivariate as each point is calculated using the measured grating strength and the broadband loss in Eqs. (12) and (21). Even though both the CME-TM model and the F-P model (respectively, blue triangles and red squares in Fig. 7) reasonably agree with the experiment (black bullets in Fig. 7), the rigorous CME-TM model produces results that are more consistent with the measured data. Both models show that for a grating strength larger than 10 dB the passband loss exceeds 3 dB.
Fig. 7. (a) Comparison of CME-TM and F-P simulations of passband loss (blue triangles and red squares, respectively) with measured values (black bullets) as a function of grating strength; (b) comparison of CME-TM simulations of passband bandwidth with and without loss (blue triangles and red squares, respectively) and the experimental data (black bullets) as a function of grating strength.
The measured FWHM bandwidth of the passband spectra of the recorded π-PS-FBG are plotted in Fig. 7 (black bullets). After a quasi-linear decrease in bandwidth with increasing grating strength, the bandwidth stabilizes at ~40 pm after the grating strength reaches 15 dB. The CME-TM simulations for gratings with zero loss (red squares in Fig. 7(b)) show a much steeper decrease of the passband bandwidth resulting in less than half of the measured grating bandwidth at a 15 dB grating strength and a further decrease to almost a pm-level when the grating strength exceeds 20 dB. Incorporating loss into the full numerical calculation (Eq. (10)) gives values (blue triangles in Fig. 7(b)) that are closer to the measured passband bandwidth values.
Interestingly, in the case of the F-P model, the passband bandwidth (not presented here) calculated using Eq. (22) gives almost the same results as the CME-TM model for a grating strength larger than 3 dB. In this model the influence of the broadband loss on the passband loss (Eq. (21)) is implicit through the defined quantities of the penetration length and the finesse factor. For a grating strength smaller than 7 dB the CME-TM simulations that incorporate loss are very consistent with the measured results, while the F-P model tends to overestimate the passband bandwidth for a grating strength less than 3dB. While both the CME and F-P models give similar results (~21 pm) for a grating strength larger than 20dB, they underestimate the measured passband bandwidth, which levels off at ~37 pm (Fig. 7(b)).
Since the result presented above is just one example, it is interesting to see whether the statistical distribution of the experimental data is generally broad enough to cover the theoretical case. For this purpose, 35 Type II π-PS-FBGs with a grating strength from 14 to 16 dB were written in SMF-28 fiber following the procedure described above. Such gratings correspond to the start of the “plateau” in both the experimental and theoretical results presented in Fig. 7. As can be seen in Fig. 8, the 35 passband bandwidth results presented in the form of a histogram follow a quasi-Gaussian distribution with a ~40 pm average and 3.8 pm standard deviation. If we assume that both the grating inscription and measurement are affected by random errors, then the lower limit of the expected distribution will be 28 pm, which is close to the predicted value. This result seems to indicate that the physical models used above, i.e. a lossy π-PS-FBG and a lossy π-shifted F-P structure, are incomplete.
Fig. 8. Histogram of 35 Type II π-PS-FBG passband bandwidth measurements having grating strength in the range of 14 to 16 dB in transmission.
While the above comparison of the experimental and simulated data suggests that our theoretical analysis has some limitations, both the models can still be used to estimate the minimum passband bandwidth that can be achieved with a lossy Type II π-PS-FBG. Both the experiment and the two models also seem to indicate that above a certain level increasing reflectivity does not result in a lower bandwidth. However, it is known – at least in the case of lossless gratings – that the bandwidth is very sensitive to the grating length (see Eq. (15), and it is thus worth evaluating the effect of the grating length on the passband bandwidth. In the CME-TM model the Eq. (19) relates the passband bandwidth directly to the passband loss
Tmax, and Tmax by means of Eq. (12) directly to the broadband loss. By concentrating on
sensing applications, for which the grating strength is generally larger than 3 dB, and neglecting the quadratic loss term in Eq. (12), which represents less than 20% of the linear
term, Tmax can be written as Tmax (1 α0AB)2
−
= − . The relative change of the passband FWHM given by (19) will then be:
loss loss 0 2 ( , ) / (0, ) 1 2 1 , 1 L k k AB kL α ρ δ α δ α ρ Δ Δ = + = + − (24)
where the definition (16) of the absorption coefficient α0 was used together with the Eq. (6)
between A, B and kL. The above formula can thus be re-arranged using Eq. (15) as: loss loss 2 ( , )k (0, )k α δ α δ ρ Δ = Δ + (25)
Equation (25), which also provides — up to a multiplication constant — a relation for the wavelength bandwidth (Δλ), seems to indicate that in the approximation of high reflectivity (> 50%) and low loss, the contribution of the loss coefficient to the passband broadening is linear. However, the loss coefficient αloss and the reflectivity ρ are not independent variables.
The perturbation term in (25) will not go to zero for high reflectivity gratings since when ρ grows so does αloss. Both the loss coefficient αloss and coupling coefficient k depend on the
laser exposure and can be calculated from the broadband loss and the grating strength, respectively. For the grating presented above, it can be empirically shown, with the data used to make the plot in Fig. 6(a), that the material relation between αloss and k is
5 loss 0.74(ln( / )10k k0
α = − for k
0L = 0.05 (the correlation coefficient r of the linear relation
between |αloss| and ln(k) is 0.99). Then, Eq. (25) becomes: 0 loss ln( / ) ( , )k (0, ) constk kL k L λ α λ ρ Δ = Δ + (26)
As ρ and kL are connected through ρ = tanh2(kL) and the refractive index modulation (derived
from k) is proportional to the laser-material exposure, Eq. (26) can be seen as a causal relation between the laser exposure and the broadening of the passband. Based on Eq. (26), the passband bandwidth of π-PS-FBGs with length from 5 mm to 10 mm is presented in Fig. 9 for different reflectivities of the constituent gratings. It can be seen that when the reflectivity of the constituent gratings is larger than 98%, increasing the grating length does not bring a significant narrowing of the bandwidth. Strictly speaking, the dependencies presented in Fig. 9 are only valid when the loss is induced by the above inscription method. Lower or higher losses will result in different numerical values although the general trend will probably stay the same.
Fig. 9. Passband bandwidth for 40% (red), 60% (black), 80% (orange) and 98% (blue) reflectivity of the constituent gratings vs the π-PS-FBG’s length.
5. Conclusions
Type II π-phase shifted FBGs, which are thermally stable at 1000°C, were inscribed in SMF-28 optical fiber using femtosecond radiation and a phase-shifted phase mask. All the gratings inscribed demonstrated a certain amount of broadband loss that was dependent on the amount of laser exposure. The passband loss and bandwidth of phase shifted Bragg gratings suffering from broadband loss showed a large increase in the passband loss and bandwidth compared to Type-I π-phase-shifted FBGs, which can be considered lossless. This effect has to be taken into account when designing devices based on phase shifted structures. For instance, for the gratings evaluated in these experiments (i.e., 7 mm-long gratings with a 16-20 dB strength (i.e., 95 - 99% reflectivity) and the phase shift in the center), passband losses up to 8 dB were observed, which resulted in a fivefold broadening of the passband bandwidth compared to ideal lossless gratings with the same characteristics. In order to answer the question if the experimental data are the result of a non-ideal test conditions or a consequence of a physical limitation due to the grating structure, two models were used to simulate the spectral behavior of π-phase shifted FBGs affected by broadband loss, namely: 1) the Fabry–Pérot (F-P) model of the π-phase-shifted FBG that considers two adjacent identical Bragg reflectors and 2) the coupled mode equation transfer matrix (CME-TM) model of a uniform grating with a π-phase shift in the center. A general equation describing the spectral shape of a Type II π-phase shifted FBG was demonstrated (Eq. (10)) for the particular case of a symmetrical/uniform device. An analytical expression for the passband loss was derived (Eq. (12)) and passband bandwidth was analyzed in the case of high reflectivity gratings having low passband loss (<1.2 dB) (Eqs. (19) and (25)). A causal/material empirical relation between the passband bandwidth and the exposure parameter (kL) was also derived (Eq. (26)). While the CME-TM simulation of the passband loss overlaps with the experimental results, the F-P model underestimates the passband loss, especially for high reflectivity gratings. Both models showed a broadening of ~150% of the passband bandwidth (from 8 to 20 pm) compared to the measured ~300% broadening of the passband. It is not clear whether this discrepancy between the simulation and the measurement is the result of a simplified physical model or systematic experimental errors. A statistical experiment indicated that the natural spread of the measured bandwidth does not overlap with the result of the simulations. It is however
clear that optical loss in the structure of a π-phase shifted grating imposes severe limitation on its spectral characteristics.
References
1. R. Bogue, “Fibre optic sensors: a review of today’s applications,” Sens. Rev. 31(4), 304–309 (2011). 2. A. Ghoshal, D. Le, and H. S. Kim, “Technological assessment of high temperature sensing systems under
extreme environment,” Sens. Rev. 32(1), 66–71 (2012).
3. D. Kinet, P. Mégret, K. W. Goossen, L. Qiu, D. Heider, and C. Caucheteur, “Fiber Bragg grating sensors toward structural health monitoring in composite materials: challenges and solutions,” Sensors (Basel) 14(4), 7394– 7419 (2014).
4. C. Smelser, S. Mihailov, and D. Grobnic, “Formation of Type I-IR and Type II-IR gratings with an ultrafast IR laser and a phase mask,” Opt. Express 13(14), 5377–5386 (2005).
5. S. J. Mihailov, D. Grobnic, C. Hnatovsky, R. B. Walker, P. Lu, D. Coulas, and H. Ding, “Extreme environment sensing using femtosecond laser-inscribed fiber Bragg gratings,” Sensors (Basel) 17(12), 2909–2942 (2017). 6. D. Grobnic, C. W. Smelser, S. J. Mihailov, and R. B. Walker, “Long-term thermal stability tests at 1000 °C of
silica fibre Bragg gratings made with ultrafast laser radiation,” Meas. Sci. Technol. 17(5), 1009–2013 (2006). 7. D. Grobnic, C. Hnatovsky, and S. J. Mihailov, “Thermally stable type II FBGs written through polyimide
coatings of silica-based optical fiber,” IEEE Photonics Technol. Lett. 29(21), 1780–1783 (2017).
8. D. Grobnic, S. J. Mihailov, and R. B. Walker, “Narrowband High Temperature Sensor Based on Type II laser Cavity Made with Ultrafast Radiation,” in Advanced Photonics Conference (Optical Society of America 2015), paper BW2D.5.
9. M. LeBlanc, S. T. Vohra, T. E. Tsai, and E. J. Friebele, “Transverse load sensing by use of pi-phase-shifted fiber Bragg gratings,” Opt. Lett. 24(16), 1091–1093 (1999).
10. A. Rosenthal, D. Razansky, and V. Ntziachristos, “High-sensitivity compact ultrasonic detector based on a pi-phase-shifted fiber Bragg grating,” Opt. Lett. 36(10), 1833–1835 (2011).
11. D. Grobnic, C. Hnatovsky, and S. J. Mihailov, “Low loss Type II regenerative Bragg gratings made with ultrafast radiation,” Opt. Express 24(25), 28704–28712 (2016).
12. D. C. Hutchings, F. A. P. Tooley, and D. A. Russell, “Unidirectional operation of a ring laser using an absorbing Fabry-Perot filter,” Opt. Lett. 12(5), 322–324 (1987).
13. C. Hnatovsky, D. Grobnic, and S. J. Mihailov, “High-temperature stable π-phase-shifted fiber Bragg gratings inscribed using infrared femtosecond pulses and a phase mask,” Opt. Express 26(18), 23550–23564 (2018). 14. C. Hnatovsky, D. Grobnic, and S. J. Mihailov, “Birefringent π-phase-shifted fiber Bragg gratings for sensing at
1000°C fabricated using an infrared femtosecond laser and a phase mask,” the J. Lightwave Technol. 36(23), 5697–5703 (2018).
15. C. Chen, Y.-S. Yu, R. Yang, L. Wang, J.-C. Guo, Q.-D. Chen, and H.-B. Sun, “Monitoring thermal effect in femtosecond laser interaction with glass by Fiber Bragg Grating,” J. Lightwave Technol. 29(14), 2126–2130 (2011).
16. C. Martinez and P. Ferdinand, “Analysis of phase-shifted fiber Bragg gratings written with phase plates,” Appl. Opt. 38(15), 3223–3228 (1999).
17. M. Yamada and K. Sakuda, “Analysis of almost-periodic distributed feedback slab waveguides via a fundamental matrix approach,” Appl. Opt. 26(16), 3474–3478 (1987).
18. T. Erdogan, “Fiber Grating Spectra,” J. Lightwave Technol. 15(8), 1277–1294 (1997).
19. M. Suter and P. Dietiker, “Calculation of the finesse of an ideal Fabry-Perot resonator,” Appl. Opt. 53(30), 7004–7010 (2014).
20. Y. O. Barmenkov, D. Zalvidea, S. Torres-Peiró, J. L. Cruz, and M. V. Andrés, “Effective length of short Fabry-Perot cavity formed by uniform fiber Bragg gratings,” Opt. Express 14(14), 6394–6399 (2006).
21. C. Hnatovsky, D. Grobnic, D. Coulas, M. Barnes, and S. J. Mihailov, “Self-organized nanostructure formation during femtosecond-laser inscription of fiber Bragg gratings,” Opt. Lett. 42(3), 399–402 (2017).