HAL Id: hal-00295323
https://hal.archives-ouvertes.fr/hal-00295323
Submitted on 4 Sep 2003
HAL is a multi-disciplinary open access
archive for the deposit and dissemination of
sci-entific research documents, whether they are
pub-lished or not. The documents may come from
teaching and research institutions in France or
abroad, or from public or private research centers.
L’archive ouverte pluridisciplinaire HAL, est
destinée au dépôt et à la diffusion de documents
scientifiques de niveau recherche, publiés ou non,
émanant des établissements d’enseignement et de
recherche français ou étrangers, des laboratoires
publics ou privés.
Sensitivity studies of the recent new data on O(1D)
quantum yields in O3 Hartley band photolysis in the
stratosphere
N. Taniguchi, S. Hayashida, K. Takahashi, Y. Matsumi
To cite this version:
N. Taniguchi, S. Hayashida, K. Takahashi, Y. Matsumi. Sensitivity studies of the recent new data
on O(1D) quantum yields in O3 Hartley band photolysis in the stratosphere. Atmospheric Chemistry
and Physics, European Geosciences Union, 2003, 3 (5), pp.1293-1300. �hal-00295323�
Atmos. Chem. Phys., 3, 1293–1300, 2003
www.atmos-chem-phys.org/acp/3/1293/
Atmospheric
Chemistry
and Physics
Sensitivity studies of the recent new data on O(
1
D
) quantum yields
in O
3
Hartley band photolysis in the stratosphere
N. Taniguchi1, S. Hayashida1, K. Takahashi2, and Y. Matsumi2
1Faculty of Science, Nara Women’s University, Kitauoya - Nishimachi, Nara, 630 - 8506, Japan
2Solar - Terrestrial Environment Laboratory, Nagoya University, Honohara 3 - 13, Toyokawa, 442 - 8507, Japan Received: 3 February 2003 – Published in Atmos. Chem. Phys. Discuss.: 12 May 2003
Revised: 8 August 2003 – Accepted: 20 August 2003 – Published: 3 September 2003
Abstract. The production yields of excited oxygen O(1D) atoms from the near ultraviolet O3 photolysis are essential quantities for atmospheric chemistry calculations because of its importance as major sources of hydroxyl (OH) radicals and nitric oxide (NO). Recently, new O(1D) quantum yields from O3 photolysis between 230 and 305 nm in the Hart-ley band region were reported, which are almost indepen-dent of the photolysis wavelength (0.88–0.93) and smaller than NASA/JPL-2000 recommendations (0.95 between 240 and 300 nm). In order to assess consequences of the new data of O(1D) quantum yields on the stratospheric chemistry, the changes in stratospheric chemical partitioning and O3 concentration are examined using a one-dimensional atmo-spheric model. Our steady state model simulations for 40◦N in March indicate that the smaller O(1D) quantum yields re-sult in increases of stratospheric O3(up to ∼2% in the upper stratosphere), which are attributed to the changes in HOx, NOx, and ClOxabundance and their catalyzed O3loss rates.
1 Introduction
Photodissociation by solar ultraviolet (UV) radiation drives much of the chemistry in the stratosphere, since it contributes to the removal of many atmospheric trace gases by decom-position and generates highly reactive radicals. One of the important photochemical reactions is the photolysis of O3in the UV region to produce O(1D) atoms, which react with water vapor and generate OH radicals (Brasseur et al., 1999; Finlayson-Pitts and Pitts, 1999):
O3+hν →O(1D) +O2(11g), (1)
→O(3P ) +O2(X3
X−
g), (2)
Correspondence to: N. Taniguchi ([email protected])
O(1D) +H2O → 2OH, (3)
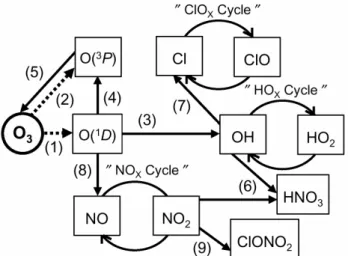
where h is Planck’s constant and ν is photon frequency. The chemical reactions of O(1D) play important roles in deter-mining the chemical composition of the stratosphere. Fig-ure 1 illustrates the principal chemical reactions involving O(1D) in the stratosphere. Most of the O(1D) atoms pro-duced by the photolysis of O3are quickly deactivated by col-lisions with major atmospheric species (M = N2and O2) and then form O3molecules again:
O(1D) +M → O(3P ) +M, (4)
O(3P ) +O2+M → O3+M. (5) The production rate of stratospheric OH depends on the O(1D) production from O3 photolysis. The OH radicals formed by reaction (3) initiate the HOx catalytic cycle of O3 loss, which is the main process for controlling O3 loss in both the lower and upper stratosphere (Fig. 7). OH is di-rectly involved in a HOxcatalytic cycle and also controls the partitioning between active species such as nitrogen oxides and chlorine oxides and their reservoirs:
OH + NO2+M → HNO3+M, (6)
OH + HCl → Cl + H2O. (7)
The O(1D) also produces the NO radical in the stratosphere due to the reaction with N2O:
O(1D) +N2O → 2NO. (8)
NO is the major catalyst for O3 loss of NOx in the mid-dle stratosphere. NOxalso suppresses the halogen catalytic destruction of O3by sequestering them in unreactive forms such as ClONO2:
1294 N. Taniguchi et al.: Sensitivity studies of the recent new data on O(1D) quantum yields
Figure 1.Schematic of the reaction pathways involving O(1D) formation in the O
3 photolysis
in the stratosphere. Dash line means a photolysis reaction. Numbers given in parentheses correspond to reaction numbers shown in the text.
Fig. 1. Schematic of the reaction pathways involving O(1D) for-mation in the O3photolysis in the stratosphere. Dash line means
a photolysis reaction. Numbers given in parentheses correspond to reaction numbers shown in the text.
The net effect on stratospheric O3 depends on the relative contributions of these mechanisms at each altitude.
The channel branching ratios between channels (1) and (2) from O3 photolysis have been examined extensively in the wavelength range λ>306 nm at 298 K and low tempera-ture by various laboratories over the past two decades (Mat-sumi et al., 2002, and references therein), which are used in the model calculation for such a comparison of observed and modeled OH, HOx, and O3concentrations and photoly-sis rate of O3(e.g. Wennberg et al., 1999; Pfister et al., 2000). Although the O3chemistry of stratosphere, especially upper stratosphere, is quite simple and relatively well-understood (Brasseur et al., 1999; Finlayson-Pitts and Pitts, 1999), in the upper stratosphere and mesosphere a number of mod-els cause an under-prediction of O3 concentrations at 40– 50 km altitude compared to observations, with magnitude of the discrepancy increasing with altitude (Eluszkiewicz and Allen, 1993). This has been known as the “ozone deficit” problem. In the upper stratosphere, the chemical composi-tion is determined by chemical processes that are faster than the relevant dynamical processes. Crutzen et al. (1995) and Grooß et al. (1999) have investigated the O3 budget in the upper stratosphere in comparison with observations and pho-tochemical modeling, and kinetic reaction rate coefficients and photochemical data used in their studies were JPL-1994 and JPL-1997 recommendations for atmospheric modeling by NASA panel, respectively (DeMore et al., 1994; DeMore et al., 1997). They have pointed out that the uncertainty in the model parameters is a large source of the discrep-ancy although improvement of the observation quality and updated the latest model parameters decreases a significant ozone deficit. Smith et al. (2001) estimated uncertainties in model O3from the box model sensitivities using
mecha-nism parameter uncertainties in JPL-2000 evaluation. They reported O3uncertainties still remain to be near 12% in the middle and upper stratosphere and the uncertainties increase in the lower stratosphere. The JPL-2000 recommendations significantly reduced several key reaction uncertainty values, that is, O3catalytic photochemistry uncertainties, compared with uncertainties before JPL-2000. From the same sensi-tivity analysis by using JPL-1994, Dubey et al. (2000) esti-mated O3uncertainties were nearly 3–5% larger than 12% of Smith et al. (2000). Knowledge of the photochemical pro-cesses that determine stratospheric O3 concentration is still of considerable interest. The O(1D) quantum yields in the photolysis of O3at wavelengths shorter than 300 nm have not received much attention and JPL-2000 panel recommended the constant value of 0.95 for the wavelength range of 240– 300 nm (Sander et al., 2000). The experimental data for the O(1D) quantum yields from O3photolysis over the Hartley band (200–300 nm) are sparse, which may result in some no-table uncertainties in the model calculation. Very recently, Taniguchi et al. (2000) and Takahashi et al. (2002) have pub-lished results of the precise O(1D) quantum yield measure-ments in the photolysis of O3between 230 and 305 nm. In this study, the atmospheric impacts of their laboratory results of O(1D) quantum yields from O3photolysis on the strato-spheric chemistry have been explored, in the framework of a one-dimensional chemical model.
2 O(1D) quantum yield data in the photolysis of O3 The absolute quantum yields of O(1D) formation from O3 photolysis between 306 and 328 nm have been evaluated by Matsumi et al. (2002) with the detailed examination of recent experimental measurements as a joint activity of SPARC and IGAC. Very recently, Takahashi et al. (2002) have measured the O(1D) quantum yields from O3photolysis between 230 and 308 nm using a new experimental technique. Using the same technique, Taniguchi et al. (2000) have indicated that the O(1D) quantum yield in the wavelength range of 297– 306 nm is almost independent of the wavelength (∼0.89). In Fig. 2, the yield values presented by Taniguchi et al. (2000) and Takahashi et al. (2002) are compared with both values previously reported by other different groups (Trolier and Wiesenfeld, 1988; Cooper et al., 1993; Talukdar et al., 1997, 1998) and JPL-2000 recommendations (Sander et al., 2000). Talukdar et al. (1998) reported that the O(1D) quantum yield between 289 and 305 nm was 0.89±0.02, which is in good agreement with results presented by Taniguchi et al. (2000) and Takahashi et al. (2002). The yield values reported by Trolier and Wiesenfeld (1988) and JPL-2000 recommenda-tions in this wavelength region are larger than values reported by Talukdar et al. (1998) , Taniguchi et al. (2000), and Taka-hashi et al. (2002). At shorter wavelengths, JPL-2000 panel has recommended a constant value of 0.95 for the O(1D) quantum yield in the Hartley band photolysis of O3between
N. Taniguchi et al.: Sensitivity studies of the recent new data on O(1D) quantum yields 1295
Figure 2. The quantum yields for O(1D) formation in the Hartley band photolysis of O
3 obtained by Taniguchi et al. (2000) and Takahashi et al. (2002). For comparison, the yield values reported by other groups are also shown (Trolier and Wiesenfeld, 1988; Cooper et al., 1993; Talukdar et al., 1997, 1998). Solid line indicates the yield values recommended by JPL-2000 evaluations for atmospheric modeling by NASA panel (Sander et al., 2000), which are constant (0.95) between 240 and 300 nm.
220 240 260 280 300 0.5 0.6 0.7 0.8 0.9 1 1.1 Wavelength (nm) Cooper et al. [1993]
Trolier and Wiesenfeld [1988]
Talukdar et al. [1997] Talukdar et al. [1998] JPL–2000, Sander et al. [2000] Taniguchi et al. [2000] Takahashi et al. [2002] O( 1 ) Qu antum Yi eld , 1 D Φ D
Fig. 2. The quantum yields for O(1D) formation in the Hartley band photolysis of O3obtained by Taniguchi et al. (2000) and Takahashi et al. (2002). For comparison, the yield values reported by other groups are also shown (Trolier and Wiesenfeld, 1988; Cooper et al., 1993; Talukdar et al., 1997, 1998). Solid line indicates the yield val-ues recommended by JPL-2000 evaluations for atmospheric model-ing by NASA panel (Sander et al., 2000), which are constant (0.95) between 240 and 300 nm.
240 and 300 nm. The O(1D) quantum yields presented by Takahashi et al. (2002) are almost independent of the photol-ysis wavelengths (∼0.91) between 230 and 300 nm, which are 4∼5% smaller than the JPL-2000 recommendation val-ues and in good agreement with valval-ues determined by Cooper et al. (1993), except for 228.5 and 231 nm. Talukdar et al. (1997) reported the room temperature O(1D) quantum yield of 0.91±0.06 at 248 nm, which is in good agreement with the value of 0.914±0.019 presented by Takahashi et al. (2002). Talukdar et al. (1998) showed that the O(1D) quantum yields between 289 and 305 nm were independent of the temper-ature (203–320 K). Talukdar et al. (1997) and Takahashi et al. (1998) reported a negligible temperature dependence of O(1D) quantum yields at 248 nm and 305 nm, respec-tively. We have focused on the difference in the wavelength range of 230–305 nm between the new quantum yield values (Taniguchi et al., 2000; Takahashi et al., 2002) and JPL-2000 recommendations, and examined the consequences of the difference in the chemical compositions in the mid-latitude stratosphere using a one-dimensional chemical model. The effect of the difference of the O(1D) quantum yield values in the wavelength region of 230–305 nm should be significant in the stratosphere and very little in the troposphere, since the solar radiation at the wavelengths shorter than 305 nm mainly affects the stratospheric chemistry.
Figure 3. Ultraviolet absorption spectrum of O3 in the Hartley band at 263 K (Malicet et al.,
1995) and actinic fluxes as a function of altitudes of 15, 25, and 40 km when the solar zenith angle is 40 degree (Finlayson-Pitts et al., 1999).
240 260 280 300 0 5 10 1013 1014 Wavelength (nm) Abso
rption Cross Section, (10
–18 cm 2 ) Sola r Flu x, ( Ph otons cm –2 s –1 ) σ F O3 Abs. 15 km 25 km 40 km
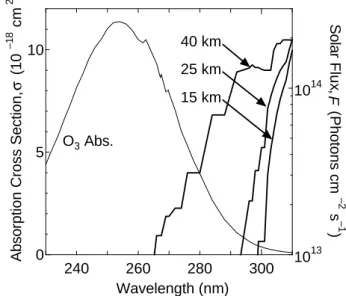
Fig. 3. Ultraviolet absorption spectrum of O3in the Hartley band at 263 K (Malicet et al., 1995) and actinic fluxes as a function of altitudes of 15, 25, and 40 km when the solar zenith angle is 40 degree (Finlayson-Pitts et al., 1999).
3 O(1D) production rates in the stratosphere
The total production rates of O(1D) atom from O3photolysis at several altitudes, Pt ot al(O1D), were calculated by
Pt ot al(O1D) = Z P (λ)dλ = Z F (λ)σ (λ, T )81D(λ, T )dλ, (10) where λ is the wavelength, and T is the temperature and F the actinic flux at the altitude. σ defines the absorption cross section of the O3 molecule and 81D the O(1D) quantum yield from O3photolysis which is the probability for a pro-cess (1) to occur upon absorption of a photon. We calculated the Pt ot al(O1D) values for the altitudes of 15, 25, and 40 km. The numerical data of F at solar zenith angle of 40 degree were taken from Finlayson-Pitts and Pitts (1999) and σ at 228 and 263 K were taken from Malicet et al. (1995) (Fig. 3). The photoabsorption cross section measurements reported by Malicet et al. (1995) are in good agreement with the recom-mended values by NASA/JPL 1997 and 2000 (DeMore et al., 1997; Sander et al., 2000). It should be noted that the rel-ative O(1D) production rate function, P(λ), predominantly depends on the wavelength region ∼230–320 nm, which is limited by the sunlight spectrum penetrating into the strato-sphere and by the absorption properties of O3 molecules. Therefore, the O(1D) quantum yield from O3photolysis in this wavelength region and its temperature dependence is a key input parameter for modeling calculations in the strato-spheric chemistry since the predominat source of the O(1D) atoms in the stratosphere is the photolysis of O3. Due to the
1296 N. Taniguchi et al.: Sensitivity studies of the recent new data on O(1D) quantum yields
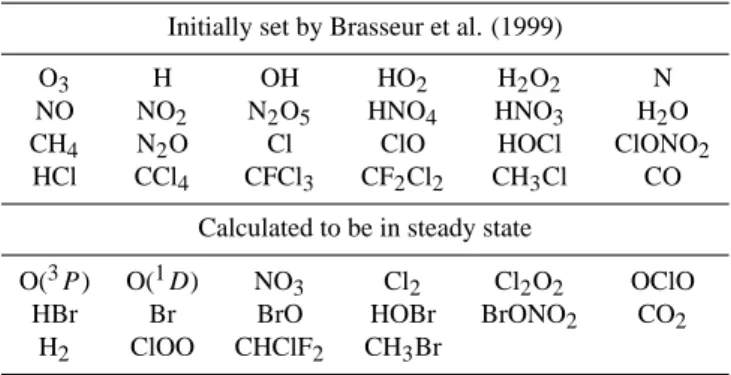
Table 1. List of chemical species used in the one-dimensional
chemical model calculations.
Initially set by Brasseur et al. (1999)
O3 H OH HO2 H2O2 N
NO NO2 N2O5 HNO4 HNO3 H2O
CH4 N2O Cl ClO HOCl ClONO2
HCl CCl4 CFCl3 CF2Cl2 CH3Cl CO
Calculated to be in steady state
O(3P) O(1D) NO3 Cl2 Cl2O2 OClO
HBr Br BrO HOBr BrONO2 CO2
H2 ClOO CHClF2 CH3Br
temperature dependence of σ and 81D, the ambient temper-ature influences the O(1D) production rate functions at each altitude. At λ>310 nm, the O(1D) formation via photodis-sociation of the vibrationally and rotationally excited O3and spin-forbidden process takes place (Matsumi et al., 2002). Since the population of the internally excited O3 molecules is dependent on the temperature, the O(1D) quantum yields at λ>310 nm (up to ∼325 nm) change as a function of the temperature (Talukdar et al., 1998; Takahashi et al., 1998; Smith et al., 2000). In the calculations for the wavelengths longer than 308 nm, the expression for the O(1D) quantum yields recommended by JPL-2000 (Sander et al., 2000) was used, which is a function of photolysis wavelength and tem-perature.
We found that the total O(1D) production rates
Pt ot al(O1D)estimated with the new O(1D) quantum yields
are smaller than those with the JPL-2000 recommendations by 2.5, 3.8 and 5.1%, at 15, 25 and 40 km, respectively. Atmospheric O3is photolyzed mainly by the UV radiation wavelength ∼295–315 nm at 25 km and ∼250–310 nm at 40 km, respectively. Therefore, the decreases in O(1D) pro-duction rates caused by the new O(1D) quantum yields in the wavelength range of 230–305 nm change the Pt ot al(O1D) more effectively at 40 km than that at 25 km. Comparisons of results obtained using the smaller values of O(1D) quan-tum yields with those using the recommendations of JPL-2000 clearly suggest the significance of new O(1D) yield data. Therefore, we examined the effects of the new O(1D) yields on the stratospheric chemistry by model calculations, as described in the following section.
4 One-dimensional atmospheric model calculations
We have examined the effect of the smaller values of O(1D) quantum yields (Taniguchi et al., 2000; Takahashi et al., 2002) using a one-dimensional chemical model, in which all the chemical reactions related to O3chemistry are reasonably represented and it is suitable for assessing the impact of the new O(1D) quantum yield data on stratospheric chemistry.
All chemical schemes in this one-dimensional model used here are the same as those used in the Garcia-Solomon two-dimensional (GS-2D) model (e.g., Solomon et al., 1996), which includes 90 kinetic reactions, 30 photolysis reactions, and 40 chemical species. Table 1 summarizes all 40 species included in this model. This one-dimensional model calcu-lated diurnal averaged values of photolysis rates and there-fore diurnal averaged mixing ratios of chemical species (by using the family method) for a specific altitude and season in mid-latitude in the northern hemisphere, by using the same formulations as those of G-S 2-D model. However, there is large difference in parameterizations of the effect of dy-namics between the one-dimensional model which includes the effect of vertical diffusion and the G-S 2-D model which considers the effect of meridional transport. For the verti-cal eddy diffusion coefficients in the one-dimensional model, values have been chosen to match the estimates of Chang (1974). The incident solar actinic fluxes specified at the top of atmosphere are taken from World Meteorological Orga-nization workshop report (1985) and their atmospheric at-tenuation is calculated in the model. The reaction rate co-efficients and the absorption cross sections are taken from NASA/JPL-1997 and -2000 recommendations (DeMore et al., 1997; Sander et al., 2000). The initial mixing ratios of 24 chemical species including O3 are taken from refer-ence values in March at 30◦N from Brasseur et al. (1999) (Table 1). The model results of vertical distributions of the chemical species and photolysis rates calculated in the one-dimensional model used in our study are approximately in good agreement with model results of vertical distributions presented in JPL-1997 and Brasseur et al. (1999) in the same conditions of latitude, altitude, and season in the northern hemisphere. This means that all the chemical reactions re-lated to ozone chemistry are reasonably represented in our one-dimensional model and thus the model is suitable for assessing the impact of new O(1D) quantum yield data on stratospheric chemistry. Since model responses of chemical species due to the change in O(1D) quantum yields repre-sent the time-dependent propagation of infinitesimal pertur-bations, individual responses grow and converge on the time scale associated with that process. Therefore, calculations for all chemical species with the new values or JPL-2000 rec-ommendations for the O(1D) quantum yields were run long enough to ensure convergence (±0.2% in concentration of all chemical species). The vertical profiles of O3, HNO3, and chemical families, HOx, ClOx, and NOx, for 40◦N in March predicted by the model are illustrated in Fig. 4, when the new quantum yield values are used. Here, the families are defined as HOx=H + OH + HO2, ClOx=Cl + ClO, and NOx=NO + NO2. The solar spectral intensity is calculated for equinox in March (the solar declination angle is zero de-gree).
We have estimated how model concentration results for O3and other chemical species are affected when a new set of model parameters, that is, the new O(1D) quantum yields are
N. Taniguchi et al.: Sensitivity studies of the recent new data on O(1D) quantum yields 1297
Figure 4. Results of the one-dimensional chemical model calculations. Diurnally averaged
vertical profiles of NOx, HOx, ClOx, HNO3 and O3 (dot-dash, dot, solid, thick dash, and thick
solid lines, respectively)predicted for 40° N in March using the O(1D) quantum yield values
measured by Taniguchi et al. (2000) and Takahashi et al. (2002).
10
610
810
1010
1220
30
40
50
O
3HO
XNO
XClO
XHNO
3Concentration (molecules cm
–3)
Altitu
de
(km)
Fig. 4. Results of the one-dimensional chemical model calculations.
Diurnally averaged vertical profiles of NOx, HOx, ClOx, HNO3
and O3(dot-dash, dot, solid, thick dash, and thick solid lines,
re-spectively) predicted for 40◦N in March using the O(1D) quantum yield values measured by Taniguchi et al. (2000) and Takahashi et al. (2002).
adopted. The change in O3concentration, δO3, is the relative change in a predicted model concentration:
δO3≡
[O3]N ew− [O3]J P L
[O3]J P L
(11) where [O3]N ew is concentration of O3 calculated with the new values of O(1D) quantum yields from O3photolysis be-tween 230 and 308 nm (Taniguchi et al., 2000; Takahashi et al., 2002), while [O3]J P Lis that using JPL-2000 recommen-dations as a standard model (Sander et al., 2000). Figure 5 shows the results of the diurnally averaged chemical model calculations, which indicates the change of the O(1D) and O3concentrations, δO(1D) and δO3, versus altitude for 20, 40, and 60◦N in March between the model runs with the new O(1D) values and the JPL-2000 recommendations. The partitioning changes in the chemical families, NOx, HOx, and ClOx, predicted as a result of the parameter changes of O(1D) quantum yields from JPL-2000 recommendations to the new values are shown in Fig. 6.
Here, the mixing ratios of chemical species are initialized by using reference values reported by Brasseur et al. (1999) as the typical values for 30◦N in March, in which mixing ra-tios of Clyare corresponded to be 0.7, 2.5, 3.2, and 3.3 ppb at 20, 30, 40, and 50 km respectively, and are in good agree-ment with those of WMO report (1999). Moreover, we per-formed sensitivity study to evaluate the impact of initial mix-ing ratio of Clyon our model results. In Fig. 5, we showed
Figure 5. Results of the one-dimensional chemical model calculations. The percentage
changes in diurnally averaged O(1D) and O3 concentrations predicted for latitude of 20, 40,
and 60° N (dot, solid, and dot-dash lines, respectively) in March as a function of altitude
using the O(1D) quantum yield values measured by Taniguchi et al. (2000) and Takahashi et
al. (2002), relative to those predicted using JPL-2000 recommendations for atmospheric
modeling by NASA evaluation panel (Sander et al., 2000), that is, δO(1D) and δO
3 defined by
eq. (11) in the text.
–6
–4
–2
0
2
20
30
40
50
Altitu
de
(km)
Change in Concentration (%)
O(
1)
O
3D
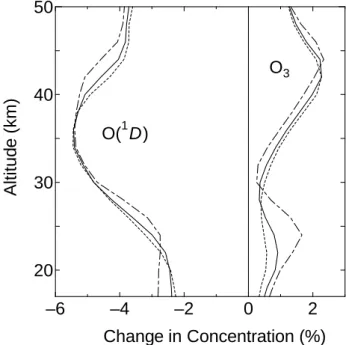
Fig. 5. Results of the one-dimensional chemical model calculations.
The percentage changes in diurnally averaged O(1D) and O3
con-centrations predicted for latitude of 20, 40, and 60◦N (dot, solid, and dot-dash lines, respectively) in March as a function of altitude using the O(1D) quantum yield values measured by Taniguchi et al. (2000) and Takahashi et al. (2002), relative to those predicted using JPL-2000 recommendations for atmospheric modeling by NASA evaluation panel (Sander et al., 2000), that is, δO(1D) and δO3
de-fined by Eq. (11) in the text.
the relative changes in the chemical concentrations calcu-lated on the bases of the “new experimental data” and the JPL-2000 recommendations of O(1D) quantum yields by us-ing Clyinitial mixing ratios from Brasseur et al. (1999). In a similar method, we calculated the relative changes in the chemical concentrations calculated on the bases of the “new experimental data” and the JPL-2000 recommendations by using the initial mixing ratios ten times as large as those of Brasseur et al. (1999). We found that there is no serious difference (±0.1%) between the relative changes calculated with Clyinitial mixing rations of Brasseur et al. (1999) and the relative changes with the initial mixing ratios ten times larger than Brasseur et al. (1999). These relative changes in the chemical concentrations of all 40 species included in our model (Table 1) are respectively calculated on the bases of the “new experimental data” and the JPL-2000 recommen-dations. In this way, we also found that that such changes in the initial mixing ratios of Clyas demonstrated in this sensi-tivity study are not likely to affect substantial influence on the evaluations of relative changes in chemical concentrations of O3, NOx, HOxand ClOxas shown in Fig. 6.
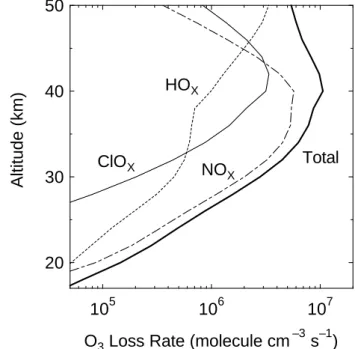
Changes in the reactive families influence O3 loss rates via the catalytic cycles involving those families. Figure 7
1298 N. Taniguchi et al.: Sensitivity studies of the recent new data on O(1D) quantum yields
Figure 6. Results of the one-dimensional chemical model calculations. The percentage
changes in durnally averaged NOx, HOx, ClOx, and O3 concentrations (dot-dash, dot, solid,
and thick lines, respectively)predicted for latitude of 40° N in March as a function of altitude
using the O(1D) quantum yield values measured by Taniguchi et al. (2000) and Takahashi et
al. (2002), relative to those predicted using JPL-2000 recommendations for atmospheric modeling by NASA evaluation panel (Sander et al., 2000).
–4
–2
0
2
20
30
40
50
Altitu
de
(km)
Change in Concentration (%)
O
3NO
XHO
XClO
XFig. 6. Results of the one-dimensional chemical model
calcula-tions. The percentage changes in durnally averaged NOx, HOx,
ClOx, and O3concentrations (dot-dash, dot, solid, and thick lines,
respectively) predicted for latitude of 40◦N in March as a func-tion of altitude using the O(1D) quantum yield values measured by Taniguchi et al. (2000) and Takahashi et al. (2002), relative to those predicted using JPL-2000 recommendations for atmospheric modeling by NASA evaluation panel (Sander et al., 2000).
shows the O3loss rates by the three principal reactive fam-ilies, NOx, HOx, and ClOx, versus altitude for latitude of 40◦N in March, which were calculated based on the new O(1D) quantum yield values.
5 Discussions
The steady-state O(1D) concentration for 40◦N becomes smaller by ∼2–6% with a negative peak at 35 km due to the smaller O(1D) quantum yields from O3 photolysis be-tween 230 and 308 nm (Fig. 2), depending on altitude in the stratosphere as shown in Fig. 5. This result is consis-tent with our evaluation of the altitudinal changes in the total O(1D) production rate Pt ot al(O1D). This indicates the con-sistency between the simple calculation with Eq. (10) and the one-dimensional chemical calculation, and that the concen-tration of O(1D) is influenced only by the production process of O(1D). The loss process of O(1D) is determined by the quenching process (4) which is not affected by the changes of the concentrations of minor species in the atmosphere. The O3 concentration calculated with the new O(1D) quantum yields is higher than that with the JPL-2000 recommenda-tions throughout the stratosphere. It should be noted that the change in the O(1D) concentration influences O3abundance
Figure 7. Results of the one-dimensional chemical model calculations. Diurnally averaged
O3 loss ratesdue to NOx, HOx, and ClOx chemistry (dot-dash, dot, and solid lines,
respectively) predicted for latitude of 40° N in March using the O(1D) quantum yield values
measured by Taniguchi et al. (2000) and Takahashi et al. (2002). Thick line shows the total
O3 loss rate which is the sum of the O3 loss rates in NOx, HOx, and ClOx catalytic cycles.
10
510
610
720
30
40
50
HO
XNO
XClO
XO
3Loss Rate (molecule cm
–3s
–1)
Altitud
e (km)
Total
Fig. 7. Results of the one-dimensional chemical model
calcula-tions. Diurnally averaged O3loss rates due to NOx, HOx, and ClOx
chemistry (dot-dash, dot, and solid lines, respectively) predicted for latitude of 40◦N in March using the O(1D) quantum yield values measured by Taniguchi et al. (2000) and Takahashi et al. (2002). Thick line shows the total O3loss rate which is the sum of the O3
loss rates in NOx, HOx, and ClOxcatalytic cycles.
even though atmospheric concentration of O(1D) atoms is much lower than O3 concentration, since the O(1D) reac-tions (3) and (8) are the direct source for stratospheric HOx and NOx molecules which control the stratospheric radical partitioning and O3 abundance through catalytic reactions (Fig. 1). The calculated response of O3concentration from these changes in the concentration of HOxand NOxis differ-ent between the upper, middle, and lower stratospheres be-cause of the interdependence of the O3loss catalytic cycles.
As shown in Figs. 5 and 6, the absolute change in the stratospheric O3 concentration is the largest at ∼40–45 km (increase up to ∼2%). This results from effect of the sup-pression of O3 loss by the decrease of the NOx, HOx, and ClOxconcentrations in their catalytic O3loss cycles (Fig. 6). Figure 7 shows that total O3 loss rate, that is, the sum of the O3 loss rates in NOx, HOx, and ClOx catalytic cycles has a peak around 40 km. Changes in O3loss rates in NOx, HOx, and ClOxcatalytic cycles, which were calculated from model runs with the new O(1D) quantum yields and with the JPL-2000 recommendations, were similar to changes in NOx, HOx, and ClOx concentrations which are shown in Fig. 6. Above this region, the contribution of the HOxcycle becomes predominant drastically as the altitude increases. The HOxconcentration in the upper stratosphere is decreased by the decrease of the OH formation trough reaction (3) due
N. Taniguchi et al.: Sensitivity studies of the recent new data on O(1D) quantum yields 1299
to the smaller O(1D) quantum yield (Fig. 6). In the upper stratosphere, atomic O(3P) constitutes efficiently the follow-ing catalytic cycle in which the rate-limitfollow-ing step in the cycle is reaction (12):
OH + O3→HO2+O2, (12)
HO2+O → OH + O2.
(Net : O + O3→2O2) (13)
Therefore, the decrease in HOxconcentration in the upper stratosphere caused by the smaller O(1D) quantum yields re-sults in the O3concentration increase most effectively in this region. On the other hand, HOxconcentration increases in the middle and lower stratosphere (Fig. 6). The NOx con-centration is reduced by the decrease of the O(1D) forma-tion via reacforma-tion (8). This reducforma-tion of the NOx concentra-tion takes place throughout the stratosphere. The increase of HOxconcentration in the middle and lower stratosphere may be attributed to the decrease of the rate of reaction (6) due to the smaller concentration of NOx. Since the contri-bution of three-body reaction (6) becomes more significant at lower stratospheric altitudes, HOxincreases in the lower stratosphere as shown in Fig. 6.
ClOx concentration also decreases in the upper-middle stratosphere with the smaller O(1D) quantum yields, and a little increases in the lower stratosphere. The behavior of ClOxconcentration change is similar to that of HOx concen-tration. The chlorine reservoir compound HCl is activated to ClOx by reaction (7), that is, the reaction between OH and HCl (Fig. 1). The decreased OH production rate due to the smaller O(1D) quantum yield results in the smaller ClOx concentration. In the lower stratosphere, the decrease of the third body reaction (9) with smaller NOxconcentration may lead to the increase of ClOx. ClOx cycle is important es-pecially around 45 km and accounts for about ∼35% of the total O3loss rate in this region (Fig. 7).
As shown in Fig. 6, NOx concentration is decreased throughout the stratosphere by the smaller O(1D) quantum yields, while the enhancement of O3takes place around 20– 25 km (up to ∼1%), but slightly less around 30 km. In the middle stratosphere, the NOx catalytic cycle has the largest effect on the O3reduction (Fig. 7). The enhancements of O3 concentration around 20–25 km with the new O(1D) quan-tum yields should be attributed to the decrease of NOx cat-alytic O3loss.
6 Additional note
After submitting this paper, a new edition of the NASA/JPL evaluations has been released (Sander et al., Chemical Kinet-ics and Photochemical Data for Use in Atmospheric Studies, Evaluation Number 14, JPL Publication 02-25, 2003). The
O(1D) quantum yield values in the NASA/JPL-2003 recom-mendation have been updated from those in the NASA/JPL-2000 recommendation. The O(1D) quantum yields from O3 photolysis for λ<306 nm are recommended to be 0.95 in JPL-2000 but to be 0.90 in the latest JPL-2003. The new laboratory O(1D) data used in this work are in closely agreement with the NASA/JPL-2003 recommendations. Ac-tually, we performed one-dementional model calculations to compare changes in the O3 concentration between the NASA/JPL-2003 recommendations and the new laboratory O(1D) data, and the result showed very small differences in the O3concentration throughout the stratosphere (<0.14%).
7 Conclusions
Consequences of the new data of O(1D) quantum yields from O3photolysis between 230 and 305 nm in the Hartley band region on the stratospheric chemistry are examined using a one-dimensional atmospheric model. Our sensitivity stud-ies for mid-latitude in March indicate that the smaller O(1D) quantum yields increase the O3 concentration throughout stratosphere via a decrease in the importance of NOx concen-tration in the middle stratosphere and the HOxin the upper stratosphere. The enhancement of O3 concentration in our chemical model calculations around 40–50 km altitude by us-ing new O(1D) quantum yields contributes to precise assess-ment of the photochemical O3 budget including the “ozone deficit” problem.
Acknowledgements. N. T. thanks the Japan Society for
Promo-tion of Science for a fellowship for young scientists. The one-dimensional model used in this study was originally offered by Dr. Susan Solomon, NOAA Aeronomy Laboratory. N. T. gives special thank to Prof. Masahiro Kawasaki, Kyoto University, for his help-ful discussions and encouragements. N. T. would like to thank Dr. Akiko Kagawa for her valuable comments on the manuscript. This work was partly supported by a Grant-in-Aid from the Ministry of Education, Culture, Sports, Science and Technology, Japan.
References
Brassuer, G. P., Orlando, J. J., and Tyndall, G. S.: Atmospheric Chemistry and Global Change, Oxford University Press, 1999. Chang, J. S.: Simulations, perturbations, and interpretations, paper
presented at 3rd Climatic Impact Assessment Program Confer-ence, Dep. of Transp., Cambridge, Mass., 1974.
Cooper, I. A., Neill, P. J., and Wiesenfeld, J. R.: Relative quantum yield of O(1D2) following ozone photolysis between 221 and
243.5 nm, J. Geophys. Res., 98, 12 795–12 800, 1993.
Crutzen, P. J., Grooß, J.-U., Br¨uhl, C., M¨uller, R., and Russell III, J. M.: A Reevaluation of the Ozone Budget with HALOE UARS Data: No Evidence for the Ozone Deficit, Science, 268, 705– 708, 1995.
DeMore, W. B., Sander, S. P., Golden, D. M., Hampson, R. F., Kurylo, M. J., Howard, C. J., Ravishankara, A. R., Kolb, C. E., and Molina, M. J.: Chemical Kinetics and Photochemical Data
1300 N. Taniguchi et al.: Sensitivity studies of the recent new data on O(1D) quantum yields
for Use in Stratospheric Modeling, JPL Publication 94–26, JPL, Pasadena, CA, 1994.
DeMore, W. B., Sander, S. P., Golden, D. M., Hampson, R. F., Kurylo, M. J., Howard, C. J., Ravishankara, A. R., Kolb, C. E., and Molina, M. J.: Chemical Kinetics and Photochemical Data for Use in Stratospheric Modeling, JPL Publication 97-4, JPL, Pasadena, CA, 1997.
Dubey, M. K., Smith, G. P., Kinnison, D. E., Connell, P. S.: Rate Parameter Sensitivities and Uncertainties of a 2-D Stratospheric Ozone Model; LLNL Report; Lawrence Livermore National Laboratory: Livermore, CA, 2000.
Eluszkiewicz, J. and Allen, M.: A global analysis of the ozone deficit in the upper stratosphere and lower mesosphere, J. Geo-phys. Res., 98, 1069–1082, 1993.
Finlayson-Pitts, B. J. and Pitts Jr., J. N.: Chemistry of the Upper and Lower Atmosphere: Theory, Experiments, and Applications, Academic Press, San Diego, 1999.
Grooß, J.-U., M¨uller, R., Becker, G., Mckenna, D. S., and Crutzen, P. J.: The upper stratospheric ozone budget: An update of calcu-lations based on HALOE data, J. Atmos. Chem., 34, 171–183, 1999.
Malicet, J., Daumont, D., Charbonnier, J., Parisse, C., Chakir, A., and Brion, J.: Ozone UV spectroscopy. II. Absorption cross-sections and temperature dependence, J. Atmos. Chem., 21, 263– 273, 1995.
Matsumi, Y., Comes, F. J., Hancock, G., Hofzumahaus, A., Hynes, A. J., Kawasaki, M., and Ravishankara, A. R.: Quantum yields for production of O(1D) in the ultraviolet photolysis of ozone: Recommendation based on evaluation of laboratory data, J. Geo-phys. Res., 107(D3), 4024, doi:10.1029/2001JD000510, 2002. Pfister, G., Baumgartner, D., Maderbacher, R., and Putz, E.:
Air-craft measurements of photolysis rate coefficients for ozone and nitrogen dioxide under cloudy conditions, Atmos. Environ., 34, 4019–4029, 2000.
Sander, S. P., Friedl, R. R., DeMore, W. B., Golden, D. M., Kurylo, M. J., Hampson, R. F., Huie, R. E., Moortgat, G. K., Ravis-hankara, A. R., Kolb, C. E., and Molina, M. J.: Chemical Ki-netics and Photochemical Data for use in Stratospheric Model-ing, JPL Publication 00-3, Evaluation Number 13, Jet Propulsion Laboratory, Pasadena, CA, 2000.
Sander, S. P., Friedl, R. R., Golden, D. M., Kurylo, M. J., Huie, R. E., Orkin, V. L., Moortgat, G. K., Ravishankara, A. R., Kolb, C. E., and Molina, M. J.: Chemical Kinetics and Photochem-ical Data for use in Atmospheric Studies, JPL Publication 02-25, Evaluation Number 14, Jet Propulsion Laboratory, Pasadena, CA, 2003.
Smith, G. D., Molina, L. T., and Molina, M. J.: Temperature Depen-dence of O(1D) Quantum Yields from the Photolysis of Ozone between 295 and 338 nm, J. Phys. Chem., A 104, 8916–8921, 2000.
Smith, G. P., Dubey, M. K., Kinnison, D. E., and Connell, P. S.: Assessing Effects of Rate Parameter Changes on Ozone Models Using Sensitivity Analysis, J. Phys. Chem., A 105, 1449–1455, 2001.
Solomon, S., Portmann, R. W., Garcia, R. R., Thomason, L. W., Poole, L. R., and McCormick, M. P.: The role of aerosol varia-tions in anthropogenic ozone depletion at northern midlatitudes, J. Geophys. Res., 101, 6713–6727, 1996.
Takahashi, K., Taniguchi, N., Matsumi, Y., Kawasaki, M., and Ash-fold, M. N. R.: Wavelength and temperature dependence of the absolute O(1D) production yield from the 305–329 nm photodis-sociation of ozone, J. Chem. Phys., 108, 7161–7172, 1998. Takahashi, K., Hayashi, S., Matsumi, Y., Taniguchi, N., and
Hayashida, S.: Quantum yields of O(1D) formation in the pho-tolysis of ozone between 230 and 308 nm, J. Geophys. Res., 107(D20), 4440, doi:10.1029/2001JD002048, 2002.
Talukdar, R. K., Gilles, M. K., Battin-Leclerc, F., Ravishankara, A. R., Fracheboud, J.-M., Orlando, J. J., and Tyndall, G. S.: Pho-tolysis of ozone at 308 and 248 nm: Quantum yield of O(1D) as a function of temperature, Geophys. Res. Lett., 24, 1091–1094, 1997.
Talukdar, R. K., Langfellow, C. A., Gilles, M. K., and Ravis-hankara, A. R.: Quantum yields of O(1D) in the photolysis of ozone between 289 and 329 nm as a function of temperature, Geophys. Res. Lett., 25, 143–146, 1998.
Taniguchi, N., Takahashi, K., and Matsumi, Y.: Photodissociation of O3around 309 nm, J. Phys. Chem., A 104, 8936–8944, 2000.
Trolier, M. and Wiesenfeld, J. R.: Relative quantum yield of O(1D2) following ozone photolysis between 275 and 325 nm, J.
Geophys. Res., 93, 7119–7124, 1988.
Wennberg, P. O., Salawitch, R. J., Donaldson, D. J., Hanisco, T. F., Lanzendorf, E. J., Perkins, K. K., Lloyd, S. A., Vaida, V., Gao, R. S., Hintsa, E. J., Cohen, R. C., Swaetz, W. H., Kusterer, T. L., and Anderson, D. E.: Twilight observations suggest unknown sources of HOx, Geophys. Res. Lett., 26, 1373–1376, 1999.
World Meteorological Organization: Global ozone research and monitoring project: Atmospheric ozone, Vol. 1, Rep. 16, Geneva, 1985.
World Meteorological Organization: Scientific Assessment of Ozone Depletion: 1998, Geneva, 1999.