HAL Id: hal-01144029
https://hal-brgm.archives-ouvertes.fr/hal-01144029
Submitted on 20 Apr 2015
HAL is a multi-disciplinary open access archive for the deposit and dissemination of sci-entific research documents, whether they are pub-lished or not. The documents may come from teaching and research institutions in France or abroad, or from public or private research centers.
L’archive ouverte pluridisciplinaire HAL, est destinée au dépôt et à la diffusion de documents scientifiques de niveau recherche, publiés ou non, émanant des établissements d’enseignement et de recherche français ou étrangers, des laboratoires publics ou privés.
measurements and CO2 analyses : a column study
Cécile Noel, Jean-Christophe Gourry, Jacques Deparis, Fabienne
Battaglia-Brunet, Michaela Blessing, Christophe Guimbaud, Ioannis
Ignatiadis
To cite this version:
Cécile Noel, Jean-Christophe Gourry, Jacques Deparis, Fabienne Battaglia-Brunet, Michaela Blessing, et al.. Biodegradation monitoring of toluene by geo-electrical measurements and CO2 analyses : a column study. 6th European Bioremediation Conference, Jun 2015, Chania, Greece. 2015. �hal-01144029�
BIODEGRADATION
MONITORING
OF
TOLUENE
BY
GEO-ELECTRICAL
MEASUREMENTS AND CO
2ANALYSES: A COLUMN STUDY
Cécile Noel1,2, Jean-Christophe Gourry1, Jacques Deparis1, Fabienne Battaglia-Brunet1, Michaëla Blessing1, Christophe Guimbaud2, Ioannis Ignatiadis1
1
BRGM, 3, av. Claude Guillemin, 45060, Orléans, France
2LPC2E, CNRS, 3, av. de la recherche scientifique, 45071, Orléans, France
Corresponding author email: cecile.noel@cnrs-orleans.fr
ABSTRACT
Hydrocarbon contaminated aquifers can be successfully treated through biodegradation. However, in
situ sampling for monitoring the treatment is expensive, invasive and can be insufficient to obtain a
robust monitoring as the information provided is restricted to vertical profiles at discrete locations. An alternative method was tested in order to improve the efficiency of the monitoring. An electrical geophysical method, Spectral Induced Polarization (SIP), was combined with CO2 analyses, concentration
and carbon isotopic ratio, to monitor toluene aerobic biodegradation in columns. Microbial activity was characterized by CO2 production, carbon isotopic fractionation and also by an evolution of the SIP
response in correlation with biofilm growth and the associated bacterial activity (CO2 production as a
consequence of toluene biodegradation). Combination of geophysical measurements with CO2 analyses
are proving to be highly promising for real field scale biodegradation monitoring.
KEYWORDS:
biodegradation; hydrocarbons; monitoring; induced polarization; carbon isotopicfractionation
1. INTRODUCTION
Hydrocarbon contaminated aquifers can be successfully treated through biodegradation. However, this process still remains partially unexploited, mainly because in situ monitoring before and during soil treatment operations is often expensive and technically challenging. Indeed, where significant subsurface heterogeneity exists, conventional intrusive groundwater sampling campaigns can be insufficient to obtain relevant information as they are restricted to costly monitoring wells at discrete locations. New monitoring tools are needed to overcome these limitations and make the in situ bioremediation more reliable, robust, as well as economically competitive.
Geo-electrical techniques, especially induced polarization (IP), can be used to study the effects of biodegradation (Atekwana and Atekwana, 2010). Indeed, biodegradation processes modify ground electrical properties because they alter biogeochemical conditions: bacteria modify local redox conditions; microbial activity can produce organic acids that affect the pore water conductivity; during microbial growth and formation of biofilms, biomass can clog pores and potentially change the porosity and hydraulic conductivity. Thus, IP is expected to be an effective non-intrusive tool to monitor bioremediation.
Geo-electrical methods are often used in conjunction with geochemical measurements (temperature, pH, redox potential, water conductivity and dissolved oxygen content) to detect changes in the chemical properties of the soil and groundwater caused by microbial metabolism. In the aim to propose a complete non-destructive monitoring methodology, we follow microbial metabolism by studying gas emissions at the ground surface. Indeed, biodegradation of organic compounds induces CO2 production
and isotopic fractionation of carbon. CO2 produced by biodegradation is thus distinguished from that
produced by other processes (Aggarwal and Hinchee, 1991).
From these findings, we propose to combine geo-electrical methods and gas analyses to develop a new non-invasive technique for monitoring in situ biodegradation of hydrocarbons. Laboratory experiments are a necessary step to evaluate the feasibility of this methodology. To this end, aerobic microbial
activity was monitored in toluene-contaminated sand columns using SIP measurements and CO2 gas
analyses (volumetric concentration and carbon isotopic ratio).
2. MATERIALS AND METHODS
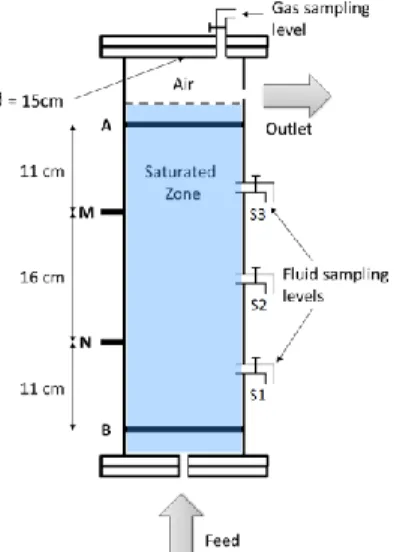
Toluene aerobic biodegradation is studied in columns at 25 °C. They are filled with sand from Fontainebleau and fed up with a fluid containing toluene (C7H8) and bacterial growth medium (Figure 1).
Two columns were used in this experiment. One non-inoculated was used for control measurements and one inoculated for biodegradation monitoring. Rhodococcus wratislaviensis IFP 2016, known to be a toluene degrading strain (Auffret et al., 2009), was injected in the inoculated column. The inoculum was introduced in the feeding solution and it was left recirculating in close loop during five days (inoculation step). Then, the circuit was opened (circuit opening) and the column was supplied with H2O2 in low
concentration to stimulate aerobic metabolic bioprocesses. Toluene was added regularly after its degradation in the inoculated column.
The columns were equipped for complete biodegradation monitoring (Figure 1). Spectral Induced Polarization (SIP) measurements are performed regularly: an electrical current with known amplitude and frequency is applied at two ring electrodes, positioned at both ends of the columns. This induces an electrical current in the porous media and the associated voltage is measured between two potential electrodes. The change of amplitude and phase of the received waveform allows measuring complex resistivity ρ*= |ρ*|eiϕ. The resistivity magnitude |ρ*| is a measure of the ability of the sample to conduct charges, and the phase shift ϕ is a measure of the magnitude of polarization (charge storage) that predominantly occurs at mineral–electrolyte or bacteria–electrolyte interfaces.
Gas was sampled with a syringe at the top of the column and CO2 concentration and its carbon isotopic
ratio (δ13C(‰) = *(13C/12C)ech/(13C/12C)VPDB -1]*1000, with (13C/12C)VPDB = 0.011237) are both measured
directly by infrared laser spectroscopy.
Planktonic bacterial population and toluene concentration could be followed by sampling water at three levels of the columns. Moreover, sessile bacterial population was monitored through sand sampling at the top of the inoculated column.
Figure 1. Column design. On the left, SIP measurements disposal: A and B are ring current electrodes; M and N are potential electrodes. On the right: gas sampling point at the top of the column, fluid sampling
points at 3 different heights. The column is fed up with bacterial growth medium and toluene.
3. RESULTS AND DISCUSSION
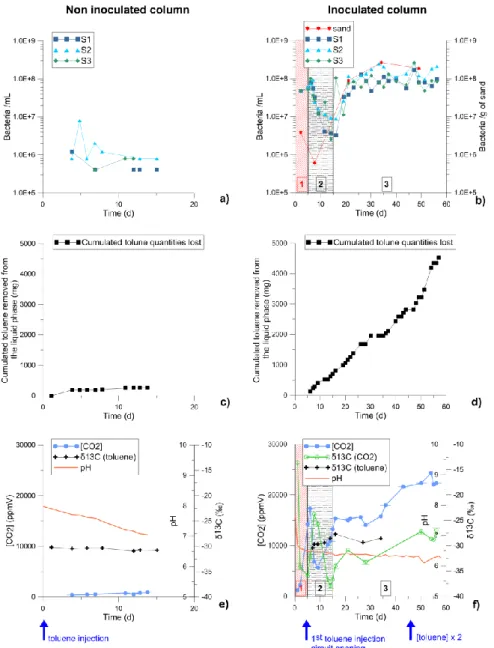
Microbiological and geochemical results are shown in figure 2. The bacterial concentration remained low in the non-inoculated column, whereas, in the inoculated column, the cell concentration in the fluid was high and an increase of the bacterial concentration fixed on the sand was observed during the experiment (Figures 2a and 2b). It can be noted a decrease of planktonic bacteria number in the column
levels at circuit opening (day 5), but the population started to grow at day 15. This allows to delimitate three stages for the inoculated experiment: 1) inoculation period, whith a high planktonic bacterial population (days 0 to 5), 2) the period just after circuit opening, when a lot of planktonic bacteria were
Figure 2. Microbial and geochemical results for the non-inoculated (left) and inoculated (right) columns of the measured (a), (b) bacterial concentrations; (c), (d) toluene quantities lost in liquid phase; (e), (f) CO2 concentration, δ13C(CO2) and pH. Stages 1, 2 and 3 correspond respectively to the inoculation period,
the period when bacteria were lost after opening circuit and the period of biofilm growth.
Figure 3. SIP results for the (a) non-inoculated and (b) inoculated columns presented in terms of resistivity magnitude and phase shift at 0.5 Hz. Stages 1, 2 and 3 are the same as in figure 2.
lost (days 5 to 15) and 3) the period of biofilm growth, with increase of bacterial population, planktonic and sessile (days 15 to 58). We will refer to these stages thereafter.
Small amounts of toluene were lost in the non-inoculated column. However, these losses were negligible in comparison with those occurred into the inoculated column (Figures 2c and 2d). CO2 analyses indicate
that toluene was biodegraded into the inoculated column only (Figures 2e and 2f). Indeed, in the non-inoculated column, CO2 concentrations stayed around 500ppmV, which is the ambient air CO2
concentration level. By contrast, in the inoculated column, a three-stage CO2 production was observed.
First, there was a strong increase of CO2 concentrations (stage 1). Then, after opening the circuit, CO2
concentrations declined when planktonic bacteria were lost (stage 2), and rose again progressively during the biofilm growth (stage 3). Moreover, δ13C(CO2) decreased from -9‰, which is the ambient air
CO2 signature, to reach -30.9‰, which is the toluene isotopic signature. That confirms that produced CO2
resulted from toluene degradation. Furthermore, an isotope fractionation of carbon could be detected during the biodegradation process because δ13C(CO2) became lower than δ13C(toluene source). For
example, at day 28, δ13C(CO2) =-33.3±0.4‰ (isotopic fractionation of 2.3‰ / δ13C(toluene source)).
The SIP measurements at 0.5Hz are displayed in figure 3. The temporal evolution of phase shift ϕ in the non-inoculated column showed no variation, staying around 0mrad during all the experiment. Conversely, in the inoculated column, ϕ varied: it rose from 0 to 15mrad during the inoculation step (stage 1). Consequently to the circuit opening and the loss of planktonic bacteria, ϕ decreased (stage 2), then increased again during the biofilm growth (stage 3). The resistivity response |ρ*| in the non-inoculated column was flat and, in the non-inoculated column, it showed an increase after circuit opening, from 10ohm.m to 15/22ohm.m (comparable to |ρ*| of the non-inoculated column) and then, a steady decrease to 10ohm.m, lower than initial values. We can assume that mainly growing presence of bacteria and biofilm formation, but also their activity (ions and organic acids production), induce the SIP parameters, principally ϕ.
4. CONCLUSIONS
The geochemical monitoring, especially relative to the CO2 production and its carbon isotopic signature,
showed that the bacterial activity was significant in the inoculated column. Microbiological analyses confirmed that a biofilm developed in the inoculated column but not in the non-inoculated control. The geo-electrical response appears to reflect sequential changes occurring in the system, as a result of bacterial population variations and toluene biodegradation. This laboratory study provided evidences that the aerobic biodegradation of toluene by bacterial biofilms can be monitored through a combination of SIP measurements and CO2 study. This non-invasive monitoring methodology is
innovative as it combines geophysical measurements and gas emission analyses at the ground surface, without recurring to monitoring wells. It is currently adapted at the real field scale.
ACKNOWLEDGEMENTS
We thank the French Research Agency (project BIOPHY, ANR-10-ECOT-014) and the LABEX VOLTAIRE (Excellence Laboratory for Atmosphere, Resources and Environmental interactions study, University of Orleans, France) (ANR-10-LABX-100-01) for financial support. We also thank all the cooperation partners of the BIOPHY project: BRGM, LPC2E, Serpol and Total.
REFERENCES
P. K. Aggarwal and R. E. Hinchee, 1991. "Monitoring in situ biodegradation of hydrocarbons by using stable carbon isotope." Environmental Science & Technology 25: 1178-1180.
E. A. Atekwana and E. A. Atekwana, 2010. "Geophysical signatures of microbial activity at hydrocarbon contaminated sites: a review." Surveys in Geophysics 31: 247-283.
M. Auffret, D. Labbé, G. Thouand, C. W. Greer and F. Fayolle-Guichard, 2009. “Degradation of a mixture of hydrocarbons, gasoline and diesel oil additives by Rhodococcus aetherivorans and Rhodococcus wratislaviensis”. Applied and Environmental Microbiology, 75: 24, 7774-7782.