HAL Id: inserm-01285787
https://www.hal.inserm.fr/inserm-01285787
Submitted on 9 Mar 2016
HAL is a multi-disciplinary open access
archive for the deposit and dissemination of sci-entific research documents, whether they are pub-lished or not. The documents may come from teaching and research institutions in France or abroad, or from public or private research centers.
L’archive ouverte pluridisciplinaire HAL, est destinée au dépôt et à la diffusion de documents scientifiques de niveau recherche, publiés ou non, émanant des établissements d’enseignement et de recherche français ou étrangers, des laboratoires publics ou privés.
Copyright
Ignacio Munguira, Ignacio Casuso, Hirohide Takahashi, Felix Rico, Mohamed
Chami, Simon Scheuring
To cite this version:
Ignacio Munguira, Ignacio Casuso, Hirohide Takahashi, Felix Rico, Mohamed Chami, et al.. Glass-LikeMembrane Protein Diffusion in a Crowded Membrane. ACS Nano, American Chemical Society, 2016, �10.1021/acsnano.5b07595.�. �inserm-01285787�
Glass-LikeMembrane Protein Diffusion in a Crowded Membrane
1 2
Ignacio L.B. Munguira1#, Ignacio Casuso1#, Hirohide Takahashi1, Felix Rico1, Atsushi
3
Miyagi1, Mohamed Chami2& Simon Scheuring1*
4 5
1 U1006 INSERM, Université Aix-Marseille, Parc Scientifique et Technologique de Luminy, 163 avenue de
6
Luminy, 13009 Marseille, France
7
2 Center for Cellular Imaging and NanoAnalytics, Biozentrum, University of Basel, Mattenstrasse 26,
CH-8
4058 Basel, Switzerland
9 10
#
These authors have equally contributed to the work
11 12
*Correspondence should be addressed to S. Scheuring
13 Email: [email protected] 14 Tel.: ++33-4-91828777, Fax: ++33-4-91828701 15 16
Many functions of the plasma membrane depend critically on its structure and
17
dynamics. Observation of anomalous diffusion in vivo and in vitro using fluorescence
18
microscopy and single particle tracking has advanced our concept of the membrane
19
froma homogeneous fluid bilayer with freely diffusing proteinsto a highly organized
20
crowded and clustered mosaicof lipidsand proteins. Unfortunately, anomalous
21
diffusion could not be related to local molecular details given the lack of direct and
22
unlabeled molecular observation capabilities. Here, we use high-speed atomic force
23
microscopy and a novel analysis methodology to analyze the pore forming protein
24
lysenin in a highly crowded environment and document coexistence of several
25
diffusion regimes within one membrane. We show the formation of local glassy
26
phases, where proteins are trapped in neighbor-formed cages for time scales up to
27
10 seconds, which had not been previously experimentally reported for biological
28
membranes. Furthermore, around solid-like patches and immobile molecules a
29
slower glass phase is detected leading to protein trapping and creating a perimeter
30
of decreased membrane diffusion.
31 32
Keywords: Anomalous Diffusion / Membrane Dynamics / Membrane Domains /
33
High-Speed Atomic Force Microscopy / Single Molecule / Glass-Glass Transition
34 35
Graphical Table of Contents
36
Biological membranes are formed by lipids and proteins (and associated sugars). The 1
composition, relative concentration and density of lipids and proteins define their 2
aggregation and diffusion,1 which in turn regulate membrane protein distribution and 3
function.2, 3 In the recent years, evidence has been accumulated that biological 4
membranes are complex and organized, featuring local aggregations of lipids and 5
proteins (rafts)1, 4 and protein species- and localization-dependent diffusion 6
properties,5, 6which regulate the interaction of the membrane components and 7
modulate the biomolecular processes taking place in the membrane. 8
Diffusion can be Brownian, i.e. the mean-square displacement (MSD) scales linearly 9
with the time of observation. However, the observed diffusion trajectories of lipids and 10
proteins in biological membranes often deviate from Brownian behavior. Indeed, it is 11
observed that MSD of a membrane componenthas nolinearrelationship with 12
observation time: these types of anomalous diffusions are termed superdiffusion and 13
subdiffusionwhen the object goes farther or stays closer to its initial position, 14
respectively, compared to a Brownian movement. Such intricate and diverse diffusion 15
properties at the cell membrane regulate biomolecular traffic and thus molecular 16
encounters and function. We are just at the beginning of understanding membrane 17
architecture and dynamics.7-9 18
Lysenin10, 11 is a 33kDa protein extracted from the coleomic fluid of the earthworm 19
Eiseniafetida. It belongs to the family of Pore-Forming Toxins (PFT), and its mechanism
20
of action is common to PFTand is described in six steps:12Secretion, binding to the 21
target membrane, two-dimensional diffusion,oligomerisation, assemblyin hexagonal 22
close pack,and pre-poreto pore transformation.13 Besides Lysenin’s affinity for 23
Sphingomyelin (SM), membrane-embedded cholesterol (Chol) has been shown to 24
facilitate the formation of Lysenin oligomers. Lysenin offers hence an excellent system 25
for studying fundamentals of membrane diffusion and aggregation allowing it to 26
interact with mixed SM/Chol bilayers at variable local density.14 27
The general approach to study membrane protein diffusion is fluorescence microscopy 28
combined with single molecule tracking. Fluorescence microscopy allows studying the 29
diffusion of fluorescence-tagged molecules with high temporal resolution and under 30
physiological conditions.6, 15, 16 Unfortunately, fluorescence microscopy comes with 31
some shortcomings: (i) Only tagged molecules can be studied and are visible as long as 32
they are not bleached, and (ii) the lateral and the spatial resolution arelimited to 33
optical diffraction ∼200nm (distance between two objects that can be resolved in real 34
space at the same time) andto fitting of the point-spread function∼20nm (typical 35
precision of localization). Furthermore, only one single molecule can be tracked – 36
keeping the environment non-fluorescent in the color of the observed tag is 37
prerequisite for the localization of the molecule of interest. 38
High-Speed Atomic Force Microscopy (HS-AFM)17 offers a novel view of membrane 39
protein architecture and dynamics.18It contours proteins with about ∼1nm lateral and 40
∼0.1nm vertical resolution in buffer at ambient temperature and pressure, and 41
atsubsecondrate. Hence, HS-AFM does not only visualize the movement of unlabeled 42
proteins, but it images all molecules within the membrane. Given this novel and 43
unique feat, HS-AFM allows correlating diffusion to the molecular environment. 44
1
RESULTS/ DISCUSSION
2 3
Here, we use HS-AFM to determine the effect of local molecular crowdingon the 4
diffusion behavior of lysenin on supported lipid bilayers (SLB) constituted of SM/Chol 5
1:1 (Figure 1a, Supplementary Movie 1). As previouslyreported,13 the molecules in 6
pre-pore and pore states can be distinguished based on their membrane protrusion 7
height. Both classes of molecules associate and diffuse next to each other as pre-pores 8
inserts into the first leaflet and pores into both leaflets of the membrane. The 9
resolution and signal-to-noise ratio in the HS-AFM movie allows almost each lysenin 10
ringto be clearly depicted over the entire movie (Figure 1a, left 4 panels). In a time 11
average over the entire movie (Figure 1a, right panel) areas of different morphology 12
and dynamics are readily distinguished: In certain areas proteins form stable lattices 13
and are well resolved after averaging. In contrast, in other areas, no structural features 14
are recognizable reporting high dynamics in these locations. In agreement, the 15
standard deviation (SD) map of the pixel height values over the entire movie duration 16
(Figure 1b, left panel) displayed low values (purple) in the hexagonally packed areas, 17
while the SD was high (yellow) in the diffusive areas. Interestingly, at the interface 18
between these domains, well-defined circular patterns were detected, corresponding 19
to lysenin localizations, where the SD-map displayed low to high SD values(Figure 1b, 20
arrowheads). This indicated that molecules at interfaces revealed association times of 21
varying duration from long (well-preserved topography and low SD) to short 22
(undefined topography and high SD). Some of the pores,about 0.5% of all molecules 23
got stuck by interactions with the mica supportand served us as proof that the vast 24
majority of the molecules had motional freedom (Figure 1b, dashed squares, Figure 1c, 25
Supplementary Movie 2). Furthermore, these molecules mimic anchored
protein-26
pickets,19 and confirm experimentally that immobile molecules can strongly influence 27
the diffusion of its annular environment (Figure 1c):The immobile molecule creates 28
new borders that resemble structurally and dynamically the borders of the crystalline 29
domains. 30
We analyzed the local dynamics of the proteins, using an approach inspired by 31
Fluorescence Correlation Spectroscopy (FCS).20 Since in an AFM measurement, the 32
pixel intensity is the molecular height, the pixel value is directly related to the presence 33
of a molecule under the tip. Hence, the time that a pixel keeps a certain value reports 34
directly about the residence time of a protein and a value change reports thediffusion 35
‘under’ that pixel. A section kymograph (Figure 1d, along the dashed line in Figure 1a) 36
illustrates the power of the approach: Pixels constituting the crystalline areas display 37
constant height values as a function of time (Figure 1d, top), while pixels that are part 38
of the diffusive areas presents rapid changes (Figure 1d, bottom). At the border pixels 39
are occupied with stable molecules for intermediate lag-times (seconds to minutes) in 40
alternation with rapid molecular redistribution (Figure 1d, middle). 41
In order to analyze the diffusion of molecules ‘under’ each pixel, we calculated 42
thedifference of each pixel value (zi) at time t with respect to a later moment t+𝜏
43
(𝛥𝑧𝑖(𝑡, 𝜏) = 𝑧𝑖(𝑡 + 𝜏) − 𝑧𝑖(𝑡)). As a result, histogramsof the height changes 𝛥𝑧𝑖(𝜏)of
each pixel (i) and varying lag-time (𝜏) were obtained. Such histograms, also termed 1
‘van Hove distributions’, are commonly used in colloidal sciences to extract diffusion 2
parameters.21 From each van Hove distribution on each pixel, the variance 𝑉(𝜏) is 3
extracted, analogous to the MSD in single molecule tracking,22 following 4 𝑉(𝜏) =1 𝑛 𝛥𝑧𝑖(𝜏) − 𝑚𝑖(𝜏) 2 𝑛 1 𝑒𝑞. 1
wheren is the number of frames of each pixel i, and mi the pixel mean value. Using this
5
approach, variance maps for varying 𝜏are generated (Figure 2a). As expected, the 6
variance increases with the 𝜏 in all the domains, though much less in the crystalline 7
areas. Whatever the intensity of dynamics, as long as the behavior is Brownian then 8
the van Hove distribution isGaussian. In contrast, non-Brownian dynamics, as found for 9
example in glasses, give rise to non-Gaussian van Hove distributions. This is because 10
particles in glasses are constraint and transiently caged by the dense packing and 11
interactions with neighboring particles, but undergo rare large displacements due to 12
cage rearrangements. To characterize such complex dynamics the Kurtosis Kof the 13
distribution on each pixel is calculated, following 14 𝐾(𝜏) = 1 𝑛 𝑧𝑖(𝑡 + 𝜏) − 𝑧𝑖(𝑡)) − 𝑚𝑖 4 𝑛 1 1 𝑛 𝑧𝑖(𝑡 + 𝜏) − 𝑧𝑖(𝑡)) − 𝑚𝑖 2 𝑛 1 2 𝑒𝑞. 2
When K=3, then the distribution in the van Hove plot is Gaussian and the underlying 15
motion is Brownian. Deviations from K=3 are associated with anomalous diffusion, and 16
typically K>3 are signature of the cooperative behavior in glasses.23 17
Plotting Kon each pixel as a function of varying 𝜏, areas of non-Brownian dynamics are 18
highlighted (Figure 2b).Within the fluid areas, we find subregions, upper left corner, 19
which display a Kurtosis ∼3 at all 𝜏,corresponding to free diffusion. However, most of 20
the fluid domains revealed Kurtosis significantly>3 at short lag-times, and ∼3 when 21
analyzed over longer𝜏>8s, corresponding to the average trapping time of particlesin 22
this glass phase.Beyond this 𝜏 the glass behaves like a Brownian fluid. The 23
interfacesbetween fluid and crystalline domains displayed high Kurtosis values>4even 24
overextended lag-times indicating that molecules are trapped for varying durations 25
and eventually up to minutes. The crystalline domains despite their low dynamics 26
displayed K∼3, and correspondtherefore statistically to an area of Brownian diffusion. 27
To better understand the relationship between the structure and dynamics of these 28
domains,24 we undertook two types of analysis:First, for a more detailed 29
comprehension of the crystalline domains we performed negative stain electron 30
microscopy (EM) (Supplementary Figure S1a) combined with single particle analysis 31
(Supplementary Figure S1b), and cryo-EM (Supplementary Figure S1c) combined with 32
electron crystallography (Supplementary Figure S1d) of lysenin as individual molecules 33
and in the crystalline arrangement, respectively. Both approaches depicted lyseninas a 34
nonamericpore with two concentric density rings.The 9-fold symmetric molecule 35
assembles with p3-symmetry in the ‘hexagonal packing’ with a=b=12nm and γ=120°, in 36
agreement with HS-AFM (Figure 1a).In such an arrangement onelysenin ring occupies a 37
membrane area 𝐴 = 2 ∙ 3 4 ∙ 𝑎 ∙ 𝑏 of 125nm2corresponding to an area fraction()
of 0.91. Second, for a more detailed comprehension of the fluid domains, we 1
performed Delaunay triangulationand Voronoi tessellation
2
(Supplementary Figure S2a).25In the case of a 2D-lattice, each molecule has 6 nearest 3
neighbors and the Voronoi cells are hexagons with 125nm2 area. In the fluid domain, 4
the average distance between molecules is 16.5±3.5nm, with about 5.5 nearest 5
neighbors, and pores occupy areas up to 250nm2, an approximate area fraction of 0.45 6
without short- or long-range order (Supplementary Figure S2b).Furthermore, the 7
shape factor ξ of the Voronoi cells have been analyzed: Each cell is characterized by a 8
shape factor 𝜉 = (𝐶2 4𝜋𝐴), where C is the perimeter and A the area of the Voronoi 9
cell. In the range ≈0.60-0.71 a bimodal distribution of the shape factor is observed, 10
meaning that molecules in the same density range have different number of 11
neighbors, characteristic of phase transitions (Supplementary Figure S3).26 12
Having in hand methodologies to characterize diffusion properties (Figure 2) and local 13
protein density (Supplementary Figure S2a) ‘under’ each pixel, we had competence to 14
determine how diffusion properties scale and change as function of local membrane 15
structure.Plotting the variance of all pixels in the movie as a function of the Voronoi 16
cell area that comprises each pixel and as a function of varying 𝜏, a segregation of the 17
data occurred (Figure 3a). A large number of data points gather at a Voronoi cell size of 18
∼125nm2
and small variance that remains unchanged with increasing lag-time; these 19
pixels are part of the crystalline area. In contrast, pixels in areas of low protein density 20
and Voronoi cell size >200nm2 show high variance that further increases with 𝜏. The 21
Kurtosis of the crystalline area, Voronoi cell sizes of ∼125nm2, is stable at a value of ∼3, 22
Brownian rattling(Figure 3b). However,pixels that locate in the fluid areas with low 23
protein density and Voronoi cell area >200nm2 depict wide spread Kurtosis values with 24
many significantly >3at short 𝜏. 25
In analogy to typical MSD vs lag-time plots from single particle tracking, we plotted 26
variance vs lag-time.Our approach has the advantage that proteins can be grouped 27
together as a function of the local density in which theyevolve.In general, the variance 28
increaseswithlower local protein density (larger Voronoi cell). The slope of the variance 29
as a function of 𝜏is somewhat steeper at 240nm2/molecule comparedto areas at 30
125nm2/molecule at short 𝜏, flattening at longer 𝜏. However, at intermediate protein 31
density of ∼185nm2/molecule the slope is increased, especially for longer𝜏, indicating 32
particular diffusion of molecules at this density (Figure 3c, left). When plotting the 33
variance vsVoronoi cell area for different 𝜏, we observe a biphasic, maybe triphasic, 34
behavior: Low variance for the crystalline areas with 125nm2 to 165nm2 per molecule, 35
high variance for fluid areas with 200nm2 to 250nm2 per molecule, and a steep 36
variance increase for intermediate molecular density regions with 165nm2 to 200nm2 37
per molecule. Around Voronoi areas of 185nm2 a weak variance plateauat short 𝜏, is 38
found (Figure 3c, right). 39
Plotting the Kurtosis as a function of lag-time for the different Voronoi cells 40
revealedthree different populations of Brownian and non-Brownian dynamics 41
(Figure 3d, left): Densely packed molecules have Kurtosis ∼3, almost independent of 𝜏. 42
When the localprotein density is lower than 165nm2 per molecule, thenthe Kurtosis 43
raises abruptly to a completely non-Brownian regime.A third population is found when 44
the protein density loosens further with Voronoi cells of 200nm2 and larger: In this 45
regime, the Kurtosis is significantly non-Brownian at 𝜏<10s, above this lag-time 1
diffusion is Brownian. 10s seems to be the average trapping time of lyseninin the 2
glassy-fluid phase. This striking triphasic behavior and its transitions are best visualized 3
when plotting the Kurtosis as a function of Voronoi cell area (Figure 3d, right): 4
Molecules evolving in a density regime of 165nm2 to 200nm2 membrane area (peaking 5
at 185nm2) display non-Brownian diffusion characteristics basically independent of the 6
time span. These characteristics around∼0.61 arein good agreement with theory and 7
simulation of2D-glasses.27, 28 8
HS-AFM features the advantage to visualize (i) non-labeled molecules and (ii) not only 9
single moleculesbut all molecules in the membrane. An approach inspired by FCS is 10
used to detect dynamics ‘under’ each pixel with nanometer resolution, of particular 11
importance in crowded systems.Qualitatively similar results were obtained 12
fromautomated single particle tracking(Supplementary Figure S4). However 13
considerable problems occur when tracking densely packed molecules, where the 14
motion of the molecules is comparable to the inter-particle distance. Furthermore, a 15
single local densitycannot be attributed to a molecule trajectory as the molecule may 16
diffuse through heterogeneous domains. In contrast, the pixel-by-pixel 17
analysisapproach used here(Figure 3) provides the possibility to correlate density and 18 diffusion. 19 20 CONCLUSIONS 21 22
In summary, the membrane contains four phases with different diffusion dynamics: At 23
ranging from 0.91to0.68 (solid phase), the proteins are essentially crystalline and 24
rattle around their position with Brownian dynamics.At borders of the solid phase, the 25
proteins evolve at between 0.68 and 0.56 (sliding glass) and are caged up to minutes. 26
Morphologically, this glassy area resembles a ‘sliding puzzle’ where moving complexes 27
occupy defined positions. At 0.56 to0.45(fluid glass) diffusion is fluid yet molecules 28
are caged at shorter time periods <10seconds. Calculating SD maps running over 10s of 29
movie acquisition revealed the presence of spatially correlated dynamics represented 30
by SDfluctuation waves (Supplementary Movie 4). This glassy phase is characterized 31
by lack of short-range order.At below 0.45 (liquid phase) proteins diffuse freely. Such 32
a coexistence of several glasseshas been described in colloidal systems.29, 30 33
In a crowded mosaic biological membrane, molecules diffusein an environment with 34
∼0.5containing stable domains.1, 4
Furthermore, molecular heterogeneity favors the 35
occurrence of glass dynamics.24Specialized membranes,e.g.photosynthetic 36
membranes31or retinal disk membranes32, 33may be even more crowdedand comply to 37
cooperative rearrangements during their functional tasks. 38
HS-AFM allowscorrelating structure with diffusion behavior, and glassy diffusion is only 39
detectable when both movement and environment are simultaneously assessed. 40
Therefore, biologists may have missed glass-like diffusion in crowded membranes34 41
due to the technical limitation of only tracking single molecules. Given the 42
crowdedness of cellular membranes, we hypothesize that glassy dynamics might be a 43
frequentfeature of membrane proteinregulation in vivo. 44
1 METHODS/EXPERIMENTAL 2 3 Protein purification 4
A cDNA fragment, coding for Lysenin (GenBank: BAA21518.1,GenScript, USA) and 5
cloned into pET28a vector at BamHI and Hind III, and this vector transformedinto 6
BL21(DE3) strain (New England BioLabs France, Evry, France). Thetransformed cells 7
were inoculated into 1 liter of LB medium containing 100 μg/ml kanamycin sulfate, and 8
incubated at 37 °C while shaking at 200 rpm until the OD600 value reached 0.6.For
9
induction of Lysenin expression, isopropyl β-D-1-thiogalactopyranoside (IPTG) was 10
added at final concentration of 0.5 mM, and cells shaken overnight at 20°C and 11
200 rpm. The bacteria were collected by centrifugation at 2000g for 10 minutes, and 12
disrupted with 3 probe sonicator intervals of 15 seconds sonication and 30 seconds ice 13
cooling each. The resulting suspension was shaken at 4°C for 30 minutes in Triton X-14
100 at 0.1 % and RNase/DNaseat 10 µg/ml concentrations. The mixture was 15
centrifuged at 104g for 30 minutes. The supernatant (volume: 9 ml) was collected and 16
mixed with 1 ml of metal chelating resin, chelating sepharose Fast flow (GE Healthcare 17
France), composed of chelating cobalt in 100 mMNaCl, Hepes-NaOH, pH 7.5.Lysenin 18
binding was performed by 1 hour incubation at 4°C with gentle shaking, and the 19
resulting resin centrifuged at 100g for 1 minute to discard the supernatant. The resin 20
was washed with fresh 14 ml of 100 mMNaCl, 100 mM imidazole-HCl, Hepes-NaOH, 21
pH 7.5 by 3 centrifuge/washing cycles. Lysenin was eluted in 1 ml of 100 mMNaCl, 22
250 mM imidazole-HCl, Hepes-NaOH, pH 7.5. To eliminate the imidazole, the eluate 23
was dialyzed against 1 liter of 100 mMNaCl, Hepes-NaOH, pH 7.5. The resulting protein 24
sample was directly used for the HS-AFM experiment. 25
26
Samplepreparation for High-speed atomic force microscopy (HS-AFM) observation
27
Egg Sphingomyelin(SM) andCholesterol (chol) (Avanti Polar Lipids, Alabama, USA)were 28
used to form giant unilamellar vesicles (GUVs) at a molar ratio SM:Chol 1:1 through 29
electroswelling.35 Of each lipid10 µl at 3 mMdissolved in chloroform: methanol 3:1 30
were deposited in two glass plates coated with indium tin oxide with 70-100 Ω 31
resistivity(Sigma-Aldrich) and placed 60 minutes in the desiccator for complete solvent 32
evaporation. A U-shaped rubber piece of ∼1 mm thickness was sandwiched between 33
the two indium tin oxide coated slides. The so-formed chamber was filled with 34
∼400 µlof 200 mM sucrose solution and exposed to 1.5 V sinusoidal10 Hz AC current 35
for 3 hours followed bysquared 5 Hz AC current for 15 minutes, at 55°C. GUVs were 36
harvested from the chamber. To form the supported lipid bilayers (SLBs) for HS-AFM, 37
1 µl of GUV solution was placed ona 1.5 mm-diameterfreshly cleaved mica disk 38
covered with 1 µl of phosphate buffer saline (PBS) and incubated for 30 minutes.To 39
remove lipid that was not firmly attached the SLB was intensely rinsed with PBS. Once 40
the bilayer was formed, 1 µl of purified lysenin was incubated for 15 minutes. Excess of 41
protein was again rinsed with PBS. 42
43
High-speed atomic force microscopy (HS-AFM)
HS-AFM movies were acquired with an Ando-type setup 17 equipped with a super 1
luminescent diode (emission wavelength: 750 nm; EXS 7505-B001, Exalos, Schlieren, 2
Switzerland) and a digital high-speed lock-in Amplifier (Hinstra, Transcommers, 3
Budapest, Hungary).368µm-long cantilevers with spring constantk = 0.15 Nm-1, 4
resonance frequencyf(r) = 500-700 kHz and quality factor Q ≈ 1.5 in liquid (USC-1.2,
5
NanoWorld, Neuchâtel, Switzerland), featuring an electron beam deposition (EBD) tip, 6
were used.For high-resolution imaging the tip was sharpened by helium plasma 7
etching using a plasma cleaner (Diener electronic, Ebhausen, Germany), resulting in a 8
final tip radius tip of about 2 nm, as judged from analysis of the indentation inside the 9
Lysenin rings. Amplitude modulation was used for imaging with free amplitude of 10
∼1.2 nm and operating set point amplitude of ∼0.9 nm. Under these conditions we 11
estimate the applied force following F = (𝑘𝑐/𝑄𝑐)*(𝐴0(1−As/A0)+h0sin(𝜃/2)where A0 is
12
the free amplitude, As is the setpoint amplitude, h0 is the step height of the sample,
13
and 𝜃 is the phase delay of the feedback. Under our imaging conditions F = 44pN.37 All 14
experiments were performed at room temperature and in physiological buffer. 15
16
High-speed atomic force microscopy (HS-AFM) image treatment
17
Image treatment was limited to the correction of a first-order XY plane fit and XY drift 18
correction of the HS-AFM movie.38 19
20
High-speed atomic force microscopy (HS-AFM) data analysis
21
The HS-AFM movie is considered a four dimensional matrix with lateral dimensions X 22
and Y, height dimension Z, and a time t. Time is subdivided in time-intervals 𝜏, the 23
shortest 𝜏is the time passing between the acquisitions of two subsequent frames. 24
From this matrix, the height changes ∆𝑧 as a function of varying lag-time 𝜏, was 25
calculated by subtraction, following 𝛥𝑧𝑖(𝑡, 𝜏) = 𝑧𝑖(𝑡 + 𝜏) − 𝑧𝑖(𝑡) on each pixel.
So-26
called van Hove plots, i.e., the histogram distribution of the height variations was 27
calculated for each pixel. Following, the shape of the van Hove plots for each 𝜏was 28
analysed according two parameters: Variance V and Kurtosis K. While the variance 29
informs about the width of the van Hove plots, hence about the intensity of motion, 30
the Kurtosis reports about the non-Gaussianity, hence about non-Brownian behaviour. 31
Each of these steps is performed for every lag-time 𝜏 and for every pixel. This data 32
treatment resulted in variance and Kurtosis maps as shown in figure 2. Variance and 33
Kurtosis were calculated using pre-built functions in Matlab(Matlab, Mathworks, 34
Natick, USA). 35
To determine the local density, Voronoi tessellation was calculated from the 36
localization of all particles. In order to determine the localization of all molecules in all 37
frames, cross-correlation searches between a 360-fold symmetrized Lysenin ring 38
(artificial reference) and each movie frame was performed. This resulted in cross-39
correlation maps of each frame that featured about 700 cross-correlation peaks each. 40
Peak searches allowed the localization of about 740000 molecules in the movie (about 41
700 in each frame). A lab-developed package18, 38integrated in ImageJ was used for the 42
cross-correlation analysis and trajectory extraction. Using the particle localizations, 43
Voronoi tessellation was calculated using a pre-built function in Matlab(Matlab, 44
Mathworks, Natick, USA). 45
Combining, the two above-described analysis allowed correlating variance and Kurtosis 1
with local protein density and evaluating how diffusion properties scale as a function 2
of membrane structure. 3
The area fraction was calculated taking in to account that the area occupied by a 4
Lysenin ring is 𝐴(𝑚𝑜𝑙 )= 𝜋 𝑑 4 = 113𝑛𝑚2(where d is the diameter of the lysenin ring,
5
i.e. center-to-center distance in the crystal packing), and the unit cell area of the
6
hexagonal close packing is 𝐴(𝑢𝑛𝑖𝑡 𝑐𝑒𝑙𝑙 ) = 2 3 4 𝑎𝑏 = 124.7𝑛𝑚2 ,resulting in
7
=0.906899. For our analysis is the ratio between A (mol) and the unit cell orVoronoi 8
cell in the real HS-AFM movie, in which it is located. 9
10
Samplepreparation for transmission electron microscopy (TEM)observation
11
Adsorption and oligomerization of Lysenin on asphingomyelin-containing lipid 12
monolayer were performed incustum-designed Teflon wells of 4mm in diameter and 13
1mm in depth. 0.5μl of lipid solution (Sphingomyelin/Phophatidylcholin 1:4, Avanti 14
Polar Lipids, Alabama, USA) at 0.1mg/ml in chloroform were spread on 15μl of Lysenin 15
at 50μg/ml and incubated for 1 hour at room temperature to reconstitute oligomers or 16
overnight to form 2D-crystal patches. The interfacial surface formed by the lipid 17
monolayer and the adsorbed protein was transferred to carbon-coated grids and 18
analyzed by transmission electron microscopy. 19
20
Negative stain transmission electron microscopy (TEM) and image processing of
21
single Lysenin oligomers
22
For imaging of negatively stained samples, the grid was washed with three droplets of 23
pure water and subsequently negatively stained with 2% (w/v) uranyl-acetate. The 24
prepared grids were imaged using a Philips CM10 TEM (FEI Company, Eindhoven, the 25
Netherlands) operated at 80kV. The images were recorded by the 2k x 2k side-26
mounted Veleta CCD camera (Olympus, Germany) at magnification of 130 000 x. Under 27
these conditions the pixel size at the sample level is 3.7 Å. 28
Image processing was achieved with EMAN2 software package.39 The images were CTF 29
(contrast transfer function) corrected and the particles were semi-automatically 30
selected. The ‘e2refine2d’ program was used to classify the particles,and produce 31
reference-free class averages. The most populated class represented the top view. 32
33
Cryo Transmission electron microscopy (cryo-TEM) and image processing of 2-crystal
34
patches of Lysenin
35
For cryo-TEM, the grid was blotted with Whatman filter paper and vitrified through 36
plunging it into liquid nitrogen cooled liquid ethane using a vitrobot (FEI company, 37
Netherlands). Frozen grids were transferred into a Philips CM200-FEG electron 38
microscope using a Gatan 626 cryo-holder. Electron micrographs were recorded at an 39
accelerating voltage of 200kV and a nominal magnification of 50 000 x, using a low-40
dose system (10 e-/Å2) and keeping the sample at liquid nitrogen temperatures. 41
Defocus values were around -2.5 µm. Micrographs were recorded on a 4K x 4K CMOS 1
camera (TVIPS, Germany). The pixel size at the sample level is 2.1 Å. The 2D-crystal 2
images were selected based on the presence of diffraction patterns with well-defined 3
spots and further treated using the 2dx software.40 4 5 ASSOCIATED CONTENTS 6 7 Supporting Information 8
The Supporting Information is available free of charge on theACS Publications 9 websiteat DOI: 10 11 ACKNOWLEDGEMENTS 12
The authors thank Drs. Timo Betz, Pierre Sens, Didier Marguet andSebastienMailfert 13
for important discussions about thedata analysis. This work was funded by the ANR 14
grant financing the A*MIDEX program (ANR-11-IDEX-0001-02) and a European 15
Research Council (ERC) Consolidator Grant (#310080). 16
REFERENCES
1
1. Engelman, D. M. Membranes Are More Mosaic Than Fluid. Nature2005, 438, 578-580.
2
2. Fujiwara, T. Phospholipids Undergo Hop Diffusion in Compartmentalized Cell Membrane. The J
3
Cell Biol2002, 157, 1071-1082. 4
3. Korlach, J.; Schwille, P.; Webb, W. W.; Feigenson, G. W. Characterization of Lipid Bilayer Phases
5
by Confocal Microscopy and Fluorescence Correlation Spectroscopy. PNAS1999, 96, 8461-8466.
6
4. Simons, K.; Gerl, M. J. Revitalizing Membrane Rafts: New Tools and Insights. Nat RevMol Cell
7
Biol2010, 11, 688-699. 8
5. Dietrich, C.; Yang, B.; Fujiwara, T.; Kusumi, A.; Jacobson, K. Relationship of Lipid Rafts to
9
Transient Confinement Zones Detected by Single Particle Tracking. BiophJ2002, 82, 274-284.
10
6. Marguet, D.; Lenne, P.-F.; Rigneault, H.; He, H.-T. Dynamics in the Plasma Membrane: How to
11
Combine Fluidity and Order. EMBO J2006, 25, 3446-3457.
12
7. Höfling, F.; Franosch, T. Anomalous Transport in the Crowded World of Biological Cells. Rep
13
Prog Phys2013, 76, 046602. 14
8. Krapf, D. Chapter Five - Mechanisms Underlying Anomalous Diffusion in the Plasma Membrane.
15
In Current Topics in Membranes, Anne, K. K., Ed. Academic Press: 2015; Vol. Volume 75, pp
167-16
207.
17
9. Metzler, R.; Jeon, J.-H.; Cherstvy, A. G.; Barkai, E. Anomalous Diffusion Models and Their
18
Properties: Non-Stationarity, Non-Ergodicity, and Ageing at the Centenary of Single Particle
19
Tracking. Phys Chem Chem Phys2014, 16, 24128-24164.
20
10. Sekizawa, Y.; Hagiwara, K.; Nakajima, T.; Kobayashi, H. A Novel Protein, Lysenin, That Causes
21
Contraction of the Isolated Rat Aorta : Its Puriification from the Coleomic Fluid of the
22
Earthworm, Eisenia Foetida. BiomedRes1996, 17, 197-203.
23
11. De Colibus, L.; Sonnen, Andreas F. P.; Morris, Keith J.; Siebert, C. A.; Abrusci, P.; Plitzko, J.;
24
Hodnik, V.; Leippe, M.; Volpi, E.; Anderluh, G.; Gilbert, Robert J. C. Structures of Lysenin Reveal
25
a Shared Evolutionary Origin for Pore-Forming Proteins and Its Mode of Sphingomyelin
26
Recognition. Structure2012, 20, 1498-1507.
27
12. Iacovache, I.; van der Goot, F. G.; Pernot, L. Pore Formation: An Ancient yet Complex Form of
28
Attack. Biochim Biophys Acta - Biomemb2008, 1778, 1611-1623.
29
13. Yilmaz, N.; Yamada, T.; Greimel, P.; Uchihashi, T.; Ando, T.; Kobayashi, T. Real-Time Visualization
30
of Assembling of a Sphingomyelin-Specific Toxin on Planar Lipid Membranes. Bioph J2013, 105,
31
1397-1405.
32
14. Yilmaz, N.; Kobayashi, T. Visualization of Lipid Membrane Reorganization Induced by a
Pore-33
Forming Toxin Using High-Speed Atomic Force Microscopy. ACS Nano2015, 9, 7960-7967.
34
15. Dahmane, S.; Rubinstein, E.; Milhiet, P.-E. Viruses and Tetraspanins: Lessons from Single
35
Molecule Approaches. Viruses2014, 6, 1992-2011.
36
16. Ritchie, K.; Shan, X.-Y.; Kondo, J.; Iwasawa, K.; Fujiwara, T.; Kusumi, A. Detection of
Non-37
Brownian Diffusion in the Cell Membrane in Single Molecule Tracking. Bioph J2005, 88,
2266-38
2277.
39
17. Ando, T.; Kodera, N.; Takai, E.; Maruyama, D.; Saito, K.; Toda, A. A High-Speed Atomic Force
40
Microscope for Studying Biological Macromolecules. PNAS2001, 98, 12468-12472.
41
18. Casuso, I.; Khao, J.; Chami, M.; Paul-Gilloteaux, P.; Husain, M.; Duneau, J.-P.; Stahlberg, H.;
42
Sturgis, J. N.; Scheuring, S. Characterization of the Motion of Membrane Proteins Using
High-43
Speed Atomic Force Microscopy. Nat Nanotechnol2012, 7, 525-529.
44
19. Fujiwara, T.; Ritchie, K.; Murakoshi, H.; Jacobson, K.; Kusumi, A. Phospholipids Undergo Hop
45
Diffusion in Compartmentalized Cell Membrane. JCell Biol2002, 157, 1071-1082.
46
20. García-Sáez, A. J.; Schwille, P. Fluorescence Correlation Spectroscopy for the Study of
47
Membrane Dynamics and Protein/Lipid Interactions. Methods2008, 46, 116-122.
48
21. Kegel, W. K.; Blaaderen; Alfons, v. Direct Observation of Dynamical Heterogeneities in Colloidal
49
Hard-Sphere Suspensions. Science2000, 287, 290-293.
50
22. Valentine, M. T.; Kaplan, P. D.; Thota, D.; Crocker, J. C.; Gisler, T.; Prud’homme, R. K.; Beck, M.;
51
Weitz, D. A. Investigating the Microenvironments of Inhomogeneous Soft Materials with
52
Multiple Particle Tracking. Phys Rev E2001, 64.
53
23. Marcus, A. H.; Schofield, J.; Rice, S. A. Experimental Observations of Non-Gaussian Behavior and
Stringlike Cooperative Dynamics in Concentrated Quasi-Two-Dimensional Colloidal Liquids.
1
Phys Rev E1999, 60, 5725. 2
24. Berthier, L.; Biroli, G. Theoretical Perspective on the Glass Transition and Amorphous Materials.
3
Rev Mod Phys2011, 83, 587-645. 4
25. Poupon, A. Voronoi and Voronoi-Related Tessellations in Studies of Protein Structure and
5
Interaction. Curr Opin Struct Biol2004, 14, 233-241.
6
26. Reis, P. M.; Ingale, R. A.; Shattuck, M. D. Crystallization of a Quasi-Two-Dimensional Granular
7
Fluid. Phys Rev Lett2006, 96, 258001.
8
27. Zhao, K.; Bruinsma, R.; Mason, T. G. Local Chiral Symmetry Breaking in Triatic Liquid Crystals.
9
Nat Commun2012, 3, 801. 10
28. Sciortino, F.; Tartaglia, P.; Zaccarelli, E. Evidence of a Higher-Order Singularity in Dense
Short-11
Ranged Attractive Colloids. Phys Rev Lett2003, 91, 268301.
12
29. Fehr, T.; H.Lowen. Glass Transition in Confined Geometry. Physical Review E: 1995.
13
30. Mayer, C.; Zaccarelli, E.; Stiakakis, E.; Likos, C. N.; Sciortino, F.; Munam, A.; Gauthier, M.;
14
Hadjichristidis, N.; Iatrou, H.; Tartaglia, P.; Löwen, H.; Vlassopoulos, D. Asymmetric Caging in
15
Soft Colloidal Mixtures. Nat Mat2008, 7, 780-784.
16
31. Scheuring, S.; Sturgis J. N. Chromatic Adaptation of Photosynthetic Membranes. Science2005,
17
309, 484-487.
18
32. Fotiadis, D.; Liang, Y.; Filipek, S.; Saperstein, D. A.; Engel, A.; Palczewski, K. Atomic-Force
19
Microscopy: Rhodopsin Dimers in Native Disc Membranes. Nature2003, 421, 127-128.
20
33. Buzhynskyy, N.; Salesse, C.; Scheuring, S. Rhodopsin Is Spatially Heterogeneously Distributed in
21
Rod Outer Segment Disk Membranes. JMol Rec2011, 24, 483-489.
22
34. Minton, A. P. Lateral Diffusion of Membrane Proteins in Protein-Rich Membranes. BiophJ1989,
23
55, 805-808.
24
35. Angelova, M. I.; Dimitrov, D. S. Liposome Electroformation. Faraday Discuss Chem Soc1986, 81,
25
303-311.
26
36. Colom, A.; Casuso, I.; Rico, F.; Scheuring, S. A Hybrid High-Speed Atomic Force–Optical
27
Microscope for Visualizing Single Membrane Proteins on Eukaryotic Cells. Nat Commun2013, 4.
28
37. Ando, T. High-Speed Atomic Force Microscopy Coming of Age. Nanotechnol2012, 23, 062001.
29
38. Husain, M.; Boudier, T.; Paul-Gilloteaux, P.; Casuso, I.; Scheuring, S. Software for Drift
30
Compensation, Particle Tracking and Particle Analysis of High-Speed Atomic Force Microscopy
31
Image Series: Software for High-Speed Atomic Force Microscopy Image Series. JMol Rec2012,
32
25, 292-298.
33
39. Ludtke, S. J.; Baldwin, P. R.; Chiu, W. Eman: Semiautomated Software for High-Resolution
34
Single-Particle Reconstructions. J Struct Biol1999, 128, 82-97.
35
40. Scherer, S.; Kowal, J.; Chami, M.; Dandey, V.; Arheit, M.; Ringler, P.; Stahlberg, H.
36
2dx_Automator: Implementation of a Semiautomatic High-Throughput High-Resolution
Cryo-37
Electron Crystallography Pipeline. J Struct Biol2014, 186, 302-307.
38 39 40
1
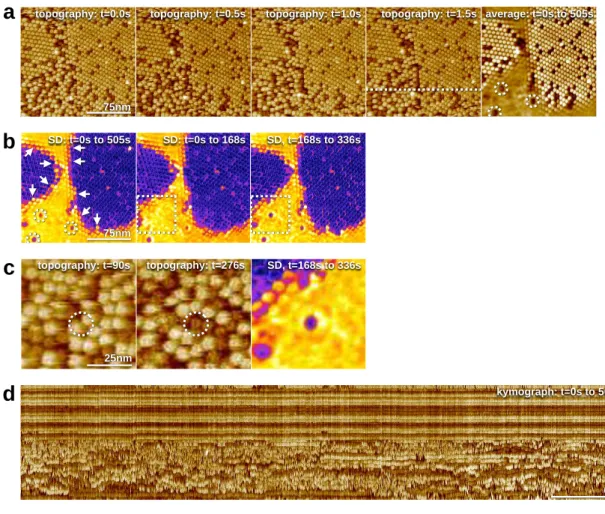
Figure 1) Lysenindynamics is location dependent. a) Four left panels: HS-AFM movie frames
2
(Supplementary Movie 1) ofLysenin inasphingomyelin/cholesterol (1:1) bilayer. Right
panel:Time-3
averaged frame displaying the positional stability and the high mobility of proteins in the solid and fluid
4
domains(full false color scale: 10nm). b) Left: standard deviation (SD) map of the pixel height values
5
505s). Lattice borders with well-defined molecular positions of varying SD(arrows). SD maps
(t=0-6
168s, center) and (t=168-336s, right): At t=168s alocation(dashed squares)drastically changed
7
dynamics(full false color scale: 0.3<SD<1.6nm).c) Individual frames t=90s and t=276s of the molecular
8
organization corresponding to the outlines inb), see also supplementary movie 2. Right: SD map
(t=168-9
336s) of this membrane region displaying the annular alteration of diffusion dynamics around the stuck
10
molecule. d) Kymograph (of thewhite dashed line in a). Stable (top), highly mobile (bottom),and
11
molecules switching between stability andhigh mobility (middle) are visible during the entire movie.
12 13
d
kymograph: t=0s to 505sb
75nm SD: t=0s to 505s SD: t=0s to 168s SD, t=168s to 336sa
75nmtopography: t=0.0s topography: t=0.5s topography: t=1.0s topography: t=1.5s average: t=0s to 505s
25nm
topography: t=90s topography: t=276s
c
SD, t=168s to 336s1
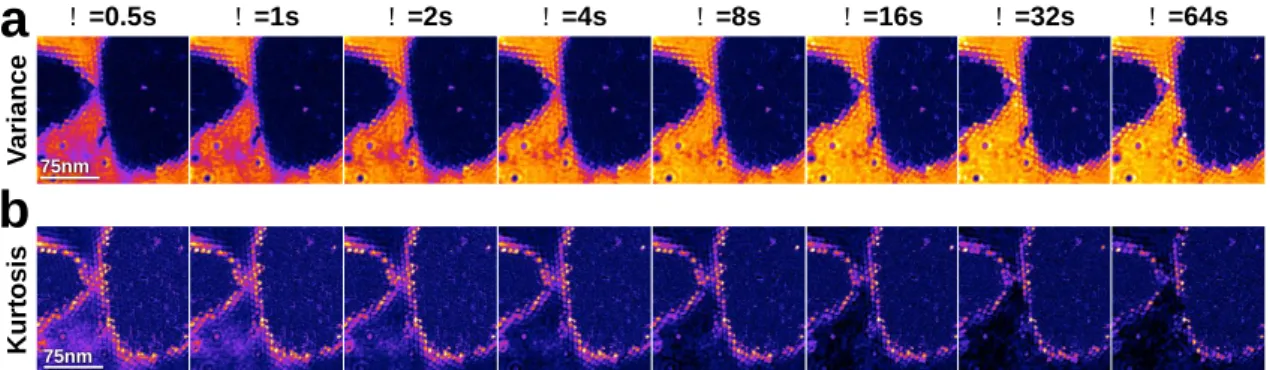
Figure 2) Detection of areas of non-Brownian dynamics. a) Variance(V)of the distribution of height
2
changes (false color scale: 0<V<2nm2).b) Kurtosis(K)(non-Gaussianity) of the distribution of the height
3
changes (false color scale: 2.5<K<5.0)).
4 5 V a ri a n c e K u rt o s is ! =8s ! =4s ! =2s ! =0.5s
a
75nm ! =32s ! =16s ! =64s ! =1sb
75nm1
Figure 3) Diffusion as function of local density. a)Distribution of Variance and b) Kurtosis for all pixels as
2
a function of Voronoi cell area and lag time (color indicates the concentration of data points in the plot
3
area from blue (low abundance) to red (high abundance)). c) Variance and d) Kurtosis as function of lag
4
time and Voronoi cell area: Each point is the median of all pixels with the same characteristics.