Publisher’s version / Version de l'éditeur:
Vous avez des questions? Nous pouvons vous aider. Pour communiquer directement avec un auteur, consultez la première page de la revue dans laquelle son article a été publié afin de trouver ses coordonnées. Si vous n’arrivez pas à les repérer, communiquez avec nous à PublicationsArchive-ArchivesPublications@nrc-cnrc.gc.ca.
Questions? Contact the NRC Publications Archive team at
PublicationsArchive-ArchivesPublications@nrc-cnrc.gc.ca. If you wish to email the authors directly, please see the first page of the publication for their contact information.
https://publications-cnrc.canada.ca/fra/droits
L’accès à ce site Web et l’utilisation de son contenu sont assujettis aux conditions présentées dans le site LISEZ CES CONDITIONS ATTENTIVEMENT AVANT D’UTILISER CE SITE WEB.
Research Report (National Research Council of Canada. Institute for Research in
Construction), 2004-11-01
READ THESE TERMS AND CONDITIONS CAREFULLY BEFORE USING THIS WEBSITE.
https://nrc-publications.canada.ca/eng/copyright
NRC Publications Archive Record / Notice des Archives des publications du CNRC : https://nrc-publications.canada.ca/eng/view/object/?id=cfaf9c3d-c133-461d-bc6a-bddd6857ed03 https://publications-cnrc.canada.ca/fra/voir/objet/?id=cfaf9c3d-c133-461d-bc6a-bddd6857ed03
Archives des publications du CNRC
For the publisher’s version, please access the DOI link below./ Pour consulter la version de l’éditeur, utilisez le lien DOI ci-dessous.
https://doi.org/10.4224/20377381
Access and use of this website and the material on it are subject to the Terms and Conditions set forth at
Comparison of Smoke Measurements with Standard and Non-Standard
Systems
COMPARISON OF
SMOKE
MEASUREMENTS WITH
STANDARD AND
NON-STANDARD SYSTEMS
Research Report # 183
Date of Issue: November 2004
Authors: George P. Crampton and
G. D. Lougheed
Published by
Institute for Research in Construction National Research Council Canada Ottawa, Canada
George P. Crampton and G.D. Lougheed
Abstract
In recent years, the Fire Research Program has constructed several smoke
measurement systems for us e in full-scale experiments. This includes standard systems using incandescent white light and He-Ne laser light sources. Also, a number of other systems using a range of light sources have been developed for specific applications. Benchmark tests were conducted using five of these systems installed in parallel on the exhaust duct for a hood system used for heat release measurements. This report provides the results of the benchmark tests.
COMPARISON OF SMOKE MEASUREMENTS WITH ST ANDARD AND NON-STANDARD SYSTEMS
George P. Crampton and G.D. Lougheed
Introduction
In recent years, the Fire Research Program has constructed several smoke
measurement systems for use in full-scale experiments. This includes standard systems using incandescent white light and He-Ne laser light sources [1,2]. Also, a number of other systems using a range of light sources have been developed for specific applications.
Benchmark tests were conducted using five of these systems installed in parallel on the exhaust duct for a hood system used for heat release measurements. This allowed for the simultaneous measurement of smoke produced by selected test fires for direct comparison of the results. Six tests were conducted using different fuel types including wood cribs, polyurethane foam and heptane/toluene mixture. This report provides the results of the benchmark tests for the smoke measurement systems.
Smoke Measurement Systems
The five smoke measurement devices used in the benchmark tests were as follows. 1. System 1 – Quartz Halogen White Light System. The quartz halogen white
light system consisted of a white light source, filter, optical lenses, aperture and silicon pin diode detector. A 10 W quartz halogen light was used as the light source and a silicon pin diode as the detector. A filter with transmission in the visible region of the spectrum was used in the detection system. This filter reduced the amount of infrared emission typically produced by incandescent light sources that entered the detection system. The spectral response of the silicon pin diode detector is shown in Figure 1.
2. System 2 - Pulsed White Light LED System. This system consisted of a white light LED (light emitting diode) source, aperture and detector. The output of the diode is shown in Figure 2. A silicon pin diode was used as the detector
(Figure 1). The LED was pulsed to minimize the affects of ambient light and temperature variations. This LED source approximates the light sensitivity of the human eye.
3. System 3 - Laser System. The laser system consisted of a laser source, aperture and detector. A laser diode with emission at 660 nm was used as the light source and a silicon pin diode (Figure 1) as the detector.
4. System 4 - Pulsed IR LED System. This system consisted of an IR LED (940 nm) source, aperture and silicon pin diode detector (Figure 1). The LED was pulsed to minimize the affects of ambient light and temperature variations. 5. System 5 - Sampling White Light LED System. For this system, smoke was
extracted from the measurement site using a 50 mm diameter tube. The smoke sample was circulated through a completely enclosed black measuring tube used to eliminate the affects of background light and back into the duct. The light
source and detector were mounted in collimated sections at the ends of the measuring tube to minimize the effects of light reflected from the walls of the device. The same light source and detector used for the pulsed white light LED system was used for the sampling device. However, in this case, the light source was not pulsed.
The smoke meters were calibrated using neutral density filters. Readings at 100% and 0% transmission were also recorded.
For Systems 1-4, the systems used identical detection systems including apertures, collimators, detection diode and electronics. Also, System 5 used the same detection system and electronics as used in the other systems. This was done to minimize the effects of the detection system on the measurements.
Temperature Effects on Pin Photodiodes and Smoke Density Measurement
A reversed biased silicon photodiode produces a current flow proportional to the number of photons that are absorbed in the PN junction or receiving area. This current flow is referred to as the “light current” and is the true signal in smoke density measurements. The diode also has a characteristic “dark current” which is a leakage current across the junction. This dark current is a false signal and it increases as the temperature of the junction increases. The typical ambient dark current for the silicon pin diode used for the smoke measurement systems was 5 nA and the maximum light current was 0.5 mA. If the junction temperature increases beyond 40ºC, the dark current becomes a significant contributor to the total current flow resulting in a false increase in the measured smoke optical density.
To correct for the temperature effect, the smoke meter can be heated in the absence of smoke and the output recorded to develop a temperature adjustment algorithm.
Alternatively, the source can be pulsed at a frequency of 1000 Hz and the receiver used to determine the peak signal. An electronic filter can be used to eliminate the “dark current” effect and minimize the effects of any slow changing conditions such as temperature rise and changing ambient light conditions.
Pulsing an incandescent light source is not possible (without a mechanical chopper) due to the filament’s slow response to thermal cooling and heating. An LED, however, can be pulsed at 1000 Hz without difficulty.
The pulsed output of an LED can be significantly higher than can be safely achieved at DC levels. The LED output is temperature sensitive but electronic compensation is easily achieved using current control and a thermistor feed back circuit. The life of a LED is measured in millions of hours while an incandescent bulb is only a few thousand hours.
Test Arrangement
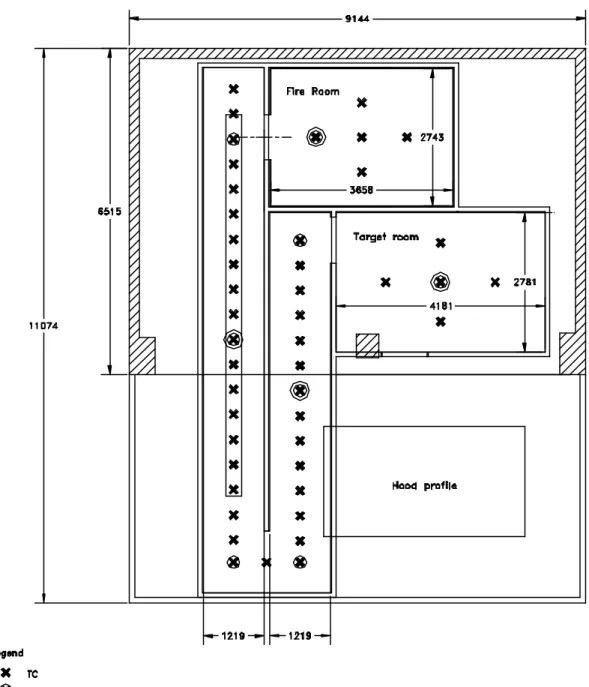
A full-scale test facility that has been used for various projects involving full-scale fire tests. At the time of these tests, the facility was set-up for full-scale tests with
3
measurement tests, the fires were located in the target room (Figure 3). All openings in this room were closed except for the doorway leading to the exterior of the test
arrangement and the hood system. The smoke exiting the test facility was collected in the hood and exhausted through a 560 mm diameter 13 m long duct using a 2-speed fan. The fan was operated at low speed with nominal capacity of 3 m3/s.
The 5 measurement systems were mounted on the exhaust duct used for the full-scale cable test facility. For Systems 1-4, the light source and detector were mounted
diametrically opposite each other on the sides of the duct. The systems were mounted at approximately 458 mm intervals along the length of the duct. The spacing between the devices was sufficient to eliminate any interference between the devices. The sampling system was located at the downstream end of the systems to minimize any interference with the average smoke flow at the measurement locations for the other 4 systems.
For the sampling system, the inlet for the 50 mm diameter sampling tube was located at the center of the duct with the inlet facing the airflow. In this application, the pressure differences developed by the airflow in the duct system were used to produce the smoke flow through the measuring system and back into the exhaust duct. In other
applications, a small fan mounted on the outlet of the system can be used to sample the smoke.
Fire Tests
Six tests were conducted using the following fire sources:
1. 0.6 m diameter pan fire with 1.5 L heptane and 0.5 L toluene mixture
2. wood (pine) crib with 5 rows of 10 sticks each 19 mm x 38 mm x 600 mm long 3. wood (pine) crib - repeat of Test 2
4. polyurethane foam (458 mm x 458 mm x 101.6 mm thick) 5. polyurethane foam (610 mm x 610 mm x 101.6 mm thick)
6. 0.7 m diameter pan fire with mixture of 2.25 L heptane and 0.75 L of toluene The fuels are typical of those used to test smoke detectors and were selected to provide both gray and black smoke. The fire sizes were varied to provide a range of smoke optical densities.
Results
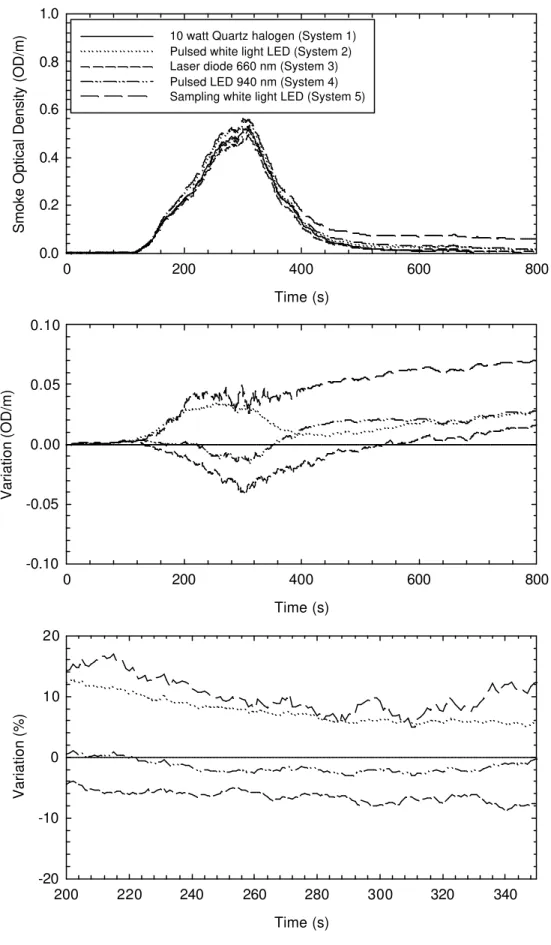
The smoke measurement results for the six tests are shown in Figures 4 – 9. Three plots are shown in each figure:
1. Plot 1. The first plot shows the smoke optical density measured using the five detectors in the test.
2. Plot 2. The second plot shows the variation in the measured smoke optical density using the quartz halogen white light system as the reference with the variation in measured smoke optical density determined as follows:
where
ODQH - smoke optical density measured with quartz halogen white light source
ODsystemi -smoke optical density measured with systemi
3. Plot 3. The third plot shows the variation in % of the output of the
measurement systems relative to the white light system with the quartz halogen light source. The variation in the measurements were calculated using the following relationship:
Variationsystemi(%) = 100 x (ODsystemi – ODQH)/ODQH
Prior to ignition, the measured output of the devices is nominally zero. However, with temperature variations and other factors, a small non-zero measurement < 0.001 OD/m is typically recorded. Any comparison of the relative outputs of the various systems at such low signal outputs can result in large percentage variations in the relative outputs of the systems. Similarly, after the test, the measured smoke optical density was very small resulting in high percentage variations in the measured optical densitises. As such, the plots for this parameter are limited to the time during which there was a fire producing smoke.
The maximum and minimum for Variationsystemi as well as the range of the differences
(Variationsystemi(Max) – Variationsystemi(Min)) determined for each system relative to the
quartz halogen white light system are shown in Table 1. Some general comments on the measurements are as follows:
1. With the white light LED system (System 2), the measured smoke optical density is generally higher relative to that measured with the quartz halogen light source. In some cases, there are negative minimums (Table 1). However, these
generally occur in the decay phase and are likely due to contamination of the optics. Also, the pulsed LED system is less sensitive to temperature variations. Generally, System 2 indicates a higher smoke optical density with the variation ranging from approximately 0.01 OD/m for the tests with optical densities of 0.05 OD/m (Test 4 and 5) to 0.035 OD/m for tests with optical densities of 0.5 – 1 OD/m. The higher optical densities with this system relative to the quartz halogen is likely due to the high spectral emissions in the blue portion of the spectrum (Figure 2). The quartz halogen light source and filter system used in these tests would have higher spectral emissions in the red portion of the spectrum.
2. With the white light sampling system, the measured smoke optical density is generally comparable to that measured using the white light LED (Table 1). However, the white light sampling system is more subject to contamination of the optics resulting in higher optical densities in the decay phase (Test 2).
3. With the laser system (System 3), the magnitude of the variation relative to the quartz halogen system was comparable to those with the white light LED. However, both negative and positive variations were observed depending on the test (Table 1 and Figures 4-9). With the laser system the variation in smoke optical density relative to the quartz halogen and pulsed white light LED was fuel dependent. For the heptane/toluene fires, a higher smoke optical density was measured than both the white light systems (Figures 4 and 9). For the
5
polyurethane tests, smoke optical density measured with the laser system was higher than measured with the quartz halogen but less than measured with the white light LED (Figures 7 - 9). With the wood cribs, the smoke optical density measured with the laser system was less than that measured with the white light systems.
4. The pulsed IR LED system with a light source at 940 nm in the near infrared has higher transmission through smoke. The results shown in Figures 4 - 9 were multiplied by a 1.8 factor. This factor was determined in previous calibration tests using this system and the white light LED system.
The different fuels did have an effect on the measurement with the systems. For the white light diode based systems, the variation relative to the quartz halogen system was typically positive indicating a higher smoke optical density measurement with these systems. The exception was Test 5 with the polyurethane foam for which a negative variation was observed for the sampling system. Other than this exception the
measurements with the two white light LED based systems were generally comparable. With the IR LED and laser systems, higher smoke optical densities were measured relative to the quartz halogen system for the heptane/toluene and polyurethane fuels (Figures 4, 7, 8, 9). However, lower smoke optical densities were measured in the tests with the wood cribs (Figures 5 and 6). This indicates that the smoke particle size (color of smoke) may have some effect on the measurement with these two systems.
Overall the smoke optical densities measured by the five measurement systems were comparable (Figures 4 - 9).
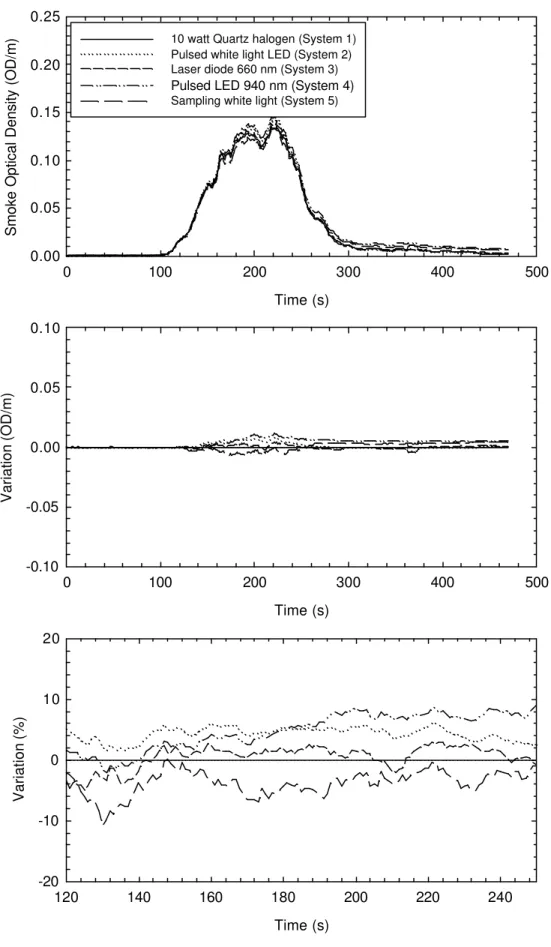
As a percentage, the variations were relatively high for low-level smoke measurements <0.05 OD/m (Figure 7). However, the absolute differences were relatively small
(approximately 0.01 OD/m). Generally, such low-density smoke (visibility range > 25 m) is not of interest for full-scale fire test applications.
Smoke optical densities in the range 0.05 – 0.1 OD/m can be of interest for some applications. This includes investigations related to smoke detector sensitivity and tenability analysis for large spaces. Most of the tests had rapidly increasing smoke optical densities in this region. However, Test 5 with polyurethane foam had a maximum smoke optical density of 0.15 OD/m (Figure 8). There was good comparison (< ± 10%) for the smoke optical densities measured by the 5 systems in the 0.05 – 0.15 OD/m range.
For most full-scale fire tests, smoke optical densities >0.1 OD/m are typically measured. The variation in the measurements was typically <10%. The smoke optical densities typically used as tenability criteria in hazard analysis are at the lower end of this range: 0.08 OD/m (10 m visibility) for large buildings and 0.2 OD/m (2 m visibility) for small buildings such as dwelling units [4].
Summary
The benchmark tests have demonstrated that there is good comparison between the smoke optical densities measured with the 5 smoke measurement systems. The
variations are within acceptable levels over the range of smoke optical densities that can be expected in full-scale fire tests (> 0.05 OD/m).
References
1. ASTM E603-04, Standard Guide for Room Fire Experiments, ASTM International, West Conshohocken, PA, 2004.
2. ASTM E1537-02, Standard Test Method for Fire Testing of Upholstered Furniture, ASTM International, West Conshohocken, PA, 2002.
3. Lougheed, G. D., McCartney, C., Kanabus-Kaminska, M., Full-Scale Fire Tests for Cables in Plenums, ASHRAE Transactions, Volume 110, Part 1, p. 652-665, 2004. 4. Purser, D., Toxicity Assessment of Combustion Products, The SFPE Handbook of
7
Table 1. Maximum and minimum variation relative to the quartz halogen white light source (System 1).
System 2 System 3 System 4 System 5
Test Max Min Range Max Min Range Max Min Range Max Min Range
(OD/m) (OD/m) (OD/m) (OD/m) (OD/m) (OD/m) (OD/m) (OD/m) (OD/m) (OD/m) (OD/m) (OD/m)
1 0.027 -0.007 0.034 0.039 -0.012 0.051 0.055 0.00 0.055 0.020 -0.030 0.050 2 0.035 0.000 0.035 0.016 -0.040 0.056 0.028 -0.016 0.044 0.071 0.000 0.071 3 0.035 -0.081 0.116 0.023 -0.029 0.052 0.035 0.000 0.035 0.037 0.000 0.037 4 0.009 -0.004 0.013 0.008 -0.005 0.013 0.011 -0.003 0.014 0.003 -0.003 0.006 5 0.008 -0.004 0.012 0.004 -0.004 0.008 0.012 -0.008 0.020 0.005 -0.008 0.013 6 0.030 -0.015 0.045 0.069 -0.025 0.094 0.086 -0.002 0.088 0.044 -0.002 0.046
Figure 1. Responsivity of the silicon pin diode.
9
Time (s)
0 50 100 150 200 250 300
Smoke Optical Density (OD/m)
0.0 0.2 0.4 0.6 0.8 1.0 1.2 1.4
10 watt Quartz halogen (System1) Pulsed white light LED (System 2) Laser diode 660 nm (System 3) Pulsed LED 940 nm (System 4) Sampling white light (System 5)
Time (s) 100 120 140 160 180 200 220 Variation (%) -20 -10 0 10 20 Time (s) 0 50 100 150 200 250 300 Variation (OD/m) -0.10 -0.05 0.00 0.05 0.10
11
Time (s)
0 200 400 600 800
Smoke Optical Density (OD/m)
0.0 0.2 0.4 0.6 0.8 1.0
10 watt Quartz halogen (System 1) Pulsed white light LED (System 2) Laser diode 660 nm (System 3) Pulsed LED 940 nm (System 4) Sampling white light LED (System 5)
Time (s) 200 220 240 260 280 300 320 340 Variation (%) -20 -10 0 10 20 Time (s) 0 200 400 600 800 Variation (OD/m) -0.10 -0.05 0.00 0.05 0.10
Time (s)
0 100 200 300 400 500
Smoke Optical Density (OD/m)
0.0 0.2 0.4 0.6 0.8 1.0
10 watt Quartz halogen (System 1) Pulsed white light LED (System 2) Laser diode 660 nm (System 3) Pulsed LED 940 nm (System 4) Sampling white light (System 5)
Time (s) 200 250 300 350 400 Variation (%) -20 -10 0 10 20 Time (s) 0 100 200 300 400 500 Variation (OD/m) -0.10 -0.05 0.00 0.05 0.10
13
Time (s)
0 100 200 300 400 500
Smoke Optical Density (OD/m)
0.00 0.02 0.04 0.06 0.08 0.10 0.12 0.14
10 watt Quartz halogen (System 1) Pulsed white light LED (System 2) Laser diode 660 nm (System 3) Pulsed LED 940 nm (System 4) Sampling white light (System 5)
Time (s) 150 160 170 180 190 200 Variation (%) -20 -10 0 10 20 30 40 Time (s) 0 100 200 300 400 500 Variation (OD/m) -0.10 -0.05 0.00 0.05 0.10
Time (s)
0 100 200 300 400 500
Smoke Optical Density (OD/m)
0.00 0.05 0.10 0.15 0.20 0.25
10 watt Quartz halogen (System 1) Pulsed white light LED (System 2) Laser diode 660 nm (System 3) Pulsed LED 940 nm (System 4) Sampling white light (System 5)
Time (s) 120 140 160 180 200 220 240 Variation (%) -20 -10 0 10 20 Time (s) 0 100 200 300 400 500 Variation (OD/m) -0.10 -0.05 0.00 0.05 0.10
15
Time (s)
0 100 200 300 400 500
Smoke Optical Density (OD/m)
0.0 0.5 1.0 1.5 2.0
10 watt Quartz halogen (System 1) Pulsed white light LED (System 2) Laser diode 660 nm (System 3) Pulsed LED 940 nm (System 4) Sampling white light (System 5)
Time (s) 100 120 140 160 180 200 Variation (%) -20 -10 0 10 20 Time (s) 0 100 200 300 400 500 Variation (OD/m) -0.10 -0.05 0.00 0.05 0.10