Publisher’s version / Version de l'éditeur:
Journal of Magnetic Resonance, 211, 1, pp. 45-61, 2011-04-02
READ THESE TERMS AND CONDITIONS CAREFULLY BEFORE USING THIS WEBSITE.
https://nrc-publications.canada.ca/eng/copyright
Vous avez des questions? Nous pouvons vous aider. Pour communiquer directement avec un auteur, consultez la
première page de la revue dans laquelle son article a été publié afin de trouver ses coordonnées. Si vous n’arrivez pas à les repérer, communiquez avec nous à [email protected].
Questions? Contact the NRC Publications Archive team at
[email protected]. If you wish to email the authors directly, please see the first page of the publication for their contact information.
NRC Publications Archive
Archives des publications du CNRC
This publication could be one of several versions: author’s original, accepted manuscript or the publisher’s version. / La version de cette publication peut être l’une des suivantes : la version prépublication de l’auteur, la version acceptée du manuscrit ou la version de l’éditeur.
For the publisher’s version, please access the DOI link below./ Pour consulter la version de l’éditeur, utilisez le lien DOI ci-dessous.
https://doi.org/10.1016/j.jmr.2011.03.019
Access and use of this website and the material on it are subject to the Terms and Conditions set forth at
Fast magnetic resonance spectroscopic imaging (MRSI) using wavelet encoding and parallel imaging: in vitro results
Fu, Yao; Serrai, Hacene
https://publications-cnrc.canada.ca/fra/droits
L’accès à ce site Web et l’utilisation de son contenu sont assujettis aux conditions présentées dans le site LISEZ CES CONDITIONS ATTENTIVEMENT AVANT D’UTILISER CE SITE WEB.
NRC Publications Record / Notice d'Archives des publications de CNRC:
https://nrc-publications.canada.ca/eng/view/object/?id=d019c2d7-c4cc-41ba-bdd2-a24475b97d4f https://publications-cnrc.canada.ca/fra/voir/objet/?id=d019c2d7-c4cc-41ba-bdd2-a24475b97d4f
Fast magnetic resonance spectroscopic imaging (MRSI) using
wavelet encoding and parallel imaging: In vitro results
Yao Fu,
Hacene Serrai
National Research Council Institute for Biodiagnostics, 435 Ellice Avenue, Winnipeg, MB, Canada R3B 1Y6
University of Manitoba, 15 Gillson Street, Winnipeg, MB, Canada R3T 5V6
Abstract
In previous work we have shown that wavelet encoding spectroscopic imaging (WE-SI) reduces acquisition time and voxel contamination compared to the standard Chemical Shift Imaging (CSI) also known as phase encoding (PE). In this paper, we combine the wavelet encoding method with parallel imaging (WE-PI) technique to further reduce the acquisition time by the acceleration factor R, and preserve the spatial metabolite
distribution. Wavelet encoding provides results with a lower signal-to-noise ratio (SNR) than the phase encoding method. Their combination with parallel imaging, introduces an intrinsic SNR reduction. The rate of SNR reduction is slower in wavelet encoding with PI than PE with parallel imaging (PE-PI). This is due to the fact that in WE-PI, the SNR reduction is a function of the acceleration factor R and the voxel number N, whereas in PE-PI it is a function of the acceleration factor R only.
Graphical abstract
One dimensional Wavelet Encoding - Parallel Imaging (WE-PI) steps for data acquisition and reconstruction (inverse wavelet transform and unfolding using coil sensitivity maps) with MR signal real part in blue and imaginary part in red. Tx is the profile of the transmitted RF pulse and Rx is the received signal for each coil, each one covering a corresponding spatial region.
Highlights
This new spectroscopic imaging technique combines wavelet encoding with parallel imaging.
This technique further reduces acquisition time and minimizes the SNR loss.
Phantom results show that this method reduces acquisition time with minimal voxel contamination.
Folding effect at low resolution is reduced because of the use of wavelet encoding. This is a promising MRSI technique since it is quick, accurate, reliable and
consistent.
Keywords: Magnetic resonance spectroscopy imaging; Wavelet encoding; Parallel
imaging
1. Introduction
Magnetic resonance spectroscopic imaging (MRSI) provides a unique modality to non-invasively study tissue metabolism in vivo; it acquires metabolic information reflecting tissue function and provides a sensitive assessment of chemical alterations [1], [2], [3], [4], [5], [6] and [7]. This may allow for early prognostic information, aiding in the
understanding of development and metabolism, differentiating between diseased and normal tissue, improving treatment, and reducing risk to the patient.
The standard MRSI technique, Chemical Shift Imaging (CSI), referred to here as the phase encoding technique, uses the phase encoding gradients to encode the spatial dimensions [4]. By performing numerous field gradient activations (phase encoding steps), many phase encoded MR signals are acquired, each one filling one point in the k-space domain. The chemical shift information is preserved since no gradient is
activated during data acquisition. Fourier transform is performed on the k-space data to obtain metabolite images [5].
The CSI technique can provide metabolite images with good signal-to-noise ratio (SNR) and high spectral and spatial resolution, but only at the cost of very long acquisition times. These long acquisition times are due to two factors. The first factor is the long spin-lattice relaxation time (T1) of the metabolites (1–2 s in proton and 4–6 s in
phosphorus NMR) requiring a long recovery time TR between phase encoding steps to allow for T1 relaxation. The second is the requirement for a large number of phase
encoding steps in each spatial dimension, to avoid image reconstruction artifacts such as pixel bleed, and collect the extra dimension information namely the chemical shift information which prevents the use of frequency encoding gradients. In order to utilize CSI clinically, spatial resolution is often sacrificed and short TR times relative to T1, are
used, increasing the difficulty of obtaining accurate metabolite concentrations. To overcome these problems, other spectroscopic imaging methods have been proposed. These methods include Hadamard spectroscopic imaging (SI), high speed imaging techniques such as echo planar spectroscopic imaging (EPI) and spiral, fast spin echo (FSE) and echo-shift methods [8]. In contrast to CSI, which uses only phase encoding
gradients to obtain metabolite maps, the high speed methods use the readout gradients to reduce acquisition time and achieve the same task [8]. For a variety of reasons, each of these methods has only been partially successful at improving the original Fourier-based MRSI technique in terms of overall qualitative and quantitative results [8]. In order to further reduce acquisition time, Fourier-based MRSI techniques have been combined with the well-known parallel imaging (PI) method. However, this method combination is associated with a penalty of signal-to-noise ratio (SNR) reduction. Recently a new MRSI technique based upon wavelet encoding spectroscopic imaging (WE-SI) has been proposed as an alternative to the standard Fourier-based CSI to reduce acquisition time and pixel bleed [9]. As detailed previously [10] and [11], this technique is derived from the discrete wavelet transform which uses dilated and translated basis functions, called wavelets, to perform a linear transformation from the spatial domain to the wavelet domain [12]. This linear transformation is a projection in the wavelet domain of a finite space function to produce a set of pre-defined sub-spaces using dilated and translated wavelets. The projection outputs are represented by the so-called wavelet coefficients in the wavelet domain [10], [11] and [12]. Similar to phase encoding (PE), in which an inverse Fourier transform is performed on the k-space data to obtain the input spatial function, in wavelet encoding an inverse wavelet transform is performed on the wavelet domain data (wavelet coefficients) to achieve the same task [12]. In practice, WE-SI is similar to the Hadamard technique [13] since it utilizes
selective radio-frequency (RF) pulses with profiles resembling the shape of wavelets to excite the sub-volumes (by analogy to sub-spaces) of the input image FOV and acquire the corresponding magnetic resonance (MR) signals (wavelet coefficients) to fill the wavelet domain. The wavelet dilations and translations are achieved by changing the localization gradient strength and by shifting the frequency of the selective RF pulses, respectively. The number of wavelet dilations, which sets the number of translations, is determined by the desired number of image voxels N [9] and [13]. Because dilations of the wavelet become increasingly spatially localized, it becomes possible to choose a set of adjacent sub-volumes to be excited without waiting a full TR. Inverse wavelet
transform is performed on the collected wavelet domain data to obtain spatial metabolic information. It has been shown that, compared to Fourier-based techniques, WE-SI may achieve a high caliber of combined qualitative and quantitative results, with minimal cross voxel contamination, and with an acquisition algorithm that does not sacrifice speed [9], [10] and [13]. It is a reliable method, since it provides accurate results with shorter acquisition time and less voxel contamination compared to the standard CSI. To increase the potential of the WE-SI method and shorten the acquisition time, we propose here its combination with the parallel imaging approach. Compared to Fourier encoding with parallel imaging, where predetermined k-space lines are not acquired, wavelet encoding with parallel imaging, does not skip the wavelet coefficients, but acquires them simultaneously. With Fourier encoding, the acceleration factor R sets the number of skipped k-space lines and consequently the reduction of the acquisition time and the SNR. With wavelet encoding, the same reduction in acquisition time as in Fourier encoding is obtained. However, because of the simultaneous acquisition of the wavelet coefficients, the under-sampling degree is related to both R and N. The relative
SNR reduction that results when combining wavelet-encoded spectroscopic imaging with PI is less than the relative reduction when combining Fourier-encoded
spectroscopic imaging and PI.
In this paper, we describe in the theory section the combination principle between wavelet encoding and parallel imaging (WE-PI) in one dimension, in terms of encoding approach, acquisition time, reconstruction strategy, and SNR calculation. We illustrate in the material and methods section, the implementation of WE-PI on a clinical 3T Siemens scanner, and demonstrate its feasibility in acquiring phantom MRSI data. We compare in the results section WE-PI to WE-SI results, in terms of spatial localization, data acquisition time and SNR. Additionally, data acquisition time and SNR calculations are performed for WE-SI and phase encoding with parallel imaging (PE-PI). We show that the proposed technique has similar speed as the Fourier-based methods combined with PI. In addition, the rate at which the SNR decreases in WE-PI is slower relative to PE-PI.
2. Theory and methods
Parallel imaging [14] and [15] is a well-established technique in MR imaging, used to accelerate data acquisition in a wide range of clinical applications [16]. In most cases, parallel imaging has been combined with phase encoding techniques, where acquisition time is reduced by under-sampling k-space by the acceleration factor R. Generally, the acceleration factor R is less than or equal to the number of receiver coils. For simplicity, we set the number of receiver coils equal to R throughout this manuscript. The method uses multiple spatially localized receiver coils to acquire R folded images in the reduced field of view (FOV) scheme. Using coil sensitivity maps, the unfolded full FOV image can be reconstructed pixel by pixel as for SENSE [14] or by recovering the skipped k-space lines prior to image reconstruction as for the SMASH [15] technique.
Wavelet encoding is described in detail elsewhere [9], [13], [17] and [18]. The major steps for encoding in MRSI outlined above are briefly summarized as follows. Dilated and translated wavelets are used to achieve the encoding in MR by performing a linear transformation of the MR spin density system from the image domain to the wavelet domain. It uses selective RF pulses with profiles resembling wavelet shapes, to excite pre-defined sub-volumes and consequently acquire their amplitude modulated MR signals to fill the wavelet domain.
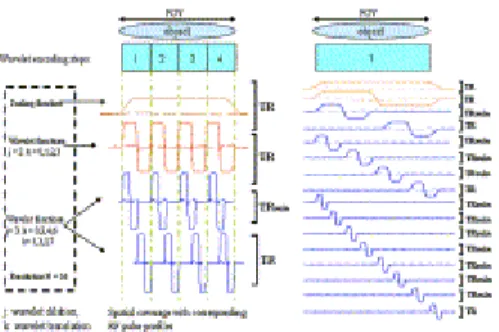
The link between wavelet encoding and parallel imaging resides in the localization principle. From the transmit side, a full FOV image with desired voxel number N, can be divided into N excited sub-volumes, using wavelet encoding, whereas from the receive side, the same image above is automatically split into neighboring fixed regions using R receiver coils assumed to be spatially independent. Fig. 1 displays such an occurrence, where we can derive that each coil region i (i = 1 to R) is subdivided into N/R excited sub-volumes. As a consequence, each coil region i is wavelet-encoded with N/R encoding steps. The corresponding coil image, is obtained by performing the inverse
wavelet transform on the N/R wavelet domain lines collected by the receiver coil i. The collected R coil images are joined in a series to obtain the full FOV image.
Fig. 1. Acquired and reconstructed wavelet domain lines with N = 16 and R = 4. Translation and dilation values k and j are displayed for each wavelet encoding step.
In practice, receiver coils overlap, causing spatial interference between their
corresponding images. An extra step is required that consists of separating the spatial information of the coil images. This resembles the SENSE approach, where R
superimposed coil images are collected first using wavelet encoding, followed by the separation of image information using coil sensitivity maps.
2.1. Encoding and data acquisition
The process of wavelet domain filling using parallel imaging is based upon size comparison between the coil region and wavelet sub-volumes. Fig. 1 displays an example of the combination of wavelet encoding and parallel imaging. Using four receiver coils of the same size, assumed to be spatially independent, the whole FOV, assumed to be [01], is divided into four (i.e. R = 4) identical and non-overlapping regions (dashed green lines), with each region covered by one receiver coil. With a desired number of pixels N = 16, the wavelet domain filling is achieved as follows: (1) with the size of the excited sub-volume bigger than the coil region, the single band RF pulse with profile resembling the Haar scaling function (first line in 1the Fig. 1A with brown color) is used to excite the whole FOV; (2) with excited sub-volume equal to or smaller than the coil region, composite RF pulses, with profiles shown by the red and blue lines in Fig. 1A, are used to excite spins from R specifically located sub-volumes within coil regions defined by:
(1)
Each composite RF pulse is composed of a group of R sub-pulses, each with a profile resembling the Haar wavelet function:
Each wavelet function acts within the corresponding coil region i with the dilation parameter j (j = 0, 1, …, J (J = logB2B(N/R) − 1), and the translation parameter k, given
by k = 0, 1, …, 2j− 1. The receiver coil regions should have an equal size, and obey the wavelet encoding dilation condition, with their number R chosen among the set
2, 22, ..., N.
The encoding with WE-PI appears as if the WE-SI technique is simultaneously used to encode the coil regions, each one with a reduced image size [N/R] but with the same spatial resolution. As a consequence, acquisition time in WE-PI is the WE-SI acquisition time [19] reduced by the factor R. Since the WE-SI technique is generally quicker than CSI [9]; the WE-PI technique is also generally quicker than PE-PI (Fig. 1).
2.2. Data reconstruction
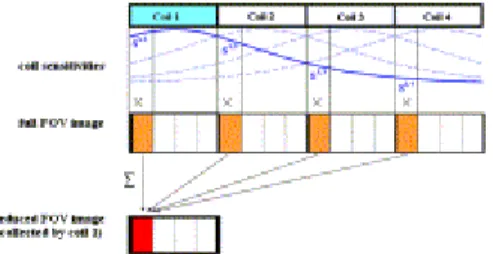
In practice, spatial overlap between coil regions occurs when using composite RF pulses. As shown in Fig. 2, during simultaneous acquisitions, each coil covering a fixed region collects some extra signal from neighboring ones. This interference has to be addressed during data reconstruction.
Fig. 2. Simulation of acquired and reconstructed wavelet lines as a result of reduction in WE-PI for a speed factor R = 4. RF profiles and coil sensitivities.
Each receiver coil i collects encoding lines weighted by its sensitivity si(x) from the whole FOV image:
(3)
with f(x) representing the full FOV image. Substituting Eq. (1) into Eq. (3), we obtain: (4)
Given that the FOV = [01] is divided into R adjacent regions (l/R, (l + 1)/R), (l = 0 to R − 1), one can divide the collected lines into R groups, each one originating from the corresponding excited region l. As a consequence the equation above may be written as:
(5)
with fi(x) = si(x) f(x) representing the full FOV image weighted by the coil i.
Each group of N/R lines is the encoding of the corresponding region l. Applying the inverse wavelet transform (IWT) [20] on each group of lines, we obtain:
(6)
(7)
The equation above represents the pixel-wise superimposition of the R images of the coil regions spatially weighted by the coil i. Each region is bounded by ( , ) with the corresponding reduced image size N/R, where n runs from 1 to N/R. Fig. 3 is a
schematic representation of a full FOV rectangular object, divided into R = 4 regions. The image region shown in red is the sum of the four weighted image regions shown in orange, collected by coil number 1. The expansion to a full FOV image, pixel-wise, requires the use of the contiguous R superimposed reduced size images of the R receiver coils as follows:
(8)
where S is the R by R coil sensitivity matrix. By inverting the sensitivity matrix S, the full FOV image fn is pixel-wise recovered:
(9)
and U=(SHψ-1S)-1SHψ-1, where the superscript H denotes the transposed complex conjugate and ψ is the noise correlation determined experimentally.
Fig. 3. Schematic representation of a full FOV rectangular object, divided into =4 regions. The image region showing in red is the sum of the four weighted image regions showing in orange, collected by coil number 1. (For interpretation of the references to colour in this figure legend, the reader is referred to the web version of this article.)
2.3. Signal to noise ratio
The WE-PI technique is the combination of wavelet encoding with parallel imaging. The SNR of a one dimensional wavelet encoding is given by [21]:
(10)
where E0, Ek, Etotal, and En are the signal energy of the single band RF pulse, the signal energy of the translated dual-band RF pulse for given k value, the total energy required for a Fourier encoding with the same acquisition parameters and conditions, and the noise energy, respectively. Notice in the equation above that while both signal and noise are increased by the 2j factor, only the signal is normalized to its corresponding scale by the factor 2−j, causing an increase of noise energy by almost N/3 in wavelet encoding compared to Fourier encoding [21]. Replacing N with N/R, the following equation holds for WE-PI:
Because of the scaling, the total energy in WE-SI, Etotal = NE0 becomes equal to in
WE-PI. Inserting the parallel imaging contribution part as described in [14] into Eq. (11), the full SNR equation for WE-PI is given by:
(12)
where gn as the nth position coil g factor calculated using
with S being the coil sensitivity map and the noise correlation matrix [14].
As function of WE-SI, the equation above becomes: (13)
Notice that with R = 1 (no acceleration is performed), the SNRWE-PI approaches the
SNRWE-SI up to the coil factor gn.
One notices from Eq. (13) that, for a given constant g factor, the SNR decrease in wavelet encoding with parallel imaging, is a function of R and N, whereas with phase encoding, the SNR given by , is a function of R only (Eq. (24) in reference [14]). As a consequence, the SNR in WE-PI declines more slowly with the acceleration factor, R, than the SNR in PE-PI declines with R. In comparison to the SNR of PE-PI given by , and inserting this into Eq. (12), we obtain:
Notice that at N = R or N = 2R, the SNR of both techniques are equal ( ). With N > 2R we have .
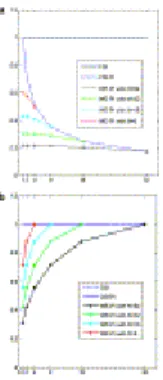
Fig. 4a and b display the rate at which the SNR drops for both phase encoding and wavelet encoding as a function of R and N and per-unit-time respectively.
Fig. 4. (a) The SNR decrease rate for both phase encoding and wavelet encoding as a function of the acceleration factor and the resolution. (b) The SNR decrease rate per unit-time for both phase encoding and wavelet encoding.
3. Phantom studies and results
The proposed wavelet encoding parallel imaging scheme is implemented on a 3 Tesla Siemens whole body clinical scanner using a modified WE-SI sequence [10] and [11]. The acceleration is performed in one dimension, the left right direction, with an
acceleration factor R = 2. Using the Siemens multi-receive head coil [22] coil sensitivity maps are collected. The excitation RF pulses with single band and redundant dual-band profiles, generated using the Shinnar–LeRoux algorithm [23] with 9 kHz bandwidth and 5.2 ms duration, are applied along the acceleration direction. Phantom studies using both WE-SI and WE-PI are conducted at pixel number N = 4 and N = 8 with the
following acquisition parameters: TR = 2 s, TE = 75 ms, FOV = 180 mm by 20 mm, slice thickness = 30 mm, ADC bandwidth = 2 kHz, 1024 sample points, and two averages. With WE-PI, the body coil is used for RF pulse transmission and the Siemens multi-receive coil for signal detection. With WE-SI a single channel head coil is used for both signal transmission and data collection. The phantoms are made from cylindrical tubes filled with aqueous solutions of metabolites with known concentrations, placed in holes of an inner plastic chamber, the latter surrounded by water and in turn immersed in an outer plastic chamber filled with canola oil. Data reconstruction involves both the inverse wavelet transform and the SENSE technique. The coil g factor is calculated from the coil sensitivity maps similar to the SENSE technique [14].
As shown in Fig. 5 and Fig. 6, the WE-PI method provides accurate spatial metabolite distribution at both resolutions. Acquisition time and experimental SNR values for both WE-PI and WE-SI are reported in Table 1. These acquisition times and SNR
experimental results are compared to the theoretical phase encoding results, with and without parallel imaging. The experimental SNR values are calculated as the ratio of the
Succinate peak intensity and the standard deviation of the noise. The calculated coil g value at the Succinate position is equal to 1.35 and 1.64 for 4 × 1 × 1 and 8 × 1 × 1 respectively. Data quantification has not been performed due to the difference in
settings between the two methods. The body coil is used for RF pulse transmission and multiple receiver coils for signal detection in the WE-PI implementation, whereas WE-SI uses a single channel transmit receive coil to achieve both operations.
Fig. 5. Correct spatial metabolite distribution for WE-PI in 4 by 1 by1.
Fig. 6. Correct spatial metabolite distribution for WE-PI in 8 by 1 by1. (real part of the spectra of Fig. 7).
Table 1. Acquisition time and SNR of CSI, WE-SI, and WE-PI; CSI results are from calculation, SNRcsi is set to one. The experimental SNR values for WE-SI and WE-PI are calculated as peak intensity/noise standard deviation of the succinate. The g factor is calculated from the coil sensitivity map which at the succinate position is equal to 1.35 and 1.64 for 4 × 1 × 1 and 8 × 1 × 1
respectively.
Resolution Method Acquisition time (s) SNR (experiment) (a.u.) SNR (calculated) (a.u.) 4 × 1 × 1 CSI 16 1 WE-SI 14 0.82 WE-PI 8 0.49 0.71/g = 0.52 8 × 1 × 1 CSI 32 1 WE-SI 23 0.61 WE-PI 14 0.33 0.58/g = 0.35
Fig. 7 shows the WE-PI steps to acquire and reconstruct the spectroscopic imaging data for a resolution of eight. In Fig. 7A the simultaneous MR signals acquired using two receiver coils and composite RF pulses are shown. Fig. 7B displays the spatial signal distribution after the inverse wavelet transform has been performed. Data contamination due to coil overlap coverage is visible. Fig. 7C represents the final step with the correct
spatial distribution of the spectra. The real part (blue) of these spectra is also shown overlaid on the image tubes in Fig. 6 for the resolution of eight.
Fig. 7. WE-PI steps for data acquisition and reconstruction (inverse wavelet transform and unfolding using coil sensitivity maps) for N = 8 and R = 2 with real part in blue and imaginary part in red (see Fig. 6 for metabolite spectra overlaid on phantom images). Tx is the profile of the transmitted RF pulse and Rx is the received signal for each coil, each one covering a corresponding region. (For interpretation of the references to colour in this figure legend, the reader is referred to the web version of this article.)
Acquisition time and SNR results are comparable to the theoretical ones for the WE-PI technique. Acquisition time in WE-PI is reduced by approximately the factor R as compared to that for WE-SI. The calculated SNR is given as a function of the g factor calculated from coil sensitivity maps. The use of more receiver channels will reduce the g factor and consequently increase the SNR. The SNR of PE-PI will drop by
approaching 0.52 (R = 2 and g = 1.35), which is comparable to the WE-PI value at N = 4. Phantom results show that WE-PI provides accurate results with further reduced acquisition time. The results also show that the SNR decrease rate with WE-PI is relatively less than with PE-PI. Further tests are being conducted to reduce the g factor for SNR improvements.
4. Conclusion
A new spectroscopic imaging technique derived from a combination of wavelet encoding and parallel imaging to further reduce acquisition time is proposed. The
method exploits the advantages of both techniques. Data acquisition is accelerated at a similar rate as the most spectroscopic imaging methods because of the use of parallel imaging approach and spatial metabolite distribution is preserved because of the use of wavelet encoding.
As compared to phase encoding, the SNR value of this method is lower due to the use of wavelet encoding. Nonetheless, wavelet encoding has been useful in multi-slice imaging techniques, where it has been used to encode the slice dimension with a resulting increase in SNR [24]. The incorporation of parallel imaging induces a further SNR decrease due to data under-sampling. As described above, the decreased SNR rate with wavelet encoding is a function of both the pixel/voxel number N and the acceleration factor R, whereas with phase encoding it is a function of the factor R only. As a consequence, at a given N value approaching R value or its multiple, the SNR
values of both techniques coincide. The preliminary phantom results converge in this direction, demonstrating that this method combination reaches its first main goal in accelerating the data acquisition with similar speed as the phase encoding with parallel imaging method. It is quicker if the acquisition time reduction inherent to WE-SI is introduced into WE-PI. In addition, data is acquired with high spectral resolution, and a broad spectral bandwidth allowing for coverage of a large number of metabolite peaks, whereas with echo planar spectroscopic imaging the spectral bandwidth is reduced to speed up data acquisition. In conclusion, WE-PI is a promising MRSI technique which addresses some of the limitations of current high speed MRSI techniques. It is quick, accurate, reliable and consistent. Extension of the acceleration to two dimensions and in vivo validations are in progress.
Acknowledgment
The authors would like to thank E. Packulak and O. Ijare of the National Research Council for their help in the preparation of phantoms.
References
1. E. Graves, S. Nelson, D. Vigneron, L. Verhey, M. McDermott, D. Larson, S. Chang, M. Prados, W. Dillon Serial proton MR spectroscopic imaging of recurrent malignant gliomas after gamma knife radiosurgery AJNR Am. J. Neuroradiol., 22 (4) (2001), pp. 613–624
2. J. Kurhanewicz, M. Swanson, P. Wood, D. Vigneron Magnetic resonance imaging and spectroscopic imaging: Improved patient selection and potential for metabolic intermediate endpoints in prostate cancer chemoprevention trials Urology, 57 (4) (2001), pp. 124–128
3. S. Posse, T. Gioacchino, O.R. Risinger, D.L. Bihan High-speed 1H
spectroscopic imaging in human brain by echo-planar spatial-spectral encoding Mag. Reson. Med., 33 (1) (1995), pp. 34–40
4. T.B. Brown, B.M. Kincaid, K. Ugurbil NMR chemical shift imaging in three dimensions Proc. Natl. Acad. Sci., 79 (1982), pp. 3523–3526
5. A.A. Maudsley, K. Hilal Spatially resolved high resolution spectroscopy by four dimensional NMR J. Magn. Reson., 51 (1983), pp. 147–152
6. E. Adalsteinsson, P. Irarrazabal, S. Topp, G. Meyer, A. Macovski, D.M. Spielman Volumetric spectroscopic imaging with spiral-based k-space trajectories Mag. Reson. Med., 39 (8) (1998), pp. 889–898
7. L.G. Hanson, K. Schaumburg, O.B. Paulson Reconstruction strategy for echo planar spectroscopy and its application to partially undersampled imaging Mag. Reson. Med., 44 (2000), pp. 412–417
8. R. Phomann, M. Von Kienlin, A. Haase Theoretical evaluation and comparison of fast chemical shift imaging methodsJ. Mag. Reson., 160 (1997), pp. 145–160 9. R.Young.;H. Serrai Implementation of three-dimensional wavelet encoding
spectroscopic imaging: in vivo application and method comparison Mag. Reson. Med., 61 (2009), pp. 6–15
10. Y. Fu, H. Serrai, Implementation of wavelet encoding spectroscopic imaging technique on a 3 Tesla whole body MR scanner: in vitro results, Proc. IEEE EMBS, 2009.
11. Y. Fu, H. Serrai, In vivo wavelet encoding spectroscopic imaging results at 3 Tesla: comparison to chemical shift imaging, ISMRM Stockholm, 2010.
12. Daubechies, Ten lectures on wavelets, CBMS-NSF Lecture Notes nr. 61, SIAM, 1992.
13. H. Serrai, L. Senhadji Acquisition time reduction in magnetic resonance spectroscopic imaging using discrete wavelet encoding J. Mag. Reson., 177 (2005), pp. 22–30
14. K. Pruessmann, M. Weiger, M. Scheidegger, P. Boesiger SENSE: sensitivity encoding for fast MRI Mag. Reson. Med., 42 (1999), pp. 952–962
15. D. Sodickson, W. Manning Simultaneous acquisition of spatial harmonics (SMASH): fast imaging with radiofrequency coil arrays Mag. Reson. Med., 38 (1997), pp. 591–603
16. Stefan O. Schönberg, Olaf Dietrich, Maximilian F. Reiser (Eds.), Parallel imaging in clinical MR applications, Springer (2007)
17. L. Panych, P. Jakab, F. Jolesz An implementation of wavelet-encoded MRI JMRI, 3 (1993), pp. 649–655
18. L. Panych, G. Zientara, P. Saiviroonporn, S. Yoo, F. Jolesz Digital wavelet-encoded MRI JMRI, 8 (1998), pp. 1135–1144
19. Y. Fu, H. Serrai, Wavelet-encoded MR spectroscopic imaging incorporating parallel imaging to further reduce acquisition time: in vitro results, ISMRM Stockholm, 2010.
20. Daubechies Ten lectures on wavelet CBMS, SIAM, Philadelphia, PA (1994) 21. J.B. Weaver, D.M. Healy Signal-to-Noise ratios and effective repetition times for
wavelet encoding and encoding with wavelet packet bases J. Mag. Reson. (A), 113 (1995), pp. 1–10
22. Reykowski, M. Blasche Mode matrix – A generalized signal combiner for parallel imaging arrays Proc. Int. Soc. Mag. Reson. Med., 11 (2004)
23. J. Pauly, P. Le Roux, D. Nishimura, A. Macovski Parameter relations for the Shinnar–Le Roux selective excitation pulse design algorithm IEEE Trans. Med. Imaging, 10 (1991), pp. 53–65
24. N. Gelman, M.L. Wood Wavelet encoding for improved SNR and retrospective slice thickness adjustment Mag. Reson. Med., 39 (1998), pp. 383–391