UNCORRECTED PR
OOF
1Q5
Critical review of EPS production, synthesis and composition
2
for sludge flocculation
3Q6
Q7
Klai Nouha
1, Ram Saurabh Kumar
1,⁎
, S. Balasubramanian
2Q8
, R.D. Tyagi
14 1. Université du Québec, Institut national de la Recherche Scientifique, Centre Eau, Terre & Environnement, 490 de la Couronne,
5 Québec G1K 9A9, Canada
6 2. Institut Armand-Frappier, 531 boul. des Prairies, Laval, Québec H7V 1B7, Canada 7 9
A R T I C L E I N F O
10A B S T R A C T
11 Article history: 12 Received 23 November 2016 13 Revised 12 May 2017 14 Accepted 12 May 2017 15 Available online xxxx 16 Extracellular polymeric substances (EPS) produced by microorganisms represent biological17 macromolecules with unfathomable potentials and they are required to be explored further
18 for their potential application as a bioflocculant in various wastewater sludge treatment.
19 Although several studies already exist on biosynthetic pathways of different classical
20 biopolymers like alginate and xanthan, no dedicated studies are available for EPS in sludge.
21 This review highlights the EPS composition, functionality, and biodegradability for its
22 potential use as a carbon source for production of other metabolites. Furthermore, the effect
23 of various extraction methods (physical and chemical) on compositional, structural,
24 physical and functional properties of microbial EPS has been addressed. The vital
25 knowledge of the effect of extraction method on various important attributes of EPS can
26 help to choose the suitable extraction method depending upon the intended use of EPS. The
27 possible use of different molecular biological techniques for enhanced production of
28 desired EPS was summarized.
29 © 2017 The Research Center for Eco-Environmental Sciences, Chinese Academy of Sciences.
30 Published by Elsevier B.V. 31 Keywords:
32 Extracellular polymeric substances 33 Metabolic pathways 34 Extraction methods 35 Flocculation properties 36 37 38 39 40 41 42
Contents
43 Introduction . . . 0 44 1. Composition of EPS . . . 0 45 1.1. Polysaccharides (carbohydrates) . . . 0 46 1.2. Protein . . . 047 1.3. DNA and humic substances . . . 0
48 2. EPS biosynthesis . . . 0
49 2.1. Synthesis of precursor substrate . . . 0
50 2.2. Polymerization and cytoplasmic membrane transfer . . . 0
51 2.3. Export through the outer membrane . . . 0 J O U R N A L O F E N V I R O N M E N T A L S C I E N C E S X X ( 2 0 1 7 ) X X X – X X X
Abbreviations: C/N, carbon to nitrogen molar ratio; CER, cation exchange resin; EDTA, Ethylene di amine tetra acetate group; EPS, exopolysaccharide or extra cellular polymeric substances; FTIR, Fourier Transform Infrared spectroscopy technique; GDP, Guanosine di phosphate; GT, Glucosyltransferase; MBR, membrane bioreactor; SEC, size exclusion chromatography; SS, suspended solids; UDP, uridine diphosphate; VSS, volatile suspended solids; WWTP, waste water treatment plant or wastewater treatment process.
⁎ Corresponding author. E-mail:[email protected](Ram Saurabh Kumar).
http://dx.doi.org/10.1016/j.jes.2017.05.020
1001-0742/© 2017 The Research Center for Eco-Environmental Sciences, Chinese Academy of Sciences. Published by Elsevier B.V. A v a i l a b l e o n l i n e a t w w w . s c i e n c e d i r e c t . c o m
ScienceDirect
w w w . e l s e v i e r . c o m / l o c a t e / j e sUNCORRECTED PR
OOF
52 3. Engineering strategies for bacterial polysaccharides biosynthesis . . . 0
53 4. EPS production methodology . . . 0
54 4.1. EPS extracted directly from sludge . . . 0
55 4.2. EPS production using pure carbon sources . . . 0
56 4.3. Use of sludge as nutrient source for EPS production . . . 0
57 5. EPS extraction . . . 0
58 5.1. Physical methods . . . 0
59 5.2. Chemical methods . . . 0
60 5.3. Chemical methods vs physical methods . . . 0
61 5.4. Combination of different methods . . . 0
62 5.5. Effect of extraction methods on functional group and molecular weight of EPS . . . 0
63 6. Potential applications of EPS . . . 0
64 6.1. EPS as adsorbent . . . 0
65 6.2. EPS as carbon source . . . 0
66 6.3. Effect of functional group and molecular weight on flocculation activity . . . 0
67 7. Conclusion and recommendations . . . 0
68 References . . . 0 69
70
71
Introduction
72 In general, sludge settling is improved by the addition of 73 synthetic polymers, but they are known to be expensive and 74 may further pollute the environment (Deng et al., 2003). To 75 minimize the use of synthetic flocculants in sludge settling 76 applications, a novel alternative approach will be to use eco-77 friendly bio coagulants/bioflocculants. The role of extracellular 78 polymeric substances (EPSs) produced by sludge
microorgan-79 isms during the wastewater treatment process have been
80 extensively studied (Hay et al., 2010; More et al., 2014; 81 Subramanian et al., 2010). Recently, a demand of biopolymers 82 for various industrial, biotechnological and environmental 83 applications like flocculation, settling, dewatering of sludge, 84 dyes and metal removal from wastewater has rekindled the 85 interest in EPS production (Nontembiso et al., 2011; Zhang et al., 86 2012).
87 The main characteristic of EPS is to enhance aggregation of 88 bacterial cells and suspended solids (SS). Adhesion and cohesion
89 occur between EPS and the biomass along with suspended
90 solids by complex interactions such as London forces, electro-91 statics interactions and hydrogen bonding, which leads to the 92 formation of flocs. These EPS properties make them suitable 93 for many applications such as sludge flocculation, settling,
94 dewatering, metal binding and removal of toxic organic
95 compounds (Chien et al., 2013; Jia et al., 2011; Nouha et al. 96 2016; Solís et al., 2012).
97 Microbial EPS biosynthesis promotes the attachment of the 98 cells to a solid support. It helps in the establishment and 99 continuation of microbial colonies to a mature biofilm structure 100 and protects from environmental stress.Rehm (2010)published 101 a review on critical EPS biosynthesis and metabolic pathways. 102 EPS biosynthesis pathway depends on the type of EPS being 103 produced i.e., homopolysaccharides or heteropolysaccharides. 104 Three major steps involved in EPS synthesis are (i) assimilation 105 of a carbon substrate, (ii) intracellular synthesis of the polysac-106 charides and (iii) EPS exudation out of the cell (Vandamme et al., 107 2002). However, these EPS production steps depend on multiple 108 factors like the microbial species (genes involved in EPS
109 synthesis), media composition (carbon and nitrogen source,
110 C/N ratio), and operating conditions (pH, temperature, dissolved
111 oxygen).
112 Many EPS extraction methods have been used to extract
113 EPS produced by pure microbial cultures (laboratory
condi-114 tions) and mixed culture (activated sludge) (Nguyen et al.,
115 2016; Nouha et al., 2016a, 2016b). Chemical, physical and Q9 116 combination of both methods were used for EPS extraction
117 (Comte et al., 2006a; Nguyen et al., 2016; Nouha et al., 2016a,
118 2016b). The efficiency of EPS extraction by different methods
119 have been compared (Comte et al., 2006a; Liu and Fang, 2002)
120 based on the quantity and the composition of extracted EPS.
121 EPS is mainly composed of carbohydrates and proteins.
122 Carbohydrate was mainly observed in EPS produced from
123 pure cultures, whereas proteins were found in higher
quan-124 tities in the sludge-EPS of many wastewater treatment plants
125 (Liu and Fang, 2002). However, the EPS chemical structure
126 (functional group), molecular weight (MW) and its effect on
127 bioflocculant activity were greatly limited by extraction
128 methods, which were never reviewed.
129 Scientific findings on general metabolism required for EPS
130 precursor biosynthesis and different metabolic engineering
131 strategies for EPS overproduction in some bacterial strains are
132 reported in this review. Secondly, the significant recent
133 developments concerning the impact of extraction methods
134 on EPS composition, chemical structure and molecular weight
135 was critically reviewed and discussed in the ambit of sludge
136 flocculation. 137 138
1. Composition of EPS
139 The chemical structure of polymeric substances secreted by140 the microbial cells depends on the different environmental
141 conditions they grew, which are highly diversified. The most
142 investigated components of EPS are polysaccharides and
143 proteins (More et al., 2012; Nouha et al. 2016; Subramanian
144 et al., 2010). The presence of humic substances and nucleic
145 acids as part of EPS extracted from sludge were also reported
UNCORRECTED PR
OOF
146 in some of the previous studies (Nguyen et al., 2016; Nouha147 et al. 2016; Sutherland, 2001). 148 1.1. Polysaccharides (carbohydrates)
149 Most EPS produced by microorganisms contains carbohydrate 150 or polysaccharides. Microbial exopolysaccharides are com-151 prised of either homopolysaccharides or heteropolysaccharides 152 (Monsan et al., 2001). Homopolysaccharides are composed 153 of only simple sugars and heteropolysaccharides contain 154 repeated units of various monosaccharides such asD-glucose, 155 D-galactose, L-fructose, L-rhamnose, D-glucuronic acid, 156 L-guluronic acid andD-mannuronic acid. For example, alginate 157 is a heteropolysaccharide produced by Pseudomonas aeruginosa 158 and Azotobacter vinelandii, which is composed ofD-mannosyl 159 andL-glucuronosyl residues. However, dextran, a homopoly-160 saccharide consisting only dextrose (glucose) units, is produced 161 by Leuconostoc sp. and Streptococcus sp. (Rehm, 2010). The 162 carbohydrate content of EPS can get affected by various factors 163 during the production and extraction of EPS. The major factors 164 that significantly affect the carbohydrate content of EPS are the 165 microorganism, carbon substrate, nutrients (N, P) and the 166 extraction method utilized for extraction.
167 The microbial species is also one of the main factors that
168 define the composition of EPS produced based on their
169 genetics and metabolic pathways, although, the same strain 170 can also produce EPS with different concentrations and com-171 positions when fed with various carbon or nitrogen source 172 in the cultivation media. It was reported that Lactobacillus 173 delbrueckii produced 175 mg/L of EPS using glucose as carbon
174 source whereas only 69 mg/L of EPS was obtained from
175 fructose (Yuksekdag and Aslim, 2008).
176 The use of different carbon sources had a considerable 177 change in EPS concentration and composition.Ye et al. (2011) 178 reported that the polysaccharide content in loosely bound EPS 179 (LB-EPS) produced in the activated sludge using acetate was 180 lower than that of grown in starch or glucose. The possible
181 cause of this phenomenon can be due to the different
182 metabolic pathways employed by the microorganism to
183 metabolize glucose and sodium acetate. Sodium acetate can 184 enter the citric acid cycle directly, but glucose and starch have 185 to be degraded to pyruvate and then oxidized to form acetyl-186 CoA before it enters the citric acid cycle (Ye et al., 2011). 187 Furthermore, the effect on the content of EPS components 188 was evaluated by varying nitrogen and phosphorus ratio byHoa 189 et al. (2003). The content of total EPS produced in AS (activated 190 sludge) media ranged from 24.4 to 89.9 mg/g SS with 16 to 94% 191 carbohydrate component of the total EPS. It was reported that 192 phosphorus had a more significant effect on the carbohydrate 193 content of EPS than nitrogen (Hoa et al., 2003).
194 Shin et al. (2001), reported that maximum EPS concentration 195 observed by physical extraction methods were 166 mg/g DW 196 (dry weight) of EPS and 183 mg/g DW of EPS from sludge A and 197 B, respectively (Comte et al., 2006b). However, a low content of
198 24–53 mg polysaccharides/g EPS DW was observed when
199 chemical extraction methods were used. Thus the carbohydrate 200 content of extracted EPS varied widely as a function of sludge 201 origin and the extraction conditions or the method used. 202 Therefore, the variation in carbohydrate content of EPS can 203 be attributed to factors like media composition (carbon and
204 nitrogen source), extraction methods and growth conditions,
205 which in turn can affect the EPS bioflocculant property.
206 1.2. Protein
207 Ton-That et al. (2004)stated that the protein was the principal
208 component of the EPS matrix in the activated sludge and EPS
209 (protein) production was not hugely affected by the type of
210 substrates used for microbial growth. These results were in
211 agreement with the observations ofFrolund et al. (1995)and
212 Liu et al. (2007)who also reported a consistent protein content
213 (in activated sludge EPS), when microbe was supplied with
214 different types of carbon sources (glucose, sodium acetate).
215 Hoa et al. (2003) investigated the effect of nitrogen
supple-216 mentation and reported that the protein content of EPS could
217 be affected by nitrogen (NH4Cl) limiting situations, which
218 result in an increase of protein content of EPS (1.25 to 8.56 mg
219 protein/g SS). It was found that the protein content of EPS was
220 inversely proportional to nitrogen content in the activated
221 sludge, while it remains unaffected by phosphorus.
222 1.3. DNA and humic substances
223 DNA or nucleic acid is an intracellular component once
224 released by cell lysis, which could be adsorbed to EPS matrix.
225 Humic substances are components which are present
natu-226 rally in activated sludge from hydrolysis of organic residues.
227 The humic substances get adsorbed to EPS matrix (biofilm) by
228 different functional groups like a carboxylic and phenolic
229 group. A biofilm is defined as an aggregation of bacteria
230 enclosed in a matrix consisting of a mixture of polymeric
231 compounds (Vu et al., 2009).
232 Nucleic acids and humic substances have been reported to
233 influence the rheological properties and stability of biofilms
234 (Neu, 1996). The extracellular DNA (eDNA) is required for the
235 initial establishment of biofilms by P. aeruginosa. The eDNA
236 helps in bacterium-surface adhesion by modulating charge
237 and hydrophobicity interactions between the microbe and the
238 abiotic surface (Nguyen et al., 2016). Similarly, the biofilm is
239 formed by many other bacteria that specifically release DNA
240 in stress conditions or due to cell lysis (Marvasi et al., 2010).
241 As evident from the discussion above, EPS biochemical
242 composition is affected by many factors like microbial species,
243 carbon source, nutrient supplementation and the downstream
244 extraction methods. The composition of the EPS molecule is
245 very important as it determines ultimately the functional
246 property of the molecule as bioflocculant. The chemical
247 composition of the EPS thus produced can determine its
248 suitability for various kinds of applications. Among the various
249 novel applications that EPS can be used for, metal removal is the
250 most prominent one. EPS as carbon substrate has drawn the
251 significant attention of researchers and the subsequent section
252 is dedicated to these two applications of EPS.
253 254
2. EPS biosynthesis
255 Extracellular polysaccharide synthesis by microorganisms is
256 accomplished by a specific secreted enzyme (polymerization
257 and precursor synthesis enzymes), and synthesis can occur
UNCORRECTED PR
OOF
258 either outside the cell or within the cell wall (Roger, 2002).259 Table 1 present the several classes of polymers and their 260 diverse characteristics.
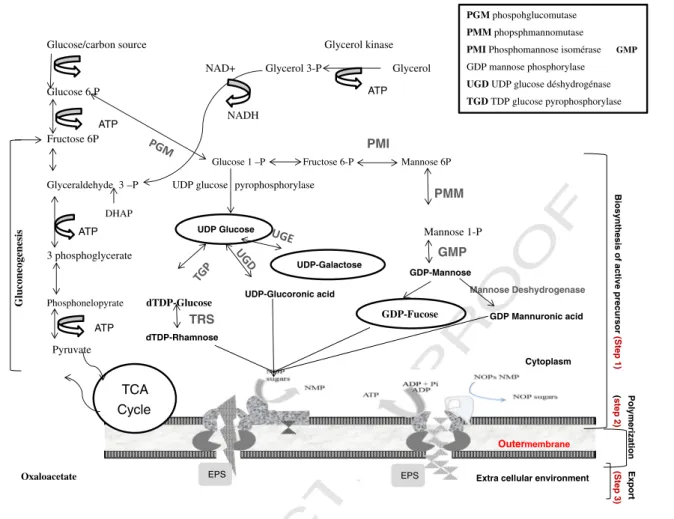
261 The EPS biosynthesis pathway can be divided into three 262 major steps: (i) synthesis of precursor substrate, (ii) polymer-263 ization and cytoplasmic membrane transfer and (iii) export 264 through the outer membrane (Fig. 1). These three steps vary 265 with carbon source used, from one microorganism to the 266 other and specifically depends on polymers classes.
267 2.1. Synthesis of precursor substrate
268 These steps involved in the conversion of intermediate sugar 269 metabolites into the EPS precursor, such as nucleoside diphos-270 phate sugars (for example Guanosine diphosphate (GDP)-sugar) 271 corresponding to substrate or carbon source assimilated. Sugar 272 nucleosides (nucleoside diphosphate sugars) provide an active 273 form of the monosaccharides and also provide the bacterial cell 274 with a means of interconversion of various monosaccharides 275 through epimerization, dehydrogenation and decarboxylation 276 reactions.
277 Polymer-specific enzymes are required for biosynthesis of 278 the active polymer precursor, which is the first committed step 279 and has been targeted by metabolic engineers to enhance 280 polymer production and to allow the synthesis of tailor-made 281 polysaccharides. In this context, for each type of polymers 282 (dextran, xanthan, and alginate) specific precursors and specific 283 enzymes were involved in their biosynthesis (Lin and Hassid, 284 1966). For example, uridine diphosphate (UDP)-glucose is the 285 direct precursor of cellulose synthesis by Acetobacter xylinum 286 and pullulan production by Aureobasidium pullulans, using 287 uridine diphosphate glucose (UDPG) pyrophosphorylase and 288 glucosyltransferase activity, respectively (Duan et al., 2008;
289 Yoshinaga et al., 1997). Similarly, every polymer has a dedicated
290 precursor and enzymes which vary from organism to organism.
291 2.2. Polymerization and cytoplasmic membrane transfer
292 The second step in EPS biosynthesis involves the transfer of the
293 precursor nucleoside diphosphate polymerization of the
mono-294 mers to polymer. Monosaccharides activation by the formation
295 of sugar nucleotides complex is followed by sequential addition
296 of the sugars on to an isoprenoid lipid and simultaneous
297 addition of acyl groups. Highly specific sugar transferase
298 enzymes facilitate a transfer of the monosaccharides and
299 acyl groups to isoprenoid lipid acceptors (bactoprenol,
C55-300 isoprenoid lipid) located in the cytoplasmic membrane. The
301 oligosaccharide repeating units with acetyl, pyruvyl and
302 other acyl adornments are then polymerized. After
polymeri-303 zation of the repeating units, the polysaccharide is excreted
304 through the outer cytoplasmic membrane, which might be
305 coordinated via the formation of a multi-protein complex
306 involving cytoplasmic and outer membrane proteins as well
307 as periplasmic proteins.
308 The biosynthetic pathway of xanthan (Fig. 1as an example
309 of polymer biosynthesis) has been explored by (Rosalam and
310 England, 2006). The synthesis of Xanthan starts with the
311 assembly of repeating pentose units (GDP–mannose and UDP–
312 glucoronate). These units are then polymerized by GumE,
313 which is the catalytic subunit of the xanthan polymerase,
314 localized in the cytoplasmic membrane and then produces
315 the macromolecule xanthan (Fig. 1). Once xanthan is
synthe-316 sized, it is exuded into the extracellular environment.
317 In the case of Alginate, this step requires the transfer of the
318 cytosolic precursor GDP-mannuronic acid across the cell
319 membrane and the polymerization of the monomers to
Table 1
t1:1Q1 – Metabolic characteristic of Bacterial polymers and their fermentation conditions.
t1:2 t1:3 t1:4 EPS Polymer localization Precursors Polymerization enzyme Fermentation conditions Microorganisms EPS (g/L) Reference
t1:5 Cellulose Extracellular UDP–d-glucose Cellulose synthase (BcsA) Glucose/fructose pH = 4–5; 30°C; 40 hr Acetobacter xylinum 7–23.9 Hwang et al. (1999)
t1:6 Dextran Extracellular Saccharose Dextransucrase (DsrS)
Sucrose pH = 5.5; 35°C; 100 kPa; 5 days
Leucomostoc sp. 8–17 Santos et al. (2000)
t1:7 Xanthan Extracellular UDP–glucose, GDP–mannose and UDP– glucuronate Xanthan polymerase (GumE) Molasse pH = 7; 28°C; 100 kPa; 24 hr Xanthomonas campestris 50 Kalogiannis et al. (2003)
t1:8 Alginate Extracellular GDP–mannuronic acid Glycosyl-transferase (Alg8) Glycerol + ethanol pH = 5.8–6.5; 28°C; 150 r/min; 48 hr
Pseudomonas sp. 15.2 Hay et al. (2010)
t1:9 Pullulan Extracellular UDP–d-glucose – Sucrose pH = 4–4.5; 30°C; 100 hr
Aureobasidium pullulans
1.3–5 2.5 Jiang (2010)
t1:10 Curdlan Extracellular UDP–glucose Curdlan synthase (CrdS)
Glucose/sucrose pH = 5.5; 22–26°C; 3–4 days
Rhizobium spp. 1–5 Pavlova et al. (2005)
t1:11 Others EPS Glycérol/glucose 6–18
pH = 7; 30°C, 4 days
Enterobacter sp. 6–18 Alves et al. (2010)
t1:12 Sucrose/maltose
pH = 6.8–9.8; 54–87°C
Geobacillus sp. 0.1–14 Kambourova et al. (2009)
t1:13 Sucrose/glucose
pH = 7; 32–37°C
Halomonas sp. 1.6–4.5 Béjar et al. (1998),
UNCORRECTED PR
OOF
320 polymannuronate using Glycosyl-transferase (Alg8) (Figs. 1 321 and 2) (Rehm, 2010).
322 2.3. Export through the outer membrane
323 The final stage of EPS is the secretion from the cytoplasmic 324 membrane. It involves passage across the periplasm, outer 325 membrane and finally excretion into the extracellular environ-326 ment. AlgE is the gene which produces the enzyme involved for 327 Alginate export and GumJ is the gene producing the enzyme 328 responsible for Xanthan excretion (Fig. 2).
329 In EPS synthesis, lipid transporters provide an anchor to the 330 extracellular membrane, which facilitates the precise and 331 orderly formation of the carbohydrate chain proceeded by the 332 transport of the chain through the cell membrane. Polysaccha-333 rides are polymerized on the inner side of the cytoplasmic 334 membrane and then directly exported through the intermediary 335 of a lipid transporter. These transporters are long-chain 336 phosphate esters and isoprenoid alcohols, identical to those 337 described in the biosynthesis of lipopolysaccharides and pepti-338 doglycans (Sutherland, 1999). They play an important role in 339 heteropolysaccharide synthesis, which is combined with the 340 EPS excretion. After excretion, the intervention of an enzyme 341 specific to the EPS may liberate the polymer.Table 1 shows 342 further categorization dividing the polysaccharides into repeat-343 ed unit polymers and non-repeating polymers, presenting their 344 main compounds, precursors and polymerizing enzymes.
345 In conclusion, the three dedicated steps of EPS synthesis
346 requires an array of dedicated genes working in a
much-347 regulated manner. These genes are translated to yield the
348 proteins, which eventually perform the tortuous task of EPS
349 synthesis. Molecular biologist and genetic engineers have
350 targeted these genes and proteins in order to engineer the
351 strains to have EPS of desired quality and quantity. It will be
352 interesting to understand and overlay different molecular
353 engineering approaches in the ambit of overproduction of EPS.
354 355
3. Engineering strategies for bacterial
356
polysaccharides biosynthesis
357 Several studies were performed to genetically engineer the
358 EPS-producing microbes to produce novel polymer variants
359 while improving the production. As presented in the previous
360 section (Section 2), various enzymes are involved in all three Q10
361 stages of the metabolic pathway of EPS biosynthesis.
Gene-362 encoded enzymes regulate the formation of nucleotide sugar
363 metabolite, chain length determination, repeat unit assembly,
364 polymerization and export of polymers (Figs. 1 and 2) (Broadbent
365 et al., 2003).
366 Recently intensive researches have been performed by
367 focusing on the underlying mechanisms behind bacterial
368 exopolysaccharide biosynthesis pathways, on different operons,
369 promoters and the expression of regulatory gene segments. The
Glucose/carbon source Glycerol kinase
NAD+ Glycerol 3-P Glycerol
Glucose 6 P
NADH
Fructose 6P
Glucose 1 –P Fructose 6-P Mannose 6P
Glyceraldehyde 3 –P UDP glucose pyrophosphorylase
Mannose 1-P 3 phosphoglycerate Phosphonelopyrate dTDP-Glucose Pyruvate Oxaloacetate ATP ATP ATP ATP GMP PMI PMM TRS Mannose Deshydrogenase
TCA
Cycle
DHAP UDP-Galactose UDP-Glucoronic acid GDP-Fucose GDP-Mannose dTDP-Rhamnose UDP Glucose GDP Mannuronic acid EPS EPS CytoplasmExtra cellular environment
Outer membrane
Biosynthesis of active precursor
(Step 1) Export (Step 3) Polyme rization ( step 2) Gluconeogenesis PGM phospohglucomutase PMM phopsphmannomutase
PMI Phosphomannose isomérase GMP
GDP mannose phosphorylase
UGD UDP glucose déshydrogénase TGD TDP glucose pyrophosphorylase
UNCORRECTED PR
OOF
370 variability of sugar precursors, protein structure analysis, and 371 new bioinformatics tools provide new avenues to enhance the 372 EPS biosynthesis and understand the principal engineering 373 strategies of EPS formation.
374 One of the primary goals of EPS production engineering is to 375 increase the volumetric productivity of EPS in a very cost 376 effective manner. In this context, we focus on the recent 377 advances in potential engineering strategies for better EPS 378 production.Vorhölter et al. (2008) attempted to increase the 379 pool of sugar nucleotides (EPS precursors) to enhance the 380 carbon flux toward the final polymer yield.Guo et al. (2014) 381 studied xanA gene producing phosphoglucomutase (PGM) and 382 phosphomannomutase (PMM) enzyme, which is involved in the 383 conversion of glucose-6-phosphate to glucose-6-phosphate. 384 They found that xanA is a regulator gene and it has a key role 385 in precursor metabolite overexpression.
386 Researchers (Huang et al., 2013; Schatschneider et al., 2013; 387 Wu et al., 2014) studied Xanthanmonas campestris EPS produc-388 tion in detail and found that it possess a series of 12 genes
389 embedded in tandem. This operon includes seven genes
390 needed for monosaccharide transfer and acylation of lipid 391 intermediate to form the completely acylated repeating unit 392 (Figs. 1 and 2). It has been suggested that alteration in 393 promoters related to this operon can yield higher precursor 394 metabolites (Galindo et al., 2007).
395 Vojnov et al. (1998) studied the gum-protein operon 396 containing gumBCDEFGHIJKLM (Fig. 2) gene fragment. They 397 tested a simple idea of whether inclusion of an additional
398 promoter as upstream gumC may improve xanthan
biosyn-399 thesis. It was found that promoter insertion to upstream of 400 gumC resulted in enhanced yields and overexpression of the 401 transcription of an operon and eventually increased the 402 xanthan biosynthesis from 66 mg cell mass to 119 mg/g cell 403 mass (Vojnov et al., 1998).
404 Schatschneider et al. (2013) studied most sensitive gene
405 segments that significantly affect EPS synthesis. The study
406 demonstrated that the overexpression of gumD is the key
407 enzyme involved in the EPS assembly construction and
408 precursor conversion (Fig. 2). Thus, it was suggested to clone
409 the entire gumD gene cluster of a 16 kb chromosomal
410 fragment with high copy number in X. campestris. The results
411 indicated elevated expression of all biosynthetic eps gene,
412 which could be achieved by cloning them on a high copy
413 number plasmid (Janczarek et al., 2009).
414 In another strategy, the idea was to engineer the EPS
415 molecules at the molecular level for having the desired
416 behavior and material characteristics of the final polymer
417 while improving the property as bioflocculant. For example,
418 this molecular alteration can be deleting substituents or
419 monomeric sugar residue from the side chain.
420 Deactivation of the GT GumI gene resulted in a truncated
421 tetramer xanthan version, as a consequence of deletion of the
422 terminal mannose, it was found to have much lower viscosity.
423 Similarly, inactivation of GumK (a GT) causes the removal of
424 glucuronic acid side chains which resulted in an enhanced
425 viscosity of the EPS as compared to wild type EPS (Hassler and
426 Doherty, 1990). The gene deactivation is performed by
homol-427 ogous insertion of foreign genes within the operon segment at
428 active gene locus (GT GumI and GT GumK). They have reported
429 that transgenes can suppress their expression and that of
430 endogenous homologous genes. This phenomenon has been
431 called co-suppression (Hassler and Doherty, 1990).
432 Many efforts were done in engineering the degree of
433 acetylation and pyruvylation of various polymers (alginate and
434 xanthan), to control their rheological properties (Donati and
435 Paoletti, 2009). The level of O-acetylation and pyruvylation can
436 be controlled reasonably well using specific strains/mutants or
437 altering the growth media and controlling cultivation conditions Fig. 2– Model of alginate and xanthan biosynthesis and secretion mechanisms.
UNCORRECTED PR
OOF
438 such as aeration, pH and temperature (Gaytán et al., 2012; Peña439 et al., 2006).
440 Interesting insights were given byRehm (2010)andGalván 441 et al. (2013) regarding the general structure and functional 442 relationships. The extent of acetylation and pyruvylation has 443 antagonistic effects on viscosity. The GumL enzyme incorpo-444 rates pyruvyl residues to the external β-mannose residues, 445 while the acetyl residues are incorporated into internal 446 α-mannose units by GumF, and external β-mannose by GumG 447 (Becker et al., 1998). A high degree of pyruvylation by increasing 448 the transcription of gumL (cloning an additional promoter 449 upstream gumL) resulted in higher viscosity, whereas more 450 acetyl group decreased the viscosity of the resulting EPS (Gaytán 451 et al., 2012; Rehm, 2015).
452 Taxonomically different microbes can produce the same
453 types of extracellular compounds with different concentra-454 tions. P. aeruginosa and A. vinelandii, despite having most of the 455 genes involved in the biosynthesis, their organization, regu-456 lations and genetic switch clusters identical have differences 457 at transcriptional and functional level expression of EPS. In 458 P. aeruginosa and A. vinelandii a cluster of 13 structural and five 459 regulatory genes (Hay et al., 2010) involved in EPS biosynthesis 460 (Fig. 2). In P. aeruginosa the transcriptome is regulated by algR, 461 algB, algC and algD gene segment that are algT dependent 462 whereas in A. vinelandii, these genes were independent of 463 algT. The regulator gene algT encodes for the regulatory 464 expressions of sigma factor (σ22
) which could explain the 465 variation in alginate concentration (Ahmed, 2007).
466 Though literature exists for genomic and proteomic level 467 engineering to overproduce classical biopolymers, recombi-468 nant molecular engineering techniques are near to inexistent 469 for EPS over production. Molecular techniques can be applied 470 for transcriptional overexpression of RNAs involved in bio-471 synthetic pathways, translational overexpression of the 472 proteome involved in EPS biosynthesis. The most generic 473 approach is an in-frame insertion of a strong promoter 474 upstream of EPS operon to have more than basal level of 475 constitutive or inductive expression of genome and proteome 476 level. Overexpression of EPS can be induced when the carbon 477 flux channeling is streamed favorably toward the generation 478 of precursor molecules like nucleotide diphosphate-Glucose 479 conjugates by gene silencing, which divert carbon flux away 480 from EPS synthesis without compromising the survival of the 481 organism. Similarly, overexpressing enzymes involved in 482 irreversible synthesis is a key mechanism and can be used 483 as control points to induce diversion of this excess carbon 484 pool toward EPS biosynthesis.
485 Bacteria produce a wide range of exopolysaccharides, which 486 are synthesized via different biosynthesis pathways. A better 487 understanding of basic biochemistry and genetics involved in 488 exopolysaccharides biosynthesis and the regulatory mecha-489 nisms is critical for protein engineering approaches to produce 490 novel polymers. At large scale production process having highly 491 efficient downstream extraction is as important as enhancing 492 the upstream process. Choice of downstream extraction meth-493 od should be made diligently to obtain the maximum product 494 yield without hindering its natural properties. In the following 495 sections, the impact of various operational process parameters
496 and downstream extraction process on EPS quantity and
497 quality was discussed.
498 499
4. EPS production methodology
500 4.1. EPS extracted directly from sludge
501 EPS has been successfully extracted directly from sludge by
502 Urbain et al. (1993). They indicated that the EPS proteins
503 extracted directly by ultra-sonication from municipal
waste-504 water sludge were higher (97.8 mg/gVSS) as compared to
505 15.6 mg/g VSS of carbohydrate content. Liu and Fang (2002)
506 efficiently performed EPS extraction from acidogenic and
507 methanogenic sludge. The results revealed that carbohydrate
508 was a major component in acidogenic sludge (62% w/w of
509 EPS), while protein was a powerful component in
methano-510 genic sludge (41% w/w of EPS).
511 Further, researchers (Peng et al., 2012; Sponza, 2003)
512 examined the EPS extracted directly from activated sludge
513 treating various types of wastewaters. They found that the
514 protein content of EPS is higher in the sludge treating winery
515 and municipal wastewater than that of sludge produced in
516 treating pulp-paper, textile and petrochemical wastewaters.
517 Thus the EPS concentration varied accordingly to the type of
518 wastewater treated in WWTPs.Simon et al. (2009), reported
519 that the nucleic acid content of EPS could be affected by the
520 type of sludge from different municipal WWTP. High nucleic
521 acid (7 mg/g EPS DW) concentration was observed in Eerbeek
522 municipal WWTP sludge as compared to 4 and 1 mg/g EPS DW
523 in Emmtec and Revico WWTP, respectively.
524 4.2. EPS production using pure carbon sources
525 Although some researchers are convinced that the nature of
526 the substrate cannot influence the composition of the EPS
527 produced, however, many others have stated that medium
528 composition either carbon source or nitrogen sources are
529 important parameters in EPS biosynthesis and production
530 (Simon et al., 2009).
531 Li and Yang (2007)reported that the activated sludge fed
532 with glucose exhibited more EPS concentration than that fed
533 with acetate. On the contrary,Ye et al. (2011)revealed that
534 sludge fed with acetate was more favorable for high EPS
535 production than that fed with glucose. Their results were also
536 studied recently by (Geyik et al., 2016), which explained how
537 the type of organic substrate in a wastewater affects the
538 production and composition of EPS. The activated sludge
539 reactors were operated with three different feeds composed of
540 various organic compounds, first of peptone, glucose, and
541 acetate; then the second feed was only using only peptone
542 and third feed with only glucose. They proved that the type of
543 substrate affected the relative proportion of protein and
544 polysaccharide content of EPS.
545 The effect of substrate and its suitability depends on upon
546 the organisms. Different bacteria may produce different
547 bioflocculants in composition and structure. For example,
548 Bacillus licheniformis (Shih et al., 2001) and Nocardia amarae
549 (Takeda et al., 1992) produce protein bioflocculants whereas
550 Bacillus subtilis (Yokoi et al., 1995) produce polysaccharide
551 bioflocculant, and glycoproteins were produced by Arcuadendron
552 sp. and Arathrobacter sp. (Wang et al., 1995).Van Geel-Schutten
553 et al. (1998) reported that the Lactobacillus strains produce
UNCORRECTED PR
OOF
554 varying amounts of EPS with different sugar compositions555 when they are grown on sucrose, raffinose and lactose as a 556 carbon source. The EPS produced by Lactobacillus casei with 557 glucose as carbon source was reported to be different from that 558 produced on lactose (Pham et al., 2000).Vijayendra et al. (2003) 559 investigated the effect of different hexose sugars (glucose, 560 sucrose and lactose) on EPS production by Agrobacterium, 561 Alcaligenes, Pseudomonas and Xanthomonas. Lactose was found 562 to be the best carbon source for EPS production by Pseudomonas 563 sp. whereas other bacterial strains favored sucrose.
564 Yuksekdag and Aslim (2008)studied the impact of various 565 carbon sources on EPS production by L. delbrueckii, Lactobacillus 566 bulgaricus and Streptococcus thermophiles. For all the strains,
567 glucose was the most efficient carbon source and EPS
568 concentration of 211 mg/L produced by L. delbrueckii sub sp. 569 was the highest concentration. The effect of carbon source 570 on EPS synthesis by the marine bacterium Saccharophagus 571 degradans was also studied byGonzález-García et al. (2015). 572 S. degradans was able to grow in the mineral medium while 573 producing EPS concentration depending on the carbon source: 574 with glucose or starch, EPS 1.5 g/L; with galactose, sucrose, or 575 xylose, EPS 0.7 g/L and with fructose, EPS 0.3 g/L. The results 576 were in agreement with the recent studies (Qin et al., 2015; 577Q11 Mane and Hamde, 2015). Lactose gave the maximum EPS 578 concentration of 6.9 g/L as compared to 0.9 g/L when glucose 579 was used (Qin et al., 2015). According to Mane and Hamde 580 (2015), glucose gave maximum EPS concentration of 750 mg/L 581 as compared to other substrates (lactose 390 mg/L; sucrose 582 670 mg/L) used.
583 Modification in feed media affects the sugar composition 584 of EPS produced. The EPS composition characterized by 61.7% 585 of galactose and 33% of glucose and 5.3% of mannose was 586 produced by L. bulgaricus using milk as media. However, 39.7% 587 of galactose, 57.9% of glucose and 1.8% of mannose of total 588 carbohydrate composition was found when the glucose was 589 used as a carbon source (Petry et al., 2000).
590 In another case, the biosynthesis of extracellular polysac-591 charides in A. xylinum was improved by using galactose and 592 xylose as carbon source compared to fructose, sucrose and 593 starch in the medium (Sutherland, 2001). Recently, EPS from 594 Pseudomonas fluorescens was produced using different concen-595 trations of sucrose and sugarcane molasses as the carbon 596 substrates (Razack et al., 2013). Maximum EPS concentration 597 of 2843 mg/L was obtained at 5% (w/v) sugarcane molasses
598 concentration in the media. The sugarcane molasses as
599 carbon source gave a higher EPS concentration than sucrose 600 with 1389 mg/L of EPS concentration (Razack et al., 2013). 601 It has been observed that selection of microbial source and 602 growth substrates type, concentration and composition have 603 a significant effect on EPS yield.
604 4.3. Use of sludge as nutrient source for EPS production 605 Recently EPS production using sterilized sludge as nutrient 606 and carbon source using pure bacterial strain isolated from 607 wastewater sludge have been reported bySubramanian et al. 608 (2010) and More et al. (2012). They indicated that different 609 pre-treatments (heat, alkaline and acidic treatment) of sludge 610 could vary the EPS production of pure cultures.More et al. 611 (2014) also used a consortium of pure bacterial strains to
612 improve the EPS production.Nouha et al. (2016)studied the
613 sterilized sludge as a culture media using Cloacibacterium
614 normanense for EPS production, and the sterilized sludge
615 inoculated with pure culture also fed with crude glycerol as
616 extra carbon source. High EPS concentration up to 13.3 g/L
617 was recorded using only sludge as a growth medium, and
618 21.3 g/L of EPS was produced when the medium was
619 supplemented with 20 g/L of crude glycerol.
620 In addition to the carbon source, the extraction methods
621 can also influence the EPS yield, chemical structure,
molecu-622 lar weight and their role as bioflocculant in wastewater
623 treatment. Furthermore, the EPS produced by varying
differ-624 ent optimized operating conditions has a different
composi-625 tion. Consequently, appropriate methods of extraction should
626 be chosen to obtain desired EPS properties, which are required
627 for specific applications. For this reason, different
character-628 istics of EPS must be considered, including identification of
629 the component monosaccharides and their relative
propor-630 tions and the physicochemical properties of the final EPS.
631 632
5. EPS extraction
633 Several methods (centrifugation, sonication, heating, EDTA and
634 CER) have been applied in different studies to extract EPS from
635 pure cultures or undefined mixed cultures, mainly related to
636 activated sludge and biofilms. The EPS extraction methods
637 include various physical, chemical methods or their
combina-638 tions. The extraction procedure must be selected considering
639 the efficiency of the method to extract EPS in high yield. The
640 best extraction method should not disturb the interactions that
641 keep the EPS components together in the matrix.
642 5.1. Physical methods
643 Many physical methods have been tested to evaluate their
644 extraction efficiencies and compare them to select the best
645 technique of extraction. Comte et al. (2006b) studied three
646 extraction techniques (centrifugation, sonication and heating).
647 EPS was extracted with very high efficiencies by using heating
648 method (82 mg/g VSS). High extraction of protein and
polysac-649 charides content was obtained with a heating method as
650 compared to others physical methods used (centrifugation
651 and sonication). These results were in agreement withTapia
652 et al. (2009)studies. The concentration and composition of EPS
653 extracted by heating (813 mg/g DW) were higher to that
654 obtained by centrifugation (735 mg/g DW) method.Pan et al.
655 (2010)compared two physical extraction methods
(centrifuga-656 tion and ultra-sonication). They also observed that protein
657 content was low in EPS samples prepared by centrifugation, as
658 compared to the protein content in EPS sample extracted by
659 ultra-sonication.
660 In this context, each researcher explored the reason for the
661 variation in extraction efficiency while employing different
662 EPS extraction methods, such as the physical methods.Comte
663 et al. (2006b)proposed a hypothesis to explain these variations
664 in results, that the proteins and polysaccharide moieties of EPS
665 could be hydrolyzed during the extraction procedure by
666 heating. According toTapia et al. (2009)the heating extraction
667 procedure allowed to extract the strongly bound EPS to flocs.
UNCORRECTED PR
OOF
668 However, some studies (Frolund et al., 1995; Liu and Fang,669 2002) proposed that the high EPS extraction efficiency by the 670 heating method may be caused by significant cell lysis and 671 disruption, which may reveal results into high protein content 672 in EPS.
673 5.2. Chemical methods
674 As per literature, many methods have been proposed and 675 applied to extract EPS from pure or undefined mixed cultures. 676 The extraction efficiencies of chemical methods, such as cation 677 exchange resin (CER), EDTA (Ethylene diamine tetra-acetic Acid) 678 and NaOH methods have been studied (Frolund et al., 1995; Liu 679 and Fang, 2002; Sheng et al., 2005).
680 Cation exchange resin along with a high concentration of 681 NaCl has been used for the extraction of adhesive exopolymers 682 from Pseudomonas putida and P. fluorescens (Christensen and 683 Characklis, 1990). The CER method has become the most widely 684 accepted EPS extraction method, largely because the resin used 685 for selective extraction of EPS can be removed and recycled 686 easily.
687 A recent study (Zuriaga-Agusti et al., 2010) used CER and 688 Triton X-100 as efficient EPS extraction methods to extract EPS 689 from two different municipal MBRs. The protein and carbo-690 hydrate content was determined. This study was performed 691 to understand the problem of membrane fouling of the MBR 692 process due to EPS. Although EPS has effect fouling, it is not 693 clear which EPS fraction (SMP or EPS) or component (proteins 694 or carbohydrates) exert the most important contribution to 695 membrane fouling. To elucidate the solution, activated sludge
696 samples from two municipal MBRs were processed for
697 extraction protocols comparison. They demonstrated that 698 the proteins and carbohydrate content using Triton X-100 699 extraction method was higher (81.64 ± 12.98 mg BSA/g VSS 700 and 10.30 ± 1.42 mg Glucose/g VSS, respectively) than cation 701 exchange resin method (16.49 ± 9.37 mg/g VSS and 3.93 ± 702 2.47 mg/g VSS, respectively). They observed that CER protocol 703 achieved lower extraction efficiency for the EPS than Triton 704 X-100. The different values obtained between CER and Triton 705 X-100 could be attributed to the floc composition. In fact, 706 some researchers (Liu et al., 2010; Yu et al., 2009) asserted that 707 the presence of two types of polymers in sludge flocs. One 708 type of EPS is tightly bound within micro colonies of cells, and 709 another is loosely bound in the floc matrix or at outer 710 peripheries of the flocs. In this way, results may point that 711 CER protocol withdraws mostly loosely bound EPS, whereas 712 Triton X-100 extracts both types of EPS. The study ofMeng 713 et al. (2010)found that the EPS extracted by CER protocol was 714 low comparing to Triton X-100.
715 Comparative study of chemical extraction methods has
716 been exhaustively investigated.Tapia et al. (2009)conducted a
717 comparative study of chemical and physical methods to
718 understand the principal role of the different extraction 719 methods on EPS composition and concentration. The concen-720 tration of EPS from bacterial culture of Acidiphilium sp. was 721 higher when extracted by centrifugation (600 mg carbohy-722 drate/g DW, 220 mg protein/g DW, 820 mg EPS/g DW) than
723 extracted with NaOH (430 mg carbohydrate/g DW, 170 mg
724 protein/g DW, 650 mg EPS/g DW). However, in the study of 725 Sheng et al. (2005)the concentration of EPS extracted by NaOH
726 was higher 159.2 mg/g-DW in comparison to centrifugation
727 and ion exchange resin (Table 2). These results have also been
728 confirmed by using more complex microbial consortia such as
729 activated sludge (Table 2). Liu and Fang (2002) reported
730 extractions of EPS ranging between 25.7 mg EPS/g volatile
731 suspended solids (VSS) by centrifugation and 164.9 mg EPS/
732 g-VSS by chemical methods (NaOH and formaldehyde). A
733 significant difference (> 60%) of EPS extracted was observed
734 between the two methods when EPS was extracted from the
735 same culture. However, it appears that the chemical
extrac-736 tion becomes more effective when it is combined with
737 physical methods. Liu and Fang (2002) investigated high
738 proteins, carbohydrates, humic acid and DNA content
ex-739 tracted by combined methods of formaldehyde and
ultra-740 sonication compared to that obtained by only formaldehyde.
741 Comte et al. (2006a) also proved that sonication and CER as
742 combined EPS extraction method were more effective to
743 extract high proteins, carbohydrate and nucleic acid content
744 comparing to CER or sonication alone.
745 5.3. Chemical methodsvs physical methods
746 The type of EPS extraction method further influences its
747 composition, nucleic acid content, protein content, and various
748 functional properties. Comte et al. (2006a) investigated the
749 effect of extraction methods from two different sludge on EPS
750 composition. This study demonstrated that the protein content
751 was higher (343–337 mg proteins/g EPS DW) with physical
752 method (sonication), whereas low protein content was
ob-753 served, 73–107 mg proteins/g EPS DW, with chemical extraction
754 methods (Glutaraldehyde, Formaldehyde and NaOH).
755 Liu and Fang (2002) and Comte et al. (2006a)indicated a
756 constant nucleic acid content of EPS using different physical
757 extraction methods (Cation-exchange resin, centrifugation,
758 sonication and heating). This study indicated that the physical
759 methods resulted in lower extent of cell lysis than chemical
760 extraction methods.
761 Further, Simon et al., 2009 have found the humic
sub-762 stances content in EPS was different using different extraction
763 methods (CER, centrifugation and heating). The highest
764 humic acid concentration was 224 mg/g DW when heating
765 was used as extraction method in case of anaerobic granular
766 sludge obtained from Eerbeek municipal WWTP. However, the
767 lowest humic content was 5 mg/g DW in the case of anaerobic
768 granular sludge from Revico municipal WWTP by applying
769 centrifugation as an extraction method.
770 In case of metal absorption Cd2+sorption capacity of EPS
771 extracted using sonication was 245 ± 46μmol/g of EPS for
772 Chau's model and 336 ± 22μmol/g of EPS for Rezic's model.
773 Although the metal binding capacity of sludge EPS extracted
774 by physical methods was consistently identical (except by
775 heating); however, the metal complexation capacity was
776 significantly improved when EPS was extracted by chemical
777 methods (Comte et al., 2006b).
778 Moreover, the effect of EPS extraction method from
779 activated sludge on metal binding ability was evaluated
780 (Comte et al., 2006b), EPS extracted by physical and chemical
781 methods showed a greater affinity for Pb ions than Cd ions.
782 The EPS extracted by a physical method (sonication) had a
783 Pb2+ adsorption capacity of 2135 ± 55μmol/g of EPS and
UNCORRECTED PR
OOF
784 2184 ± 27μmol/g of EPS as analyzed using two adsorption 785 models, Chau and Rezic, respectively.
786 Recently, many other factors such as variation of pH,
787 temperature and mixing speed have been reported to affect 788 the structure of EPS, and its metal removal efficiency 789 (AjayKumar et al., 2009; Ruan et al., 2013).
790 5.4. Combination of different methods
791 According toD'Abzac et al. (2010), a combination of formalde-792 hyde and heating leads to the highest EPS quantity extracted. 793 Humic-like substances and the nucleic acids are more readily
794 extracted using formaldehyde method than the heating
795 method alone. By using a combination of sonication and CER 796 methods the protein and polysaccharide contents were found 797 to be higher than obtained by only sonication or CER.
798 As discussed earlier, principally physical methods are 799 simply mechanical which can explain the low extraction yield 800 and it has been a common observation that the chemical
801 methods were always having higher yields than physical
802 methods. Only handful of methods has been thoroughly
803 evaluated and optimized to obtain high extraction efficiencies
804 without cell lysis and reagent contamination. Most of the
805 chemical extraction methods cause various problems either in
806 the extraction or EPS analysis. For instance, in the case of alkali
807 extraction methods, an addition of NaOH causes anionic
808 groups, such as carboxylic groups in proteins and
polysaccha-809 rides to lose their protons. The deprotonation causes a strong
810 repulsion between EPS molecules within the EPS gel and
811 provides a higher water solubility of the compounds. Similarly
812 the EDTA method has high extraction efficiency, however,
813 causes a high degree of cell lysis and possibly also
contamina-814 tion with cellular macromolecules interfering in the protein
815 determination (Comte et al., 2006a).
816 Each and every method has their advantages and
disadvan-817 tages (Table 3). Although the physical methods cause less cell
818 lysis, it also has low EPS extraction efficiency. The chemical
819 methods generated high protein content, and these proteins
Table 2
t2:1 – Comparison of total EPS (carbohydrate and protein) extracted from various cultures and extraction methods.
t2:2 t2:3
t2:4 Pure culture Extraction
methods EPS composition (mg/g DW) EPS concentration (mg/g- DW) Prot./carb. ratio References
t2:5 Prot. Carbo. HA DNA
t2:6 Rhodopseudomonas acidophilap 4.1 6.2 – – 12.9 1.5 Sheng et al. (2005)
t2:7 6.5 58.5 – – 70.3 9.0
t2:8 Centrifugation 7.7 126.5 – – 159.2 16.4
t2:9 EDTA 10.3 37.3 −00 – 71.6 3.7
t2:10 NaOH
t2:11 Heating
t2:12 Acidiphilium sp. 600 220 – – 820 0.3 Tapia et al. (2009)
t2:13 550 200 – – 750 0.3
t2:14 430 170 – – 600 0.4
t2:15 570 200 – – 770 0.4
t2:16 Mixte culture Liu and Fang (2002)
t2:17 Aerobic 54.6 40.5 50.4 0.3 165 0.2 t2:18 17.7 12.7 16.4 0.1 109 0.1 t2:19 22.9 12.4 59.2 0.4 146 0.1 t2:20 Formal + NaOH 20.4 28.8 18.9 0.1 78 0.1 t2:21 CER t2:22 EDTA
t2:23 Acidogenic Formal + ultrasound 110.9 25.8 0.1 15.1 179 4.3
t2:24 38.7 6.2 0.1 3.0 58 6.2 t2:25 41.7 6.5 0.2 15.9 105 4.6 t2:26 71.6 10.8 5.0 0.05 100 6.6 t2:27 Mutagenic sludge t2:28 19.1 42.1 23.3 0.19 102 2.2 t2:29 7.9 10.6 5.5 0.05 30 1.3 t2:30 6.8 12.0 24.3 1.20 73 1.7 t2:31 12.0 13.1 5.6 0.04 30 1.1
t2:32 Activated sludge Zuriaga-Agusti et al. (2010)
Comte et al. (2006a)
t2:33 Sonication 140 343 62 46 200 2.4
t2:34 Heating 166 378 126 17 369 2.3
t2:35 CER 16 4 – – 24 4.2
t2:36 Triton X 100 81 10 – – 100 7.9
t2:37 Biofilm Centrifugation 57.0 – – – 57 – Pan et al. (2010)
t2:38 Ultrasonication 22.3 56.6 – – 79 0.4
t2:39 EDTA 1.7 3.2 – – 45 0.5
t2:40 Formaldehyde 8.0 25.2 – – 33 0.3
t2:41 Formal + NaOH 17.0 13.3 – – 30 1.3
t2:42 Prot: Protein; Carb: Carbohydrate. t2:43
UNCORRECTED PR
OOF
820 can be originated from extracellular enzymes and or intracel-821 lular materials contaminations. A combination of two methods 822 could affect the production cost and the efficiency of EPS 823 extraction during an industrial application (Domínguez et al., 824 2010). There is no simple and single method that exists to 825 extract 100% of total or complete EPS components from the 826 microbial cell or activated sludge flocs. Each technique extrac-827 tion efficiency depends on many factors mainly the origin of 828 EPS. It is recommended that extraction is only performed after 829 running a comparative study of various methods to select the 830 best one for desired application. Furthermore, an extraction 831 technique must be chosen and optimized for each case, taking 832 into account many parameters (such as extraction time, cost 833 and dosage of chemical used and evaluation of cell lysis), which 834 could affect the cost and the properties of EPS.
835 5.5. Effect of extraction methods on functional group and
836 molecular weight of EPS
837 The complex composition of EPS makes it difficult to analyze
838 the conformation, chemical structure (their functional groups)
839 and distribution of EPS. However, progress in analytical
840 chemistry has led to the development of new instruments and
841 techniques for characterization of EPS, which has generated a
842 significant amount of information on the structural and
843 functional properties of EPS as well as their molecular weight.
844 Chromatography, mass spectrometry and their combination
845 have been used to qualitatively and quantitatively analyze the
846 EPS composition (Dignac et al., 1998).
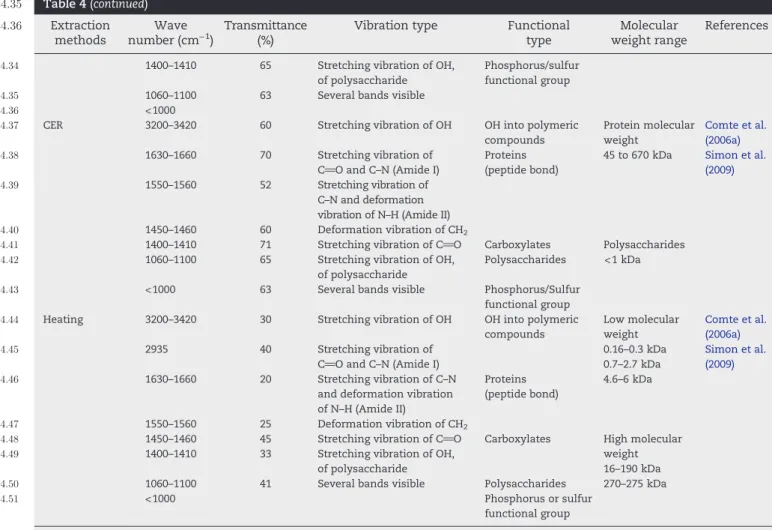
847 Many researchers (Sheng and Yu, 2006; Tapia et al., 2009)
848 proved the effect of the extraction methods applied on structural
Table 3
t3:1 – Advantages and disadvantages of different extraction method used.
t3:2 t3:3
t3:4 Extraction methods Mechanism and Extraction
conditions
Limitation Advantages References
t3:5 Physical Centrifugation EPS separates from cell surface and dissolve to solution under the centrifugal force
(−) Low extraction efficiency (+) Simple method Liu and Fang (2002)
Q2 t3:6 (−) Bound EPS cannot be
extracted.
(+) No cell lysis
t3:7 • 20,000/600 g in 20 min (−) Depend of shear rate (+) No chemical
addition
Comte et al. (2006a)
t3:8 Heating Accelerates the EPS
solubilization
(−) Cells disruption (+) Extraction of bound EPS
Frolund et al. (1995)
Q3
t3:9 • 80°C, 1 hr (−) Denaturation of EPS
t3:10 Ultra-sonication Act of applying sound
energy or mechanic pressure to agitate particles in a sample
(−) High cell lysis in less time (+) Dissociation of aggregates Comte et al. (2006a, 2006b) Q4
t3:11 • 40 W, 0–30 min (−) High energy (+) Break the hydrogen
bound
t3:12 Chemical CER Removes the divalent
cations, causing the EPS to fall apart
(−) Extract only the proteins and carbohydrates coupled to cations
(+) Avoid EPS pollution by chemical reagent
Liu and Fang (2002)
t3:13 • 70 g resin/g MVS,
600 r/min, 1 hr
t3:14 EDTA Remove the multivalent
cations forming the bond between the charged compounds of EPS.
(−) EPS contamination by intracellular compounds
(+) No modification of EPS structure
Liu and Fang (2002)
t3:15 (−) Interfere the proteins
analysis Comte et al. (2006a) t3:16 150 mL of 2% EDTA added for 3 hr at 4°C (−) Cost of chemical
t3:17 NaOH Ionization of carboxylic
group
(−) Severe disruption in EPS composition
(+) Break the covalent disulfide binding in glycoproteins
Liu and Fang (2002)
t3:18 • 1N of NaOH, 3 hr at
4°C
(−) high damage of cell Comte et al.
(2006a)
t3:19
(−) Many charged groups results repulsion between the EPS
t3:20 (−) Alkaline hydrolysis
of many polymers may take place
t3:21 Formaldehyde Fix the cell and denature
the EPS, linking the proteins and carbohydrate
(−) Modify EPS characteristics (+) Prevent the cell lysis
Liu and Fang (2002)
t3:22 (−) Interferences in
carbohydrates content Comte et al.
(2006a)
t3:23 • 36%, 1 hr, 4°C (−) Cost of chemical reagents
t3:24 Combined chemical and physical methods
NaOH-Heating – (−) Extraction time (+) High Extraction
efficiency
D'Abzac et al. (2010)
t3:25 CER-centrifugation (−) EPS need purification
t3:26
Formaldehyde-sonication
UNCORRECTED PR
OOF
Table 4
t4:1 – Effect of extraction method on functional groups of EPS.
t4:2 t4:3 t4:4 Extraction methods Wave number (cm−1) Transmittance (%)
Vibration type Functional
type
Molecular weight range
References
t4:5 EDTA 1550–1600 50 Stretching vibration of
C_O Proteins
Proteins (peptide bond)
8 kDa Comte et al.
(2006a) t4:6 1300 55 C\N stretching 150–200 kDa 5 kDa Simon et al. (2009) t4:7 NaOH + Formaldehyde
2450 60 Specific band corresponding
to a product of a formaldehyde and EPS
Carboxylic acids – Comte et al.
(2006a)
t4:8 1750 40 Stretching vibration of C_O
Stretching vibration of C_O
t4:9 1400 10 Several bands visible Carboxylates
t4:10 800 30 Phosphorus/Sulfur
functional group
t4:11 Gluraldehyde 1950 75 Specific band corresponding
to a product of a glutaraldehyde and EPS reaction
– – Comte et al. (2006a)
t4:12 1500 70
t4:13 Centrifugation 3200–3420 80 Stretching vibration of OH OH into polymeric compounds Low molecular weight Comte et al. (2006a) Simon et al. (2009) t4:14 2935 85 Stretching vibration of C_O and C–N (Amide I) 0.16–0.3 kDa t4:15 1630–1660 73 Stretching vibration of C\N
and deformation vibration of N\H (Amide II)
Proteins (peptide bond)
0.7–2.7 kDa
t4:16 1550–1560 83 Deformation vibration of CH2
Stretching vibration of C_O Stretching vibration of OH, of polysaccharide
4.6–6 kDa
t4:17 1450–1460 82 Several bands visible Carboxylates High molecular
weight
t4:18 1400–1410 85 Polysaccharides 16–190 kDa
t4:19 1060–1100 75 270–275 kDa
t4:20 <1000 Phosphor/Sulfur
functional group t4:21 Sonication 3200–3420 60 Stretching vibration of OH OH into polymeric
compounds Low molecular weight Comte et al. (2006a) t4:22 2935 70 Stretching vibration of C_O and C–N (Amide I)
0.16–0.3 kDa Simon et al. (2009)
t4:23 1630–1660 52 Stretching vibration of C–N
and deformation vibration of N–H (Amide II)
Proteins (peptide bond)
0.7–2.7 kDa
t4:24 1550–1560 60 Deformation vibration of CH2
Stretching vibration of C_O Stretching vibration of OH, of polysaccharide
4.6–6 kDa
t4:25 1450–1460 71 Several bands visible Carboxylates High molecular
weight t4:26 1400–1410 65 Polysaccharides 16–190 kDa t4:27 1060–1100 63 270–275 kDa t4:28 <1000 Phosphorus or Sulfur functional group t4:29 Sonication + resin
3200–3420 60 Stretching vibration of OH OH into polymeric compounds Low molecular weight 0.16–0.3 kDa 0.7–2.7 kDa 4.6–6 kDa Comte et al. (2006a) t4:30 2855 70 Stretching vibration of C_O and C–N (Amide I)
Proteins Simon et al.
(2009)
t4:31 1630–1660 52 Stretching vibration of C–N
and deformation vibration of N–H (Amide II)
(peptide bond)
t4:32 1550–1560 60 Deformation vibration of CH2 Carboxylates
t4:33 1450–1460 71 Stretching vibration of C_O Polysaccharides High molecular
weight 16–190 kDa 270–275 kDa
UNCORRECTED PR
OOF
849 properties of EPS and their molecular weight (Table 4). Fourier 850 transform infrared spectroscopy (FTIR) was mostly used to 851 identify the functional group of extracted EPS (Omoike and 852 Chorover, 2004; Sheng and Yu, 2006). However, quantitatively 853 this aspect has never been reviewed.Tapia et al. (2009)compared 854 two FTIR spectra of EPS obtained from EDTA and centrifugation 855 method. Significant peaks were visible in both the spectra 856 corresponding to hydroxyl, carbonyl and peptide group bonding. 857 However, the spectrum of EPS extracted with EDTA shows 858 specific bands in the fingerprint region, especially the thick band 859 at 1717 cm−1. This band corresponds to the C_O asymmetric 860 stretching vibration of carboxylic acids of EDTA. It has been a 861 general observation by many studies that during extraction with 862 a chemical method the final EPS gets contaminated by the 863 chemical reagent (Comte et al., 2006a). Similar contaminations
864 were observed in other methods like NaOH-formaldehyde
865 (Comte et al., 2006a; Pervaiz and Sain, 2012; Sheng et al., 2005). 866 In another analysis done by Lee et al. (2013), it was 867 demonstrated that the FT-IR results of CER extracted EPS 868 contained lower content of protein to carbohydrate, fewer 869 acidic functional groups (i.e., COOH or OH groups) as compared
870 to formaldehyde-NaOH technique. The same results were
871 recorded for the EPS extracted from anaerobic granular sludge 872 with physical methods which displayed very similar IR spectra
873 (D'Abzac et al., 2010). Humic-like substances were hardly
874 identifiable in physical extraction techniques and adsorption
875 bands were intensively present at 2930 and 1650 cm−1.
876 The molecular weight range of EPS varies from 103to 2.5 × 10⁶
877 kDa (Yokoi et al., 1995). The molecular weight of the EPS reported
878 in different studies has been presented inTable 5. To determine
879 molecular weight, size exclusion chromatography (SEC) was
880 frequently used in many studies (Simon et al., 2009; Comte et al.,
881 2006a). These researchers investigated differences appeared in
882 the peak corresponding to the biggest and lowest molecules. t4:35 Table 4 (continued) t4:36 Extraction methods Wave number (cm−1) Transmittance (%)
Vibration type Functional
type
Molecular weight range
References
t4:34 1400–1410 65 Stretching vibration of OH,
of polysaccharide
Phosphorus/sulfur functional group
t4:35 1060–1100 63 Several bands visible
t4:36 <1000
t4:37 CER 3200–3420 60 Stretching vibration of OH OH into polymeric
compounds Protein molecular weight 45 to 670 kDa Comte et al. (2006a) Simon et al. (2009) t4:38 1630–1660 70 Stretching vibration of C_O and C–N (Amide I) Proteins (peptide bond) t4:39 1550–1560 52 Stretching vibration of C–N and deformation vibration of N–H (Amide II)
t4:40 1450–1460 60 Deformation vibration of CH2
t4:41 1400–1410 71 Stretching vibration of C_O Carboxylates Polysaccharides
<1 kDa
t4:42 1060–1100 65 Stretching vibration of OH,
of polysaccharide
Polysaccharides
t4:43 <1000 63 Several bands visible Phosphorus/Sulfur
functional group
t4:44 Heating 3200–3420 30 Stretching vibration of OH OH into polymeric
compounds Low molecular weight 0.16–0.3 kDa 0.7–2.7 kDa 4.6–6 kDa Comte et al. (2006a) Simon et al. (2009) t4:45 2935 40 Stretching vibration of
C_O and C–N (Amide I)
t4:46 1630–1660 20 Stretching vibration of C–N
and deformation vibration of N–H (Amide II)
Proteins (peptide bond)
t4:47 1550–1560 25 Deformation vibration of CH2
t4:48 1450–1460 45 Stretching vibration of C_O Carboxylates High molecular
weight 16–190 kDa 270–275 kDa
t4:49 1400–1410 33 Stretching vibration of OH,
of polysaccharide
t4:50 1060–1100 41 Several bands visible Polysaccharides
t4:51 <1000 Phosphorus or sulfur
functional group t4:52 EPS: Extracellular polymeric substance; EDTA: Ethylene diamine tetra acetate group; CER: cation exchange resin. t4:53
Table 5– Metal-binding potential of bacterial EPS and t5:1 t5:2
wastewater sludge EPS.
t5:3 t5:4
EPS producer EPS
concentration mg/L Metal biosorbed References t5:5 Methylobacterium organophilum
184.2 Pb(II) Kim et al. (1996)
t5:6
200.3 Cu(II)
t5:7 Pseudomonas
aeruginosa cur
320 Cu(II) Kazy et al. (2008)
t5:8 Rhizobium etli M4 67 Mn(II) Pulsawat et al.