Publisher’s version / Version de l'éditeur:
Vous avez des questions? Nous pouvons vous aider. Pour communiquer directement avec un auteur, consultez la
première page de la revue dans laquelle son article a été publié afin de trouver ses coordonnées. Si vous n’arrivez pas à les repérer, communiquez avec nous à [email protected].
Questions? Contact the NRC Publications Archive team at
[email protected]. If you wish to email the authors directly, please see the first page of the publication for their contact information.
https://publications-cnrc.canada.ca/fra/droits
L’accès à ce site Web et l’utilisation de son contenu sont assujettis aux conditions présentées dans le site LISEZ CES CONDITIONS ATTENTIVEMENT AVANT D’UTILISER CE SITE WEB.
Internal Report (National Research Council of Canada. Division of Building
Research), 1967-07-01
READ THESE TERMS AND CONDITIONS CAREFULLY BEFORE USING THIS WEBSITE. https://nrc-publications.canada.ca/eng/copyright
NRC Publications Archive Record / Notice des Archives des publications du CNRC :
https://nrc-publications.canada.ca/eng/view/object/?id=379e359c-038b-4c0a-8c2c-8be85a674b3f https://publications-cnrc.canada.ca/fra/voir/objet/?id=379e359c-038b-4c0a-8c2c-8be85a674b3f
Archives des publications du CNRC
For the publisher’s version, please access the DOI link below./ Pour consulter la version de l’éditeur, utilisez le lien DOI ci-dessous.
https://doi.org/10.4224/20338044
Access and use of this website and the material on it are subject to the Terms and Conditions set forth at
Tension tests on fibrous peat
NATIONAL RESEARCH COUNCIL OF CANADA DIVISION OF BUILDING RESEARCH
TENSION TESTS ON FIBROUS PEAT
by
;ANAL
YZED
K. V. HELENELUND
Internal Report No. 346 of the
Division of Building Research
Ottawa July 1967
This report is concerned with laboratory and field tension tests carried out on peat samples from the Mer Bleue Peat Bog near Ottawa and from Rockland, Ontario, about 10 miles east of Ottawa on the Trans Canada Highway.
The author of this report is Dr. K. V. Helenelund, Profes s o r of Soil Mechanic s and Foundation Engineering at the Finland Institute of
Technology who was a Visiting Scientist at the Division of Building
Research from September,
1966
to February,1967.
The study is partof a continuing investigation by the Soil Mechanics Section into the geotechnical properties of peat.
Ottawa
July
1967
R. F. Legget Director
TABLE OF CONTENTS
METHODS FOR MEASURING TENSILE STRENGTH OF SOILS Review of earlier tests
Direct tension te sts Beam tests
Other test methods
MEASUREMENTS OF TENSILE STRENGTH OF PEAT Field te sts at Mer Bleue
Laboratory tests
Comparison with re s ul ts from beam tests and vane tests
Tensile deformability of peat
INFLUENCE OF TENSILE STRENGTH ON THE BEARING CAPACITY Bearing capacity of the surface mat
Estimation of bearing capacity based on experience Relationship between tensile strength and shear strength
Peat classification based on tensile strength SUMMARY AND DISCUSSION OF TEST RESULTS ACKNOWLEDGEMENTS REFERENCES Page 1 1 2 4 6 7 7 9 11 12 13 13 15
16
1719
21 21by K. V. Helenelund
Fibrous peat is generally composed of more or less decomposed
plant fibre s embedded in a non-fibrous peat matrix. The strength of
fibrous peat depends both on the number and strength of fibres and on
the strength of the peat matrix. Because of the complex structure of
fibrous peat it is necessary to investigate the strength and deformability of this soil not only in compression and shear, but also in tension.
Tension tests should give a better evaluation of the strength of fibrous
peat than do compression tests. The tensile strength and tensile
deformability of the fibres and of the peat matrix apparently vary more
than the strength and deformation characteristics in compression. It
should also be possible to measure the tensile strength of individual
fibres of various types and dimensions, at different degrees of
decom-position, etc.
This report contains a description of field and laboratory tension
tests carried out from October 1966 to February 1967. The direct tension
tests were made using a tension box apparatus constructed in September
1966 at the Division of Building Research, NRC, Ottawa. Most of the
tests have been made on Sphagnum peat from the Mer Bleue peat bog area
near Ottawa. In addition, a few tests were made on Carex peat from
Rockland, Ontario on Highway 17, east of Ottawa. The report also
con-tains a discussion of beam tests and other methods for determining the
tensile strength of soils. Finally, the ultimate bearing capacity of a
peat deposit and the influence of the tensile strength on the bearing capacity are discussed.
METHODS FOR MEASURING TENSILE STRENGTH OF SOILS Review of Earlier Tension Tests
Tension tests have been used for many decades to study the strength
properties of engineering materials (e. g. Morrison, 1937). Direct tension
tests on mineral soils have been made by Haefeli (1944) who also pointed out
the relationship between shear strength and tensile strength. He used a
centrifugal tensiometer in which the tensile stress was obtained through
2
-using Haefeli's tensiometer show that it is often difficult to determine
the moment of rupture in a tension te st of this type. This drawback may,
however, be reduced or eliminated if the appearance of tension cracks is observed using stroboscopic light.
Direct tension te sts on soil specimens with expanded heads have
been reported by Hasegawa and Ikeuti (1964). Similar tests have also
been carried out in Yugoslavia (Suklje and Drnovsek, 1965). Tension
te sts of this type could be adapted also for large specimens of peat, although a greater amount of sample preparation is required.
Triaxial tests with hollow cylinders have been used by several
authors (e. g. wオセ al, 1963). As stated by Suklje and Drnovsek (1965) the
use of hollow cylinder specimens is suitable for deformability tests at
stress states with one tensile principal stress. The author made some
tension tests with hollow cylinder specimens while working at the Soil Mechanics Laboratory of the Swiss Federal Institute of Technology in
Zurich in 1948 - 49. The preparation of undisturbed soil sample s of this
shape, however, was found to be very difficult.
The Brazilian tension test or split cylinder test is used for brittle
materials and is probably not suitable for peat. Diametrical compression
is applied also in the brittle ring test, where the specimen is of similar shape to that in a hollow cylinder test (Shook, 1963).
Beam tests have been reported by Drnovsek (1966) for investigation
of the flexural strength and deformability of clay. Beam tests seem to
be suitable also for peat, at least for fibrous peat with sufficient strength
to avoid failure by the dead weight of the beam itself. Tests with
electro-magnetic beam vibrator have been reported by Kaplar (1966) for determination of the elastic properties of frozen soils.
Direct Tension Tests
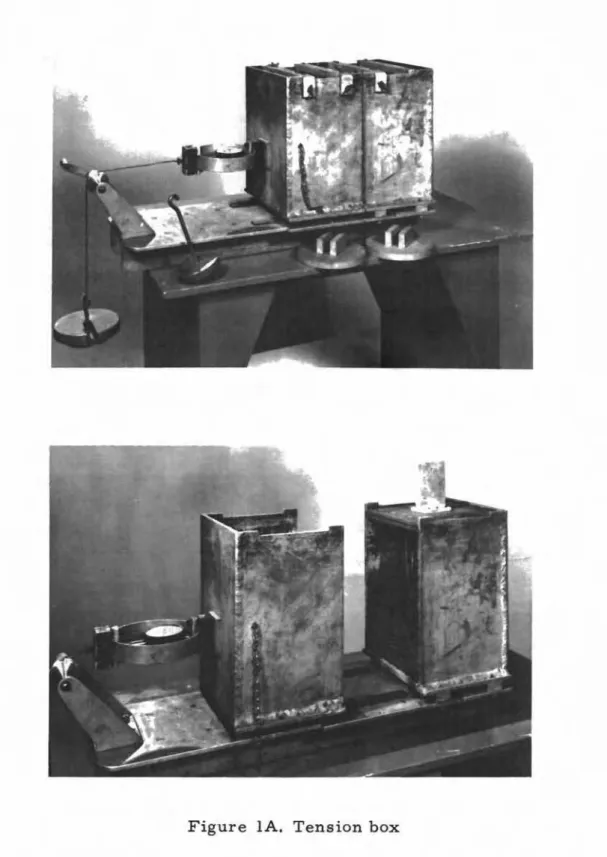
The direct tension tests described in this report were carried out using a tension box apparatus specially designed for tests on large size
peat samples (Figure lA). The apparatus consists in principle of an
aluminum box with inside dimensions of 12 by 8 by 10 inches, which is
divided into two half-boxes by a vertical joint. One of the half-boxes is
resting on ball-bearings and is movable in the horizontal direction. The
the tension box through four nail plates, two at the bo ttorn and two nail
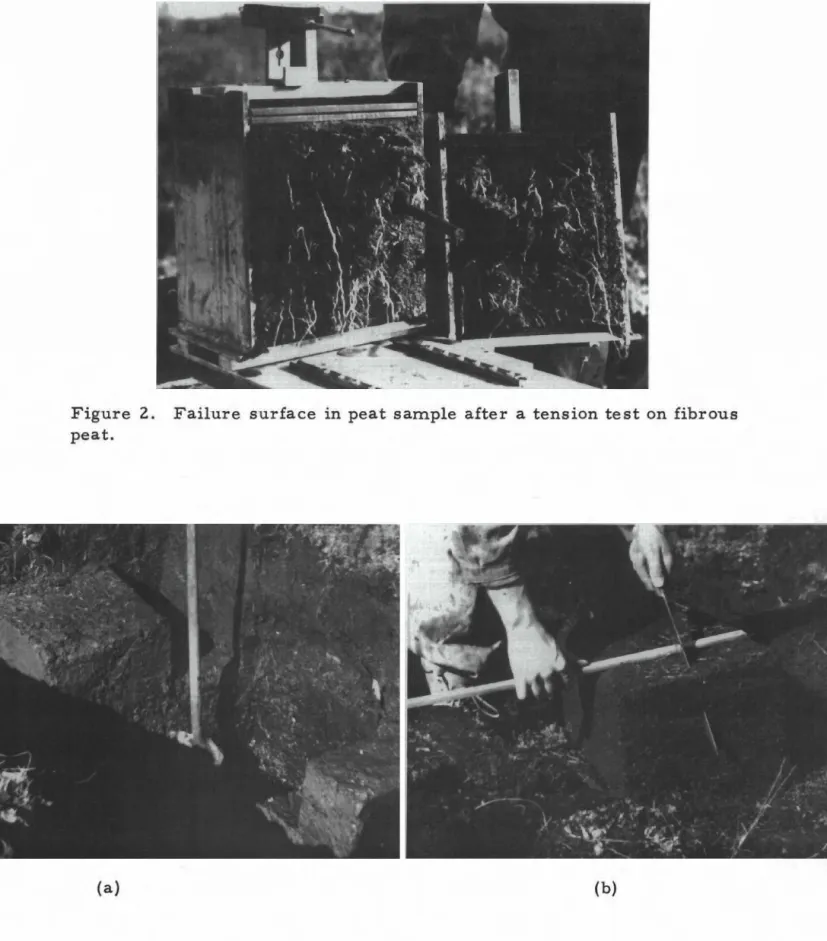
plates at the top of the sarnp le (Figure IB). As the half-boxes are pulled
apart, the soil s pe c irn e n is stressed in tension and u Itirria teIy a vertical
failure plane develops in the middl e of the s pe c irn en (Figure 2) (After
installing a soil sarnpl e in the tension box, a vertical cut, say I inch deep, can be rna de on both sides in the m iddl.e of the s arrip le in order to con-centrate the stress in this cross-section and avoid failure at a row of nails) .
The tensile stress is generally produced by successively increasing the nurn.be r of weights on a loading plate connected by a flexible wire
through a pulley to the rno va ble half-box. If the load has to be increased
continuously, instead of by steps, this can be effected by the use of water
or rn.e r c u r y instead of rne ta l weights. In marry cases it is desirable to
pe rfo rrn the test with constant rate of strain. For this purpose the tension
box apparatus has been provided with a proving ring fixed between the
m ova ble half-box and the pulling wire. Rapid tension tests can be rna de
rnanual l y by turning a small handle on the pulley. 1£, howeve r, a constant
strain rate test has to be pe r fo r rne d as a slow test the tension box apparatus
should be provided with a rno to rize d loading unit.
The use of nail plates has been introduced in an a tternpt to avoid the laborious s arnple preparation required in direct tension tests on soil
s pe c irrie n s with expanded heads. Tension tests carried out at the Mer Eleue
showed that the greatest difficulties are generally experienced in s arnpl ing and preparation of test s pe c irrie n s so that a disturbance of the soil structure
is avoided. Although these tests have shown that the nail plates present a
practical, labour-saving solution it rnu st be r e me rnbe r e d that the use of
nail plates also has several drawbacks. The m o st irrrpo r tarit drawbacks are
that nails give a norie urrifo r rn stress distribution and that the effective
s pe c irrre n length corresponding to an observed tensile strain is not clearly defined.
The length and n urn be r of nails can be varied according to the
require-rn.e nt s of each special case. The nails have to be strong enough to transfer
the rria.xirnum tensile force (about 30 to 40 kg) f'r orn the soil spe c irne n to the
tension box. Too rnarry or too thick nails, on the other hand, rriay cause an
undesirable disturbance of the soil structure resulting in a failure at a row
of nails instead of at the rn id dl.e of the s arnp le . The nails should generally
be concentrated at the ends of the s pe c irn.e n leaving the central part of the sarnple as undisturbed and freely de fo r ma bl.e as pos s i bl.e .
-
4
-Separate loading p la tfo r m s can be placed on each half-box in
case the test has to be rna de as a consolidated (c,; or c
d-) test.
In this case, a thin layer of fine sand or filter paper should be in-serted between the soil s arnple and the nail plates in order to speed
up the consolidation process. During the consolidation phase the
m ova bl.e half-box is fixed to the base plate by screws. Because of the
great dirrie ns i orrs of the soil spe c irrie n (horizontal cross section: 12 by 8 inches) heavy loads are required to produce even rn ode r a te vertical stresses.
The top nail plates should be installed carefully, keeping both
nail plates exactly horizontal. It would be desirable to construct a
special collar (box wall extension) to facilitate proper installation of
these plates. A possible inclination of the nail plates could give an
incorrect picture of the horizontal strain if the dial gauge is fixed to
the nail plates. (As a counter-check the horizontal dial gauge can be
installed between the rn ova bl e box-half and the base plate).
A drawback of the direct tension test is that the tensile force
generally does not act exactly axially. For a brittle rna te r ia l this
would be a serious drawback, but its influence should be rather arna Il
in tension tests on peat. 1£necessary the point of action of the pulling
force can be changed by inserting an adjustable connection between the tension box and the proving ring.
BeaITl Tests
The tensile strength of fibrous peat is high enough to rn a ke it possible
to cut out and handle peat sarnp.le s of SOITle length. During the field tests
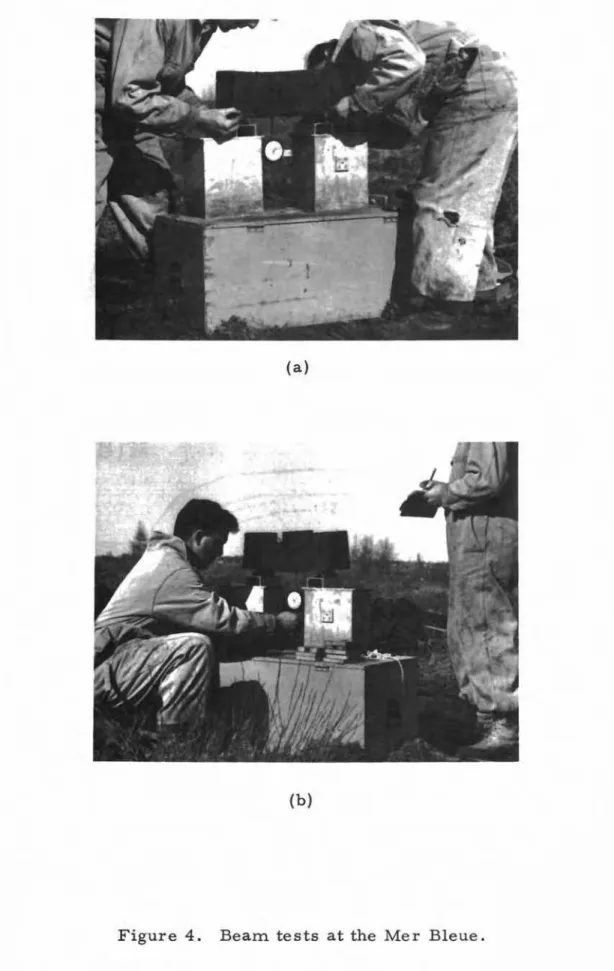
at the Mer Bleue a nurn be r of soil sarnpl e s were cut to 14 or 16 inch long be arn s (Figure 3, usual size of test s pe c irnen ; 16 by 6 by 6 inches) and
tested as s irnply supported be am s , They were loaded, in addition to the
un ifo r m ly distributed dead weight of the be arn itself, by a point load
applied at the m.i ddl e of the be arn , The load was increased by 1 kg every
one rn in ute until failure occurred. The deflection was rne a su r e d by a
dial gauge fastened under the bearn at the point of application of the external load (Figure 4).
As the small compressive strength of peat did not permit use of a concentrated load, the external force was applied on a 1 inch wide
aluminum plate hanging straight across the beam. This means that
the "point load" was distributed over a 1 by 6 inch area in the middle of
the beam. In spite of this, the peat showed signs of being overstressed
in the compre s sion zone before the beam definitely failed in tension.
This was particularly clear in one test on a 16 by 4 by 8 inch beam, where
the load was acting on a smaller area (1 by 4 i.nc he s) , Because of the pore
water pressure developing under the external load, pore water was escaping from the peat in the compression zone.
Similar signs of compressive overstressing and pore water flow
could be observed near the supports. 1£the beam is placed directly on
narrow angular or rounded steel bearings, these are pressed into the
peat, whereby they may not act any more as really "free" supports. It
is therefore recommended that the beam be placed on small steel plates
re sting on rounded or angular supports (Figure 4). Steel bearings of this
type prevent partial transfer of bending moments at the supports and eliminate a reduction of the effective beam height due to compression of overstressed peat.
A more uniform distribution of bending moments can be obtained
by using two point loads instead of one. At the same time the risk of a
compression failure due to the concentration of stress under a point load
is decreased. It is recommended that the beam in this case be loaded by
two equal point loads, both acting at a distance of L/3 from the supports,
where L is the distance between the supports. The risk of a local
com-pression failure is, of course, still smaller if the beam is loaded by a
uniform load. This is, however, more difficult to obtain.
1£the distance between the supports is long, the beam may fail by
its own weight. By successively increasing the distance between the
supports the beam thus can be loaded to failure without needing any
sub-stantial external load. This possibility evidently presents a simple
method of obtaining a uniformly distributed load. The influence of the
dead weight of the beam must also be taken into consideration in a normal beam te st with external load.
Roots and remainders of wood can have a marked effect on the
6
that are parallel to the be arn increase its strength very rn u ch , especially
if they are locate d in the tension z orie , The re sults of a be arn te st should
therefore be subjected to a critical evaluation taking into consideration
possible influences of roots and r erria inde r s of wood. After the be arn has
failed the occurrence of roots and wood pieces in the test spe c irn en should be carefully investigated and the nurribe r , d imen s ion , location and degree
of de cornpo sition of such obstacles should be observed and noted in the test
report.
Other Test Methods
A possible rne tho d of obtaining a rn o r e urrifo rrn stres s distribution
in the direct tension test would be to fix the ends of a p risrriat.ic soil
sa.rnp Ie to two rn e ta l plates by freezing. 1£ a very cold rrie ta l plate is
pressed against a saturated soil sarnpl.e , the pore water close to the plate freezes, fo r m ing a strong bond between the soil sarn pl.e and the cold rn e ta l plate (rapid free zing could be effected, for exarnpl.e by using liquid air).
This solution rna y not be particularly suitable for slow tests but should provide a practical rne tho d of transferring urrifo r m tensile stress to soft
soil sarnpl e s in rapid tension te sts. In inve stigations concerning the
tensile defo rrnab ilit'y of soil the strain should be rrre a s u r e d on a section in the rn i.dd Ie of the s pe c irne n that is not influenced by the freezing process.
Another possibility is to have test s pe c irrie n s treated by partial
c h errri ca I stabilization. The ends of a long soil s arrip le can be stabilized by
AM-9, or by silicates, rn.a ki ng the soil strong enough to use rne chani cal
grips for exerting the tensile pull on each end of the s pe c irrie n , This rrie tho d
require s rn o r e laborious sarripl e preparation and is therefore hardly
suit-able for rapid field tests. On the other hand, it should be applicable to
l onge te r m tension tests in the laboratory.
Be arn te sts with soil s pe c irrie n s re sting on and covered by thin flexible steel plates have been suggested by H. Poorooshasb. ':' It is
a s surne d that the soil spe c irne n and the steel plates cooperate, Io r m ing
a sandwich- be arn in which the steel plate s act as cOITlpres sion and tension rn ernbe r s, whereas the shear forces are taken up by the soil spe c irnen ,
Two sandwich-beam tests of this type were carried out during the field tests at the Mer Bleue, using 16 by 6 by 1/32 inch flexible plates of
s tainle s s s tee1.
Sampling from an open test pit is laborious at any except shallow
depths especially when heavy block samples are used. It would be desirable,
therefore, to develop in-situ tests for measurements of the tensile strength
and tensile deforma bility of soils. In principle, this could be done by
sub-jecting a hollow cylinder specimen to a stress state with one tensile principal stress and measuring the inside and outside volume changes. Cutting out small-size cylinder specimens of fibrous peat is, however, difficult and the creation of undisturbed hollow cylinder specimens is still more difficult, even if the test is carried out in-situ and the specimens
therefore need not be lifted to the ground surface. The occurrence of roots
and pieces of wood, obstacles frequently found in muskeg, make the suc-cessful performance of complicated in-situ tests even more uncertain. MEASUREMENTS OF TENSILE STRENGTH OF PEAT
Field Tests at Mer Bleue
Because of the large size of soil samples needed for tension tests
it is advisable to carry out those tests in the field. At the same time the
disturbance of the natural peat structure, changes in moisture content etc.
caused by transportation and storage are reduced to a minimum. For this
reason, most of the tension tests were carried out in the field, near the
sampling pit. The field tests were supplemented later on by a few slow
te sts carried out in the laboratory.
In October 1966 a series of 56 direct tension tests were made at the Mer Bleue, in a test area where load tests had been performed in the
summer of 1966 (Forre st, 1967). The te sts were made at controlled stre ss,
generally increasing the load by 2 kg everyone minute. A number of rapid
tests were also carried out with a time interval of only 10 seconds. In
addition some slower tests were made with a loading time of 5 minutes. Only one test was carried out at constant rate of strain as it was found that the proving ring did not give correct load values.
In most of the tests the load was increased in 2 kg steps until failure. For study of the tensile deformability of peat during unloading and reloading, the test specimen in some te sts was unloaded to zero or to 50 per cent of
8
previous load after each load increment. The tensile strength was
cal-culated as the mean tensile stress in a vertical cross-section of the test
specimen at the moment of failure. There was no difficulty in determining
the moment of failure as this was always clearly visible. The horizontal
deformation, however, was quite great, occurring in some tests before the definite failure took place.
The first tension tests were made on prismatic specimens with
constant cross-section. It was then found that in many cases the failure
occurred at a row of nails. In subsequent tests, the vertical
cross-section at the middle of the sample was reduced, therefore, by a
one-inch-deep vertical cut on both sides of the specimen. In this way the
tensile stress in the middle of the specimen increased, resulting in
failure in this cross -section. It should be noticed, however, that this
measure is likely to cause a non-uniform stress distribution in the
failure plane. If failure at a row of nails can be avoided simply by
decreasing the number of nails in the middle of the sample, such a
measure is to be preferred to the use of specimens with variable cross-section.
The results of the field tension tests at the Mer Bleue are summarized
In Table I (Helenelund,1967). The peat has been classified according to a
method developed by von Post (Flaate, 1966). According to this classification
the degree of decomposition (hurnification) is denoted by H and varies between 1 and 10, the relative moisture content is denoted by B, the fibrosity by F, the number of root threads by R and the amount of wood remainders by V
(Lukkala and Kotilainen,l94S). Maximal variations of all these factors can
be expressed by the formula HI_lOBI_SF 0_3 RO_3 V 0-3. This formula is
developed later in this report under "Peat Classification Based on Tensile Strength. "
Near the ground surface the tensile strength increases with depth
in spite of the fact that the degree of decomposition also increases. The
mean tensile strength of the surface peat is thus O. S tons/m2 compared
. 2
with a value of about 0.9 tons/m at a depth of O. Sm. Between O. Sm and
1. Om the tensile strength decreases slightly with increasing depth. The
ground water level was O. 70m below the ground surface. If the mean
tensile strength of the peat is calculated on the basis of the mean values at different levels (0 to 0.2m, 0.2 to 0.4m etc. down to 102m) a value of
2
0.74 tons/m is obtained. The mean value from all the 55 tension tests
is O. 70 tons /m2. The difference is due to the fact that most of the tension
The reason for the comparatively small tensile strength of the undecomposed surface peat is obviously the fact that the living plants are standing almost vertically, whereas the tensile strength is measured
in a horizontal direction. Most of the fibres of the more or less decomposed
plants under the living moss cover are, on the other hand, horizontally
oriented. Tension tests carried out in the summer of 1966 in Finland
indicate that the type of the surface mos s has a considerable influence on
the tensile strength. The horizontal tensile strength of Polytrichum
commune, for instance, is greater than that of a surface mat of Polytrichum strictum and both these moss types seem to be stronger than Sphagnum moss.
Evidently both the strength and deformability of separate fibres as well as the number, length and orientation of the fibres have an important
influence on the strength of peat. The tensile strength in a horizontal
plane is normally, with the exception of the living moss cover, much greater
than the tensile strength in a vertical plane. The amount and degree of
decomposition of roots and wood remainder also influence the strength and
bearing capacity of peat to a great extent. Even if the tension tests are
carried out on relatively large samples, however, it is difficult to get a
relia ble picture of the influence of roots and wood remainder s , Strong
roots and wood pieces generally have been taken out of the peat samples before the tension tests.
Stress-strain curves obtained from field tests at Mer Bleue are
shown in Figures 5 to 9. A number of tension tests were made with smaller
samples in order to investigate the possibility of using the same tension box apparatus for soil samples of different sizes. Tests with smaller samples often gave smaller strength (see samples no. 18 to 21, Figure 6B) or greater scattering (samples no. 22 to 27, Figure 7A and samples no. 49
to 51, Figure 8B) compared with tests with samples of normal size. In
some te sts with small samples, the top nail plate s tended to tilt or the
bottom nail plates tended to rise and slide from their positions. The
stress-strain properties of peat are discussed later under "Tensile Deformability of Peat. "
Laboratory Tests
The main purpose of the laboratory tension tests was to supplement the field te sts by slow tests carried out under controlled humidity and
10
-temperature conditions. The first laboratory test (on sample no. 71 from
Mer Bleue) was carried out in a constant temperature room and the
sub-sequent tests were all made in a controlled humidity room. Vibrations
caused by construction work going on in the same building affected the
measurements, especially during the first three tests. Later, the tension
box apparatus was placed on a 1 inch thick slab of soft, porous rubber covered by a thin plate of veneer and this insulation eliminated most of the effect of the vibrations in the subsequent te sts.
Time -strain curves obtained in a slow tension test on rather
de-composed peat from the Mer Bleue are shown in Figure lOA. The horizontal
load was increased by 2 kg every 24 hours. At the beginning of the test the
deformations were small and the time-strain curves are almost straight on
a semi-logarithmic plot. The inclination of the curves increases gradually
with increasing load, with small but clear bends appearing at 12 and 14 kg.
At a load of 16 kg (0.63 tons/m2 ) the sample failed in tension, about 3 hours
after load application. Similar time curves were obtained in a test on
Carex-peat from Rockland (Figure lOB). The sample was taken from a
depth of 20 to 40cm where the peat can be c Ia s sified by the formula H
4B2F1R2V 1- 2' The water content of the Carex-peat was 357% and the
unit weight was 1.06 tons /m3. At the beginning of the test the deformations
were very small and even negative strain (contraction) was observed at
small loads, apparently due to pre-stresses caused by an oblique installation
of nail plates. Failure occurred after unloading the sample from 20 kg to
zero and reloading back to the same load, which corresponds to a tensile 2
strength of 0.64 tons/m .
Only two sample s of Carex-peat were te sted in the laboratory, both
from Rockland. A sample of surface peat of Carex-type was loaded in the
field to 28 kg, corresponding to 0.94 tons/m2 . This was the maximum load
available; the actual tensile strength must have been at least 1.0 tons
1m
2 .In the laboratory a sample of the same material failed at a load of 26 kg,
corresponding to a tensile strength of 0.87 tons
1m
2 . The strength valueobtained in the slow laboratory test (rate of loading: 2 kg per 24 hour) is
thus smaller than the tensile strength measured in the rather rapid field te st, where the rate of loading was 2 kg per minute.
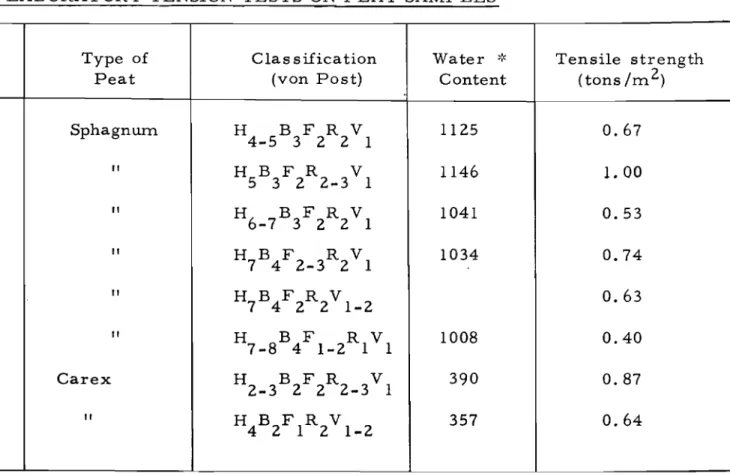
The results of the laboratory tension tests are summarized in
Table 11. For sample s of Sphagnum peat the tensile strength measured in
2
variation of 0.36 to 1. 13 ton
Zm
obtained in the field tests. The rn e a ntensile strength rne a su r e d in the slow laboratory tests is 0.66 ton/ITl 2 , which is a little srriaIle r than the rn e a n value, 0.70 ton/ITl 2, obtained
fr orn the rn o r e rapid field tests. For the drier less de c ornpo se d surface
peat rapid tests se ern to give srria l.Ie r strength values than slow tests
(d. Figure 7B). Below the water table, however, the influence of test
speed is the opposite as a rapid test here gives greater tensile strength
than a slow te st (d. Figure
9).
The difference in the behaviour of thepeat at different depths is apparently dependent upon the influence of the pore water pressure as the peat below the ground water level is saturated.
The great difference in the ps r m ea bi.lity of a lrn o st un de c orrrpo s e d peat and
the rn o r e humif'ie d peat rna ke s the t.irn e dependence rn.o r e pronounced in
the hurnifie d peat.
COITlparison with Re sults froITl BeaITl Te sts and Vane Tests
The results of a series of be arn tests carried out at the Mer Bleue
are s urnrria r i z e d in Table I I I, where M denotes bending rnorne nt caused
by the dead weight of the be arn itself
。ョセ
M denotes bending rnorrie nt dueto the external point load applied at the ITlilile of the be arn , If the flexural
strength is calculated a s s um.irig that the peat behave s as a purely elastic
rna te r ia l , the rne a n flexural strength would be 1. 52 tons/ITl 2• These
strength value s are denoted by
a
in Table II I, Er orn which it can be seenthat
a
varies between 1. 07tonsiITl
2 and 2.26 tons/ITl 2. As stated above,e
the rne a.n tensile strength rne a sur e d in the tension box tests carried out
at the Mer Bleue was 0.70 ton/ITl 2• The rne an flexural strength (a ) is
e
thus 2.24 tirn e s greater than the tensile strength de te r m ine d by direct
tension tests.
In reality the peat does not behave as an elastic rna.te r ia.l , The
flexural strength has been calculated in another way, therefore, as suming
that the peat behaves as a plastic rna.te ri a.l , the strength being fully developed
in the entire cross section of the cornp r e s s ion and of the tension zones. The
flexural strength thus calculated is denoted by
a
in Table III. It varies2 2 P 2
between 0.71 ton Zrn and 1. 51 ton s
Zrn
the rne an value being 1. 05 torisZm .
This rne an s that the m e an flexural strength (a ) is 50 per cent greater than
p
the rne a n tensile strength me a su.r e d in the direct tension tests at the Mer Bleue.
12
-A rrio r e detailed discussion of the results of the be arn tests
pre-suppose s a knowledge of the strength and defo r ma bi lity of peat in both
c ornp r e s sion and tension. The c ornp r e s s iv e strength of peat is not equal
to its tensile strength and also the stress-strain relationships are
different in the c orrrp r e s sion and tension zones of a be arn s pe c irne n ,
These properties should first be subjected, therefore, to a thorough investigation.
Vane tests with vanes of different sizes have shown that the shear strength rrrea s ur e d in peat depends on the size of the vane (MacFarlane, 1961) A series of vane tests was carried out at the Mer Bleue using a 4-bladed vane with a di am e te r of 10 CITl, as this vane size s e e rn s to give srria l.Ie r
strength values than srn.al le r vanes. According to these vane tests the
shear strength at a depth of O. 2ITl to 2. OITl varies between 0.5 ton/ITl 2 2
and 2.8 tons/ITl 2. The rn e an shear strength fr orn 10 vane tests is 1.40 t.on s Zrn
or twice the rne a n tensile strength of the peat. This rne an s that the undrained
shear strength is of the s arn e order of rnag rritude as the flexural strength calculated on the basis of the theory of elasticity.
Twelve vane tests were carried out at Rockland, using large-size,
rn e di um , and srria.Ile size vanes. The shear strength of the Carex-peat
varied between 1.09 tons/ITl2 and 4.10 tons/ITl 2. The rne a n shear strength
calculated fr orn all tests is 2.41 tons /ITl 2, whereas the rne ari shear strength
rrie a s ur e d with the large-size vane is 1.90 tons/ITl 2. The value rne ntione d
la s t is twice the greatest tensile stress applied in the field tension test and
2.5 tim.e s the rnean tensile strength rne a su r e d in laboratory tests on Ca r e
x-peat.
Tensile DeforITlability of Peat
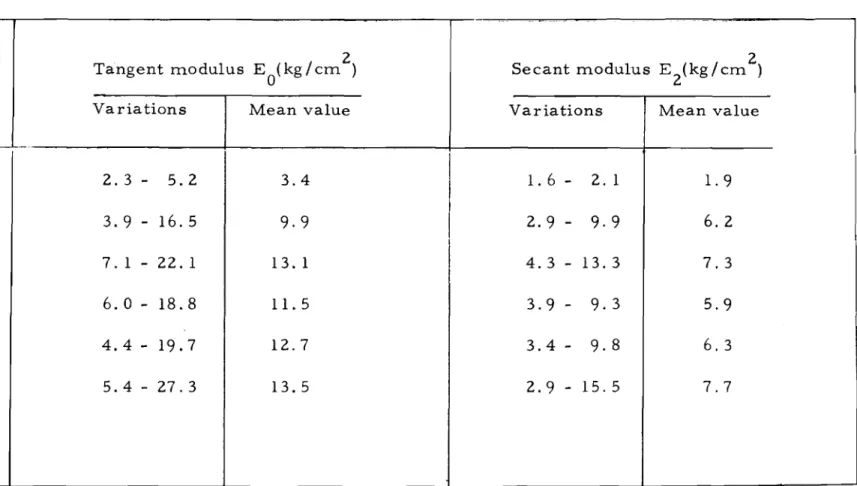
Table IV shows tensile de Io r rna ti on rn o duli calculated fr orn the
stress-strain curves obtained in field tests at the Mer Bleue. The tangent m odulu s
corresponding to the initial slope of the stress -strain curve is denoted by EO' whereas E
2 represents the secant m odulu s corresponding to the stress
range 0 -
a
/2 wherea
is the tensile stress at failure. The values havet t
been calculated a s suming that the whole specimen is subjected to tensile
stress so that the measured horizontal de fo r-rnation s correspond to a specimen
length of 30 crn , The degree of decomposition of the peat, the fibrosity at
different depths etc. are shown in Table 1.
The tensile deformation modulus of the living Sphagnum ITlOSS cover at the soil surface is considerably smaller than the de fo r ma.t.i.on modulus of
a slight increase of the E-values with depth, but local variations in peat structure, inhomogeneity due to roots etc. cause variations which are generally much greater than the differences between the mean values at
different depths. The mean value of the tangent modulus E at a depth of
2 2 0
O. 2m to 1. 2m varies from 10 kg/cm to about 13 kg/cm and the secant
modulus E
2 is about 6 kg / em 2 to 7 kg / ern
2 .
The assumption that the measured horizontal deformations correspond
to the whole length of the specimen is not correct. Due to the influence of
the nails and to the reduced cross-section in the middle of the sample, the
central part of the specimen is stressed more than the ends. The horizontal
deformation thus corresponds to a smaller effective length. This means
that the E-values in Table IV are too great; they more probably represent
maximum values than mean values. More correct values could be obtained
by detailed observations of the strains in different parts of the specimen. Stress -strain curves obtained by repeated unloading and reloading are illustrated by Figures 11 and 12A, all representing rather decomposed
Sphagnum peat (samples no. 60, 61 and 66). The decrease of the hysteresis
modulus with increasing stress is demonstrated by Figure l3A representing
surface peat of Carex-type. The great difference between the tensile
deformability of almost undecomposed surface peat and more decomposed peat is clearly observed if Figure l3A is compared with Figure 13B, showing re sults obtained in a laboratory tension te st on Carex peat from Rockland. Stress-strain curves obtained by unloading to 50 per cent of the previous load are illustrated by Figures 12B and l4A from which the decrease of the deforma tion modulus with increasing stress is also clearly seen (sample s
no. 62 and 70). Figure 14B shows a comparison between stress-strain
curves for slow and rapid reloading indicating that the tensile strength decreases by decreasing the rate of reloading.
INFLUENCE OF TENSILE STRENGTH ON THE BEARING CAPACITY Bearing Capacity of the Surface Mat
The bearing capacity of muskeg is generally estimated using similar methods of calculation to those applied to mineral soils - that is, the soil
is assumed to fail in shear. In one of the earliest investigations concerning
the strength and bearing capacity of peat, Smith (1950) made the assumption that the ultimate bearing capacity (p ) is twice the critical load (p ) giving a
14
-maximum shear stress (T ) equal to the shear strength (c) of the peat.
max
He used the theory of elasticity, which for a strip load on the soil surface
gives T
=
»t»,
where p is the uniformly distributed surface load. Thismax
gives an ultimate bearing capacity of p
=
2p=
Zrrc , compared with p=
u c u
(nt2)/c according to Prandtl's solution based on the theory of plasticity. Because of the high compressibility of peat, a load applied to the muskeg surface causes a considerable immediate settlement, the magnitude of which is dependent upon the thickness of the peat deposit and the width of
the loaded area. In many cases the settlement is so great that the muskeg
can be considered to have failed in compression. At the same time the
surface mat outside the load is exposed to tensile stres ses, which may result in the appearance of surface cracks parallel to the boundaries of
the loaded area. This can ultimately lead to a punching failure, particularly
if the peat is deposited on a weak substratum of soft clay or marl.
Experi-ence from the construction of highway embankments (Thurber, 1965) indicates that the bearing capacity of muskeg does not generally increase when the thickness of the peat layer decreases, as would be the case if the soil failed in punching shear.
Because of the stress distribution in the embankment fill, the sur-face mat under a highway embankment is exposed not only to vertical stress
but also to considerable tensile stresses. If the tensile strength of the peat
is not great enough, the surface mat breaks under the middle of the embank-ment and the fill material sinks into the soft decomposed peat or soft clay.
The tensile stresses in the surface layer may be calculated assuming that the fibrous surface peat acts as a continuous mat or beam on an elastic subgrade (Wyman, 1950; Nevel, 1961; Meyerhof, 1960; 1962).
The ultimate punching pres sure under a circular contact area on a
homogeneous surface mat is approximately p
=
(2tm)ma ,
where cr is theu t t
tensile strength of the surface mat and m =h/a, when h is the thickne ss of
the mat and a is the radius of the contact area. The local bearing capacity
is approximately Pu
=
3crt (Meyerhof, 1960), which corresponds to the ultimatepunching pres sure in the case m=1. It is also possible, of course, to calculate
the critical load in the same way that Smith (1950) did, using the theory of
elasticity. If the ultimate load is assumed to be twice the critical load giving
a maximum tensile stress equal to the tensile strength (o ) of the soil, the
t
ultimate uniformly distributed load on a circular contact area in the case
v
= 0.5 would be p=
4cr. The p - value increases when Vdecreases; forV = 0.4 the
オャエゥュ。セ・
loaa would「セ
about p = 4.5 o and for V=
0.2, P=
u t u
5. 70
The factor of safety of an embankment on layered soil con-sisting of peat and clay layers is usually calculated using a circular
cylindrical surface of rupture. Because of the great difference between
the structure and stress -strain properties of peat and clay, the shearing
re sistance of the se soils is not fully developed at the same time. The
normal procedure of using peak strength values along the whole surface
of rupture is, therefore, not justified in this case. It is recommended
that the ultimate resisting rnoment L:M be calculated from the peak value
obtained from a L:s-E: curve or taken
ヲイセュ
a L:M-€ curve, where L:s denotesthe sum of the shearing resistance in the surface of rupture corresponding to a certain angular strain E: and L:M represents the resisting moment at a certain e - value.
Estimation of Bearing Capacity based on Experience
Highway and railway embankments have been built across muskeg areas for many decades and much experience has thus been obtained
con-cerning the bearing capacity of muskeg. Unfortunately only a small part
of this experience has been recorded and related to the strength properties
of the peat. A few case records have been described, where the actual
failure load was in reasonably good agreement with the ultimate bearing
capa aaty calculated on the basis of unconfined compression tests or vane tests (Ward, 1948. Anderson and Hemstock, 1959; von Moos, 1961).
Miyakawa (1959) stated, on the other hand, that the normal inter-pretation of the circular arc method always results in an overestimation
of the bearing capacity of the peat. Similar re su.lts were obtained by
Ripley and Leonoff (1961), who reported that the actual bearing capacity of a deep peat deposit was only about 30 to 50 per cent of the theoretical value
calculated on the basis of vane tests. With regard to the use of unconfined
compression tests for estimating the bearing capacity of peat, Hanrahan (1964)
expressed the opinion that these tests are somewhat unreliable for peat
and tend to overestimate the strength of the material.
A purely empirical method for the estimation of the bearing capacity
of peat has been proposed by Thurber (1965). On the basis of experience in
highway construction in muskeg areas in Alberta and British Columbia, Thurber stated that the maximum permissible height of fill to avoid shear
16
-If the depth of the muskeg (including both peat and soft clay) is greater than 15 ft , the maximum permissible height of fill would be 8 ft (about 2. 5m). This corresponds to a "safe bearing capacity" of about 7 tons
1m
2 and 5 tons/m 2, re spectively. However, as the strength and bearing capacity also depend on the type of muskeg and the underlying subsoil this recom-mendation should be regarded as valid only for a certain type of muskeg.There are, in fact, case records indicating smaller ultimate bearing capacitie s than the above recommended" safe" values. In a case in Hokkaido described by Miyakawa (1959) failure occurred when the thick-ne s s of the fill was 2.4m. Hanrahan (1952) dealing with problems in road construction on peat described a failure caused by a highway embankInent which had a height of less than Zrn , The case reported by Ripley and
Leonoff (1961) is a further example of a smaller failure load. From Finland several cases are known (Helenelund, 1953) where the actual failure load has been smaller than the safe loads recommended above.
It is possible that a fairly good method for the estimation of the bearing capacity of peat could be developed on a purely empirical basis. Such a method should be based on observations in different types of muskeg so that the type of surface cover as well as the type and depth of peat and the underlying substratum can be fully considered. An empirical bearing capacity formula of the type p
=
p+
c PIA has been suggested byu 0
2
Korchunov (1946), where p for moss peat is about 2 to 4.5 tons 1m and c o
is a perimeter shear coefficient varying between about 0.5 and 0.9
ton/m.
P denotes the perimeter of the loaded area in meters and A is the area of the contact surface in square meters. For a rather long ernbankrne nt with a width, for example, of 10m or more the influence of the perimeter shear is very small and the ultimate bearing capacity p is approximatelyu
equal to p • Both p and c depend on the type of the peat as well as on the degree ofcaecomposPtion and the moisture content. These values, however, have been measured only for small loading plates (Korchunov, 1946) and may therefore not be directly applicable to large-scale structures.
Relationship Between Tensile Strength and Shear Strength
The gene ral relationship between tensile strength and shear strength in homogenous mineral soils has been discussed by Haefeli (1944) and Suklje
and Drnovsek (1965). Fibrous materials, however, behave in a different way (Kelly and Tyson, 1965) and the relationship found for mineral soils,
therefore, cannot be applied to fibrous peat. The tensile strength of
fibre s and root threads is generally considerably higher than the tensile
strength of the peat matrix. This means that some fibres are pulled out
of the specimen in a tension test and that shear stresses are developed
between these fibres and the surrounding matrix. The magnitude of the
shear force depends upon the length and thickness of the fibre and upon the shear strength of the peat matrix.
2 The maximum tensile force that can be applied to an individual fibre is
TTr Of where of is the tensile strength of the fibre material and r is the fibre radius. The maximum shear force developed when the fibre is pulled out of the
sur-rounding matrix is TTr1,T where T is the shear strength of the peat matrix
rn rn
and 1, is the fibre length (the distance between the failure plane and the end
of the fibre is assumed to be
i/2).
The critical fibre length1, at which thetensile force is equal to the shear force is thus i
=
ro(!IT
;
tKat is, thec .L m
critical fibre length is proportional to the ratio between the tensile fibre strength and the shear strength of the peat matrix.
1£ the relative fibre area is denoted by A
f and the relative matrix area
by A (= l-A
f), the ultimate tensile strength of the fibrous material is 0
=
m
tA
f• 0f+ Arn. 0rn
=
Af i,cmT [x + Amm0" • 1£we further assume that the tensilestrength of the matrix is 0 = 2 T we get the ratio 0
IT
=
Af
i
Ir
+ 2( l-Af)m rn t m c
(Kelly and Tyson, 1965). According to the tension tests at the Mer Bleue the
ratio between tensile strength and shear strength of Sphagnum peat is about
0.5 and 0
IT
for fibrous peat should be smaller than 0/T
•
In any case,it is evidJitt tITht the ratio between tensile strength and
ウャエ・。セウエイ・ョァエィ
of peatis not constant but its value depends on the amount and type of the fibres and the critical fibre length.
The tensile strength and shear strength vary differently in different directions and their relationship is also a function of the direction of the
applied stress. The shear strength is generally smaller in a horizontal plane
than in a vertical plane even if the vertical normal stre ss is greater than the
horizontal stress. The tensile strength is greate st when the direction of the
applied stress is parallel to the direction of the fibres. It depends probably on
the topography, but generally, with the exception of the living surface cover,
is horizontal. In fibrous felty peat the horizontal tensile strength can be
18
-Peat Classification Based on Tensile Strength
Several different methods have been proposed for classification of peat. Among the classification methods best suited for engineering purposes are Radforth classification (MacFarlane, 1958) and the von Post classification (Flaate, 1966). The latter. which has been used in this report, gives at
least a rough quantitative description of some of the most important structural elements of the peat. Table V pre sents a summary of the von Post peat soil classification. The type of vegetation is not mentioned in Table V, but should always be included in the classification, either by using terms such as "mo s s peat" or "grass peat" or, preferably, by referring to the predominant
plant (s). for example, "Sphagnum peat" or "Carex peat".
A complete muskeg classification contains as an important part a systematic de scription of the terrain, surface and ground water character-istics of the peat deposit, which influence. for example, the transportation and drainage pos sibilitie s , The se seem to be rather well characterized by the existing c Ia s sification systems, even if the classification is not generally able to give more than a qualitative documentation of these characteristics.
As pointed out by Flaate (1966), a successful classification system has to be related to laboratory tests and case histories in the field. The engineer-ing behaviour of peat depends mainly on the strength and compressibility of the soil. The most practical way to measure the strength is to use a vane te ster and it would therefore seem most logical to use a clas sification system related to or based on shear strength values obtained in a field vane test. The rotation of a vane, however, does not generally cause any clear shear failure in fibrous peat (Helenelund, 1967). and the reliability of strength values obtained by vane tests is thus questionable. It would be better. therefore. to relate the peat classification to the unconfined compressive strength or to the tensile strength of the soil.
The fibrosity of the peat has a stronger influence on the tensile strength than it has on the unconfined compressive strength. The reason is that strong fibres tend to bend or buckle in an unconfined compression test. This tendency is smaller if the test is carried out as a triaxial test or if it could be done as a confined compression test in-situ. For the time being it seems that the tension test would provide a better basis for relating a peat classification to the strength properties of the material.
The tensile strength depends on a number of different factors: type of peat, degree of humification, number, length and strength of fibres and roots, water content, etc. Thus it is not logical to relate the tensile strength only to H (degree of humification), F (fibrosity) or some other specific factor included in a peat clas sification system; it rather reflects the resulting in-fluence of the whole peat structure. If the tensile strength is measured
in different directions, its maximum value indicates the main direction of the fibres and hence gives a picture of the anisotropy of the peat deposit.
As a first step in this direction it is recommended that the tensile strength be measured, if possible, in both the horizontal and vertical
direction, and that these strength values be mentioned after the classification symbols, for example: H4B3F2RIVO' D
h = 1.0, Dv
=
0.3 tons/m 2(D
h
=
horizontal, D
=
vertical tensile strength). Later on, special tensile strengthv
classes may be developed and used, for instance VL = very low tensile strength: 0 to 0.25 tons/m 2, L
=
low tensile strength: 0.25 to 0.5 ton/m2, M = medium tensile strength: 0.5 to 1. 0 ton/m 2 , H = high tensile strenfth:1. 0 to 2.0 tons/m 2 , and VH = very high tensile strength: > 2.0 tons/m • SUMMARY AND DISCUSSION OF TEST RESULTS
The tensile strength of fibrous peat has been measured using a tension box apparatus, in which tensile stresses are applied through four nail plates to a sample of the dimensions12 by 8 by 8 inches (Figures I and 2). The apparatus was made of aluminum in order to get a light-weight
device suitable for tension tests both in the laboratory and the field. Because of the dimensions of the soil samples needed for the te s ts , it proved advisable to carry out the tests in the field, near the sampling pit. Slow tension te sts
should generally be performed under controlled humidity and temperature conditions in the laboratory.
A series of 56 field tests has been made on Sphagnum peat in the Mer Bleue peat bog area near Ottawa in October 1966. The field tests have been supplemented by 6 slow tension tests carried out in the laboratory between November 1966 and February 1967, using peat samples from the
same area. In addition one field test and two laboratory tests have been made on Carex peat from Rockland, Highway 17 east of Ottawa. All tests have been concerned with a rather shallow surface layer. The greatest depth from which samples have been taken is 1. 2m at the Mer Bleue and only 0.4m at Rockland. The tensile stress was applied only in the horizontal direction and the te sts can be characterized as unconsolidated, undrained, controlled stress te s ts ,
According to the field tests at the Mer BleueJ the horizontal tensile
strength of Sphagnum peat varies between 0.36 ton/m 2 and 1. 13 tons
1m
2 (Table I), the mean value being 0.70 ton/m 2 (55 tests). For the laboratory- 20
-2
2
te sts the corresponding limits are 0.40 ton/m and 1. 00 ton/m (Table I I) and the mean tensile strength is 0.66 ton/m 2 (6 tests). The horizontal tensile strength of the Carex peat at Rockland is about 0.6 to L 0 ton/m2•
The rate of loading used in the field tests was generally 2 kg per minute, whereas in the laboratory tests a rate of 2 kg per 24 hours was used. A few field tests were made using a rate of 2 kg per 10 seconds or 2 kg per 5 minutes. No pore pressure measurements were made during the tests. For the drier less decomposed surface peat, rapid tests seem to give smaller strength values than slow tests. Below the ground water level the influence of testing rate is the opposite, as a rapid test here gives
greater tensile strength than a slow test. The difference in the behaviour of the peat at different depths is apparently dependent upon the influence of the pore water pressure as the peat below the ground water level is saturated. The great difference in the permeability of almost undecomposed peat and more humified peat makes the time dependence more pronounced in the humified peat.
The direct tension te sts have been supplemented by beam te sts using simply supported beam specimens 35 to 40cm long and spanning 25cm or 30cm (Figures 3 and 4). The mean flexural strength, calculated assuming that the peat behaves as an elastic material, is about 2.2 times the mean tensile strength measured in the tension box apparatus. If the peat is assumed to behave as a plastic material, the flexural strength will be
smaller, its mean value being 1. 5 times the mean tensile strength. The re suIts of the individual beam te sts are pre sented in Table I I1.
The mean shear strength of the Mer Bleue peat, determined by a 4-bladed vane with a diameter of 10cm and a height-diameter ratio of 2, is 1. 40 tons/m 2 or twice the mean tensile strength. The undrained shear strength is thus of the same order of magnitude as the flexural strength calculated on the basis of the theory of elasticity.
Experience from field and laboratory tension te sts carried out thus far indicates that the use of nail plates presents a practical solution to the problem of transferring tensile stres s to a peat specimen. On the other hand it is evident that the stress distribution in the specimen is far from uniform. This drawback is even more pronounced if the cross-section in the middle of the sample is reduced through a vertical cut on both sides of the specimen. Nail plates are therefore not recommended in any tests where the main purpose
is to study the tensile deformability of the soil. In this case the te st specimen should be subjected to a more uniform tensile stress, for example by freezing the ends of the specimen to two undercooled metal plates.
The negative pore-water pressure set-up in the middle of a specimen influences the test results especially in a rapid tension test. This influence should be studied by careful pore pressure measurements during tests with different rates of stress application. Pore pressure measurements are also recommended for determination of the progress of consolidation and the appropriate stress rate in consolidated undrained and drained tension tests. Special drainage measures (filter-plates or filter-nails) should be taken in order to speed up the progress of
con-solidation in such a test.
A detailed interpretation of the results of a beam test presupposes a knowledge of the stress-strain properties of the material in both tension and compression. Beam tests should therefore be supplemented not only by direct tension tests but also by unconfined compression tests. Pore
pressure measurements in different parts of the beam would also be useful for a correct interpretation of the beam test results.
ACKNOWLEDGEMENTS
The tension tests described in this report were carried out during the authorIs term as a visiting scientist at the Division of Building Research,
National Research Council, Ottawa. The field tests at Mer Bleue were made with the assistance of Mr. J.L. Boyd and Mr. K. Timmins. Mr. 1. C.
MacFarlane, Research Officer, has been of valuable help both during the field tests and in the preparation of this report. The author expresses his gratitude to these and other colleague s at the Soil Mechanics Section, who have facilitated the field and laboratory investigations described in this report.
REFERENCES
Anderson, K. O. and R. A. Hemstock 1959. Relating the engineering properties of rnuskeg to some problems of fill construction. Proc. 5th Muskeg Res. Con£. NRC, Assoc. Committee on Soil and Snow Mechanics, Tech. Memo. No. 61. Ottawa.
- 22
-Drnovsek, Jg 1966. Discussion. Soil properties - shear strength and consolidation. P'r oc , 6th Int. Coni. Soil Mechanics and Foundation,
'I'or onto.Vol , III, p. 382g
Flaate, K. 1966g The classification of peat and peat deposits for engineering
purposes. Pr o c , 11th Muskeg Res. Coni. NRC, Assoc. Committee
on Soil and Snow Mechanics, Ottawa. Tech. Memo. No. 87.
Forrest, J. B. 1967. Field Studies of the Consolidation Re sponse of Peat. NRC/DBR Internal Report (In press).
Haefeli, R. 1944. Erdbaumechanische Probleme im Lichte der Schneeforschung. Mitteilungen aus der Versuchsanstalt fur Wasserbau an der ETH, No.7, Zurich.
Hanrahan, E. T. 1952. The mechanical properties of peat with special
reference to road construction. The Institution of Civil Engineers of Ireland. Trans. Vol. 78, No.5, Dublin.
Hanrahan, E. T. 1964. A road failure on peat. Geotechnique, Vol. XIV, No.3, London.
Hasegawa, H. and M, Ike uti, 1964. On the tensile strength test of disturbed soils. Intern. Sym.p. on Rheology and Soil Mechanics, Grenobl e. He Ie ne Iund , K. V. 1953. Stability and failure of the subsoil with special
reference to railway embankments in Finland, State Institute for Technical Research. Publication No. 24, Helsinki, Finland. Helenelund, K. V. 1967. Vane tests and tension tests on fibrous peat.
P'r o c , Conf, on Shear Strength of Natural Soils, Oslo, Norway. Kapl ar , C. W. 1966. Laboratory determination of the dynamic moduli of
frozen soils and of ice. Proc. Intern. Coni. on Permafrost,
National Academy of Sciences, Washington, D. C., P> 295.
Kelly, A. and W. R. Tyson, 1965. Tensile properties of fibre-reinforced metals. Me ch , Phys. Solids, Vol. 13, pp. 329-350.
Korchunov, 1946. Bearing capacity of deposits. Torfyanaya Promyshlennost No.9, p 22. Bord Na Mona. E. S. Transl. No.4.
Lukkala, O.J. and M. J. Kotilainen, 1945. Soiden Ojitus-Kelpoisuus. Ke skusrne ria s e ur a Tapio, P> 34. Helsinki, Finland.
MacFarlane, 1. C. 1958. Guide to a field description of muskeg (based on the Radforth classification system), NRC, Assoc. Cornrnittee on Soil and Snow Mechanics. Tech. Memo. No. 44, Ottawa. MacFarlane, 1. C. 1961. Evaluation of road performance over muskeg
in Northern Ontario (II). Proc. VI, Muskeg Research Con-ference, NRC, Assoc. Committee on Soil and Snow Mechanics,
Tech. Memo. No. 67, p.44, Ottawa.
Meyerhof, G. G. 1960. Bearing capacity of floating ice sheets. Proc. Am. Soc. C'iv, Eng. (EMS), Paper No. 2627.
Meyerhof, G. G. 1962. Load-carrying capacity of concrete pavements. P'r o c , Am. Soc. C'iv , Eng. (SM3). Paper No. 3174.
Miyakawa, 1. 1959. embankment.
On the stability of soft peaty ground under an earth Civil Eng. Res. Inst; Rept. No. 21, Sapporo.
von Moos, A. 1961. Rutschungen eines Strassendammes in einem
Torfgebiet bei Sargans, Kanton St. Gallen. Strasse and Ve r keh r , No. I, 1961, p. 5.
Morrison,!. F. 1937. Notes on the science of solid materials. Ann Arbor, Michigan.
Nevel, D. E. 1961. The narrow free infinite wedge on an elastic foundation. Cold Regions Research and Engineering Laboratory. Research Report No. 79. Hanover, N.H.
Ripley, C. F. and C. E. Leonoff, 1961. Embankment settlement behaviour on deep peat. P'r o c , 7th Muskeg Res. Coni. NRC, Assoc. Committee
on Soil and Snow Mechanics. Tech. Memo. No.7 1. P> 193, Ottawa. Schiffrrian , R. L. and B. D. Aggarwala, 1960. Stresses and displacements
produced in an elastic half-space by an elliptic punch. Rensselaer Polytechnique Institute, Troy, N. Y.
- 24
-Shook, W. B. 1963. Critical survey of mechanical property test methods for brittle materials. Engineering Experiment Station, Ohio State University. Tech. Documentary Repor t No. ASD-TDR-63-49l, p. 27, Columbus, Ohio.
Smith, A.H. V. 1950. A survey of some British peats and their strength characteristics. Army Operational Research Group. Report No. 32/49.
Suklje, L. and J. Drnovsek, 1965. Inve stigation of the tensile deformability of soils using hollow cylinders. P'r oc , 6th Intern. Conf, on Soil Mechanics and Foundation Eng. Vol. 1, p. 368. Toronto.
Thurber, R. C. 1965. Some methods of construction in peat bogs and swamps in British Columbia. P'r oc , lOth Muskeg Res. Conf, NRC, Assoc. Committee on Soil and Snow Mechanics. Tech. Memo. No. 85. p, 61, ottawa.
Ward, W. H. 1948. A slip in a flood defence bank constructed on a peat bog. P'r o c , 2nd Intern. Conf. on Soil Mechanics and Foundation Engineering. Vol. 2,
p,
19. Rotterdam, The Netherlands.Wu, T. H. , A. K. Loh , and L. E. Malvern, 1963. Study of failure envelope of soils. P'r oc , Am. Soc. of Civil Eng. Vol. 89 (SMl), P> 145.
RESULTS FROM FIELD TENSION TESTS ON SPHAGNUM PEAT AT MER BLEUE. OTTAWA
Depth Water Unit Classification Tensile strength (tons/m.2) Numbe r
(m.) content':' weight 3 (von Post) of te sts
0/0 (tons1m. ) Variations Mean value
0.0 - 0.2 704 - 686 0.57 - 0.94 H l_ 3B3F2R2 VI 0.38 - 0.70 0.50 5 0.2 - 0.4 686 - 1168 0.94-0.96 H B F R V 0.36-0.94 0.63 29 4-5 3 2 2 1-2 0.5 - 0.7 823 - 1135 0.89-0.96 H B F R V 0.51 - 1. 13 0.88 5-6 3 2-3 2 1-2 9 0.7 - 0.9 853 - 1056 0.92 - 0.097 H B F R V 0.67 - 1.00 0.86 4 6-7 3 2 2 1 0.8 - 1. 0 927 - 1056 0.92 - 0.97 H B F R V 0.52 - 0.90 0.78 5 6-7 4 2 2 1 1.0-1.2 899 - 1007 0.94 - 0.98 H B F R V 0.70 - 1.00 0.81 7-8 4 2 2 1-2 3 ..
TABLE II
RESULTS OF LABORATORY TENSION TESTS ON PEAT SAMPLES
Location Depth Type of C1as sification Water ':< Tensile strength
(ITl) Peat (von Post) Content (tons/ITl 2)
Mer B1eue 0.30 Sphagriurn H B F R V 1125 0.67
4-5 3 2 2 1 \I
"
0.60"
H B F R V 1146 1. 00 5 3 2 2-3 1"
\I 0.80"
H6_ 7B 3F2R2 VI 1041 0.53"
\I 0.90"
H 7B4F 2_3R2 VI 1034 0.74"
"
1. 05"
H 7B4F2R2 V 1-2 0.63 \I \I 1. 10"
H BF RV 1008 0.40 7 -8 4 1-2 1 1 Rockland O. 10 Carex H B F R V 390 0.87 2-3 2 2 2-3 1 \I 0.30"
H 4B 2F lR2V 1-2 357 0.64':< Water content in per cent of dry weight
RESULTS OF BEAM TESTS ON PEAT FROM MER BLEUE
Bending moment Section Modulus
2
Sample Depth Flexural strength (ton/m )
No. (m) at failure (kg/ern) (em 3)
M M 0 0 q p e p
33
0.30
14.8
62.5
562
1. 37
0.91
34
0.30
11. 3
62.5
562
1. 31
0.87
35
0.30
11.3
57.0
562
1. 22
0.81
42
0.65
10.0
75.0
667
1. 28
0.85
43
0.65
8.5
43.7
283
1.85
1.23
44
0.65
10.5
68.8
350
2.26
1.51
45
0.65
21. 0
22.5
350
1.24
0.83
46
0.65
22.5
37.5
562
1.07
0.71
47
0.65
14.8
81.2
562
1. 71
1. 14
48
0.65
14.8
75.0
562
1. 60
1. 07
56
0.60
22.5
82.5
562
1. 87
1.25
57
0.60
22.5
90.0
562
2.00
1. 33
TABLE IV
DEFORMATION MODULI OF SPHAGNUM PEAT ACCORDING TO FIELD TENSION TESTS AT MER BLEUE
2 2
Depth Tangent rno dul us E (kg / CITl ) Secant m odulu s E
2(kg/cITl )
(ITl)
a
Variations Mean value Variations Mean value
0.0-0.2 2.3 - 5.2 3.4
I
1.6- 2. 1 1.9I
0.2 - 0.4 3.9 - 16.5 9.9I
2.9 - 9.9 6.2 0.5 - 0.7 7.1-22.1 13. 1 4.3 - 13.3 7.3 0.7 - 0.9 6.0 - 18.8 11.5 3.9 - 9.3 5.9 0.8 - 1.0 4.4 - 19.7 12.7 3.4 - 9.8 6.3 1.0 - 1.2 5.4-27.3 13.5 2.9 - 15.5 7.7CLASSIFICATION OF PEAT ACCORDING TO VON POST
H
B F R VDegree of Relative Number of Number of Quantity of
Decomposition Moisture Fibres Root threads Wood
Content
H
1 Undecomposited Bl F0 R0 V0
HZ
Almost un- Air dry No fibres No root No remaindersdecomposited observed threads of wood
H
3 Very little B F l R l V
de c orripo site d
Z
1H
4
Slightlyde-Somewhat Only few Only few Only few (small)
dried fibres seen root threads remainders of
cornpo sited
wood
H
S
Somewhat de- B3 F R V2composited 2 2
Normal Plenty of Plenty of root Plenty of wood
H
Rather decom-I
moisture contact fibres threadsremainders
6
positedH
7
Fairly wellB
4
F3 R 3 V3 decompositedWet Fibres forming Root threads Very much wood
H
Stronglydecom-8 main part of forming main remainders
posited
peat part of peat
H
9
Almost fully,
B decomposited II 5 I Very wetH
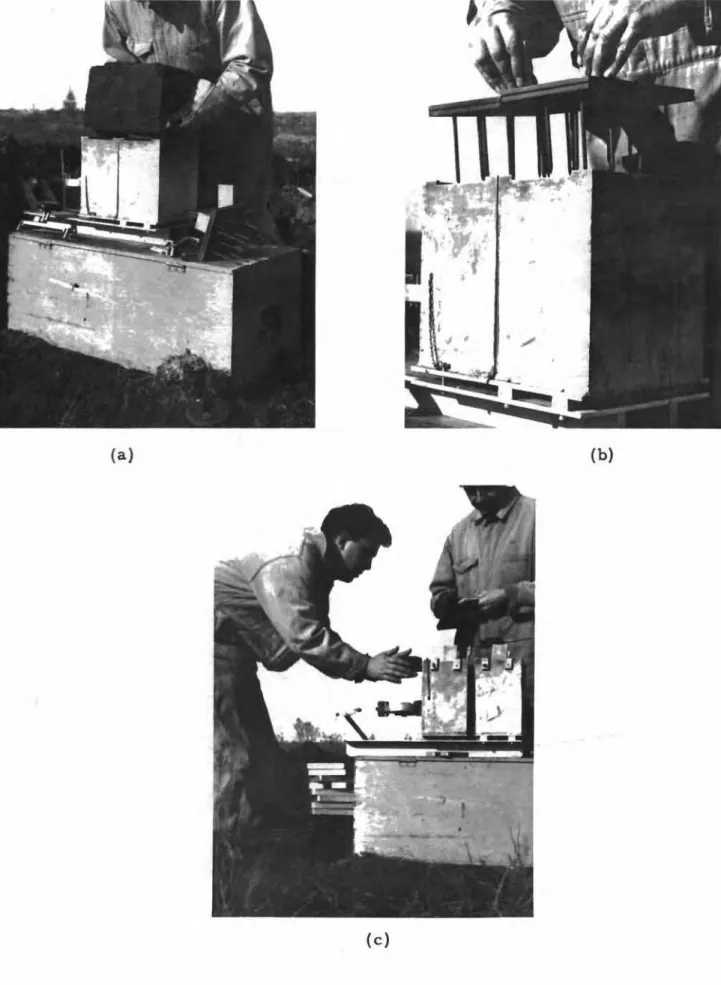
Fully decom-10 po si.ted EXAMPLE: H 4B F R V 3- 3 2 1 0(c)
Figure lB. Tension box tests at the Mer Bleue. Installation of peat sample and top nail plates (a and b). Tension test at point of failure of the sample (c).
,.
Figure 2. Failure surface in peat sample after a tension test on fibrous peat.
(a) (b)
(b)
O.7r---r----.--,.--r----.--,.-.,--,.-,.--,--,.-r--r----.--T--r-...,.-r--r-...,
( A)
0.6 N Depth: 10c m ... , 5.
..
-_·4
-,-'
--'
---'
__ .--'
_----1
.
---. ...- _-- _ - 2 セN
,
. / . , . , . - - ----.'
/ '....
"-
---....
/ " ---. , / / ---. ---. ---. ---.--.. v,,'" _____
:"
, / :'/ /
t- / ;' 1/ : '1/NセGGャ
0.1 VI セ 0.2 I -Vl04 V I ' w a::: I -VI 0.3 w ....J セ-
セ 0.5 o I -0 10 20 30 40 0.7 .' ... "8( B)
0.6 6 N セ-
VI0.5 z 0 I -viO.4 VI w a::: I -VIO.3 w ....J VI セ 0.2 I -0.1 Depth: 30cmo
5 10 STRAIN, MM 15 20 FI GURE 5STRESS-STRAIN CURVES FOR SPHAGNUM PEAT, MER BUllE XTjXWセ -I
20 Depth: 30cm IS 10 5 / / .159 ---10 /
...
...····.NOOセᄋMQT"
/
-:
/,,"
."
. /
I
ZZGNセ
__ .._ ..
13
/
;"/// / /..
.
セ / '/
Oセ
"
{
:::'/;/
:; . / '-:
:"A
.Fif' //
.I /'
I :
.;
I ..
OIL...-'O"-...----'-_L...--I--...----'-_L....-....L..-...--'-_L...-....L..-..._ ' O " -...- Jo
V') Z o I -V') V') .... 0.5 0:: l -V')....
...J V') z....
I -N( B)
Size of samples: 20 x 15 x 20cm 3 20 Depth: 30cm 15 10 STRA I N, MM 5..l2._----;;--18
,.--....
.---
.... - - - - _._._·20 BNNNNMZZMZMZセ ,.---
..--,---.---
.---.-"
'"
.' -N ::: V') z 0 l-.
V') V') w 0.5 0:: l -V')....
...J V') Z W I -FIGURE 61.0 N セ V) Z 0 l
-.
V) V) ILl 0.5 c::: l -V) ILl ...J V) Z ILl I-o
( A)
...27 25 _-26,-"""----: »,-"""----:,-"""----:
: / / :/ - , - · _ · 2 2 / _ . - ' 24 I' ... . . -セ...
/
t / /'/-"
"
./1 / /
.:.
.,
/
セGャO
V
Cross section of sample: 100-200 cm 2 Depth: 30cm1.0