Characterization of Metamict Structures
by Electron Diffraction and Microscopy
by
Lu-Chang Qin
Submitted to the Department of Materials Science and Engineering
in partial fulfillment of the requirements for the degree of
Doctor of Science
in Materials Science
at the
MASSACHUSETTS INSTITUTE OF TECHNOLOGY
May 1994
@
Massachusetts Institute of Technology 1994. All rights reserved.
Author ...
...
T..
...
...
...
Department of Materials Science and Engineering
April 29, 1994
Certified by ...
...
Linn W. Hobbs
John F. Elliott Professor of Materials
Thesis Supervisor
Accepted by ...
...
. -
...
Carl V. Thompson II
Professor of Electronic Materials
Chair, Departmental Committee on Graduate Students
Science
MASSACHuiSEG T INSTTU"TE
Characterization of Metamict Structures
by Electron Diffraction and Microscopy
by
Lu-Chang Qin
Submitted to the Department of Materials Science and Engineering on April 29, 1994, in partial fulfillment of the
requirements for the degree of Doctor of Science
in Materials Science
Abstract
Quantitative high-resolution electron microscopy and electron amorphography were used to investigate the metamictization of crystalline silica precursors and the struc-tures of metamict silicas. Various polymorphs of crystalline silica, including quartz, cristobalite and tridymite, were examined, as well as some other forms of aperiodic silica such as vitreous silica, thermally-grown, and CVD-grown silica films on silicon substrates.
Two major morphologies were observed in the crystalline-to-metamict transfor-mation: in one, gradual transformation occurred without sharp boundaries visible between crystalline and metamict regions in images; in the other, sharp boundaries were visible. In quartz, both morphologies were observed, but in cristobalite and tridymite only the former was observed. Both forms of morphological evolution in quartz were attributed to nucleation-and-growth of amorphous inclusions via radi-olysis. The appearance of a gradual transformation arises because the crystalline-mietamict boundary is not parallel to the incident electron beam direction.
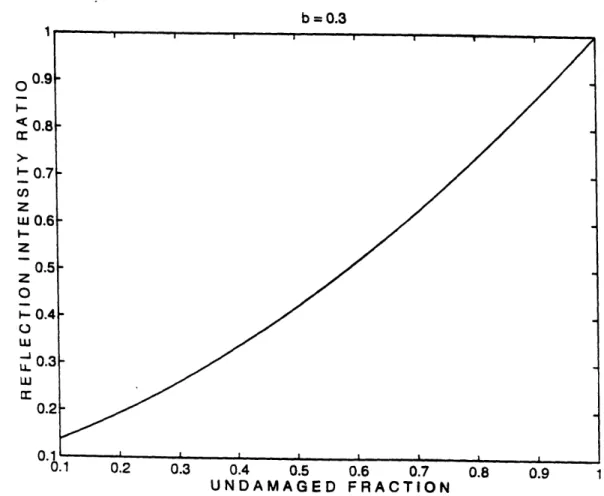
Systematic image simulations were carried out to aid in the interpretation of experimental micrographs. It was also found that when the crystalline portion is greater than about one third of the specimen in thickness, the image may appear to be from wholly crystalline material, and the amorphous portion may not be detected in the images.
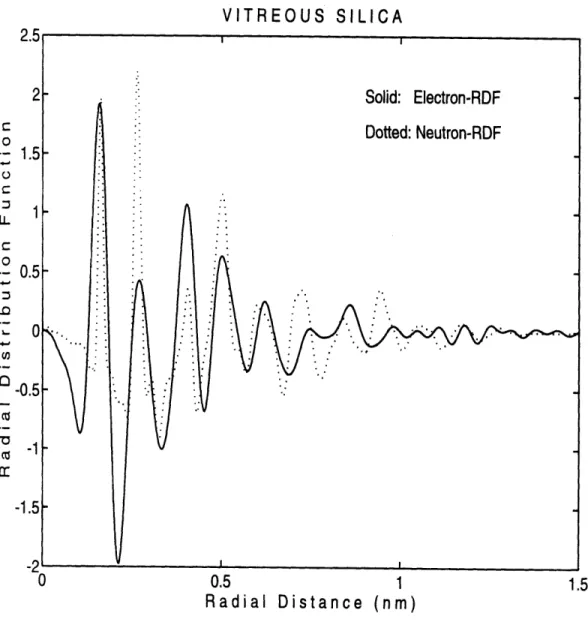
Electron amorphography was developed and performed using energy-filtered elec-tron diffraction data from the metamict states, collected in a scanning transmission electron microscope equipped with an electron energy-loss spectrometer. Exact for-mulae and numerical procedures were established to use the data to obtain radial distribution functions to characterize the metamict structures at the atomic level. By comparing the radial distribution functions for vitreous silica, electron-metamict quartz, and neutron-metamict quartz, it was found that, in the metamict states, a continuous-random-network structure was mostly preserved, but the coordination number for Si-O bonding was reduced in electron- and neutron-metamict quartz
sam-ples.
In metamict cristobalite and metamict tridymite, the continuous random network structure was found to have been preserved also. Similar features were also recogniz-able in amorphous Si0 2 thin films grown on Si substrates.
A new theory for the relationship of the first sharp diffraction peak to medium-range order in terms of ring contents is proposed. For electron metamict silicas, it is suggested that six-membered rings are indeed the dominant ones, as indicated by the position of the first sharp diffraction peaks in various samples. In Si+
ion-implanted quartz, however, the dominant rings are deduced to be of smaller size, which is consistent with the fact that the final product is Si rich.
In comparison to X-ray and neutron amorphographies, electron amorphography of-fers certain unique features and advantages; for example, imaging can be performed si-multaneously to provide complementary structural information and statistically valid data can be collected from microvolumes or thin films.
Thesis Supervisor: Linn W. Hobbs
Acknowledgments
I would like to express my gratitude for the privilege of being able to work under Pro-fessor Linn W. Hobbs, who introduced me to the subject of this thesis, and provided valuable advice and encouragement during the course of the work.
I am most grateful to Professor E.L. Thomas and Professor B.J. Wuensch for their having agreed to serve on my thesis committee and for their helpful comments.
Without the generous help and cooperation of many others, the present thesis would not have been completed as of now; in particular I would like to record my indebtedness to the following individuals:
Dr. A.J. Garratt-Reed for assistance on collecting data in the HB5 STEM and use of the Electron Microscopy Facility; Dr. Carl Francis of the Harvard Mineralogical Museum for loaning the cristobalite and tridymite samples; Dr. D.L. Griscom of the Naval Laboratory for providing the vitreous silica (Supersil-W) material; Dr. A. Nakano of the Louisana State University for providing the atomic coordinates of vitreous silica; Ms. Lisa Su of the MIT Department of Electrical Engineering and Computer Science for providing the amorphous SiO2 thin films.
Current occupants of the MIT Room 13-4005, Messrs. Kin Ha, Michael Liberatore, A_.N. Sreeram, and Chong Seung Yoon are also acknowledged for their friendship which has helped make my life at MIT memorable.
I would also like to thank MIT for a Sir Run Run Shaw Fellowship and the US ]Department of Energy, Office of Basic Energy Sciences, for Research Assistantships made available through grant DE-FG02-89ER45396.
Contents
1 Introduction 17
1.1 Motivations for Study ... ... 18
1.2 Radiation Damage ... ... 19
1.2.1 Knock-on damage ... 19
1.2.2 Radiolysis ... ... 20
1.3 Structure of Silica and its Polymorphs . ... 21
1.3.1 Q uartz . . . . . . . 23
1.3.2 Tridymite ... ... ... 23
1.3.3 Cristobalite ... . . .... ... .. 29
1.3.4 Topological descriptions ... . . . . 31
1.3.5 Vitreous silica ... ... . ... 33
1.3.6 First Sharp Diffraction Peak ... 36
1.4 Radiation Damage in Silicas: Literature Review . ... 37
1.4.1 Effects of neutron irradiation . ... 37
1.4.2 Effects of electron irradiation . ... ... 40
1.5 Objectives of the Present Study . . . ... .. . . 42
2 Experimental 43 2.1 Specimens ... ... ... 43
2.2 Irradiations . . . .. . . . ... . . .. .. .... . 46
2.3 Specimen Preparation ... .. ... 48
2.3.1 Quartz and vitreous silica . ... ... . . . 48
2.3.3 Silica thin films ... 2.4 Experimental Facility ...
3 Electron Amorphography 3.1 History and Overview ...
3.2 RDFs for Disordered Systems
3.3 3.4 3.5 3.6 3.7 3.8 3.9 3.10 3.11 3.12
Atomic Scattering Amplitudes . . . . Scattering from Disordered System Temperature Effect ...
Single Component System . . . . Multiple Components System . . . . Binary System ...
Partial Radial Distribution Functions Warren Approximation ...
Modification Functions ... Numerical Windows ... 3.13 Scattering from Crystals
3.14 Scattering from Partially Disordered System . ...
4 High-Resolution Electron Microscopy
4.1 History and Overview ...
4.2 Image Formation ... ... ...
4.3 Electron W aves ... .... ...
4.3.1 Bloch wave formulation . . . . 4.3.2 M ultislice formulation ...
4.4 Contrast Transfer ... ...
4.5 Image Simulations ... ... 4.6 HREM Simulation for Aperiodic Materials . . . .
4.7 HREM Image Analyses ... ...
4.7.1 Digital diffractometry ... ... 4.7.2 Auto-correlation . .. ... .... .. .. ... ... ... .. 53 . . . . 53 . . . . . . . . . . 5 5 . . . . . . . . . . 57 . . . . . . . . . . . . . 6 1 . . . . 6 1 . . . . . 64 . . . . . 6 8 . . . . 7 1 . . . . . 76 . . . . 7 8 . . . . 7 9 . . . . 8 1 . . . . . 8 3 94 97 97 101 107 112 113 115 115 118
5 Results
5.1 HREM of Vitreous Silica . . . .. 5.2 RDFs for Vitreous Silica .. . . ...
5.3 Electron-Irradiated Quartz . . . . 5.3.1 SAEDPs ... . ... .
5.3.2 HREM of a-quartz ...
5.3.3 HREM of metamict inclusions . . . . . 5.3.4 HREM of metamict quartz ...
5.3.5 HREM image analysis: power spectra . 5.3.6 Numerical simulations . . . . 5.3.7 HREM image analysis: auto-correlation 5.3.8 Radial distribution functions . . . . 5.4 Neutron-Irradiated Quartz ...
5.4.1 SAEDPs ... ...
5.4.2 RDFs ... ...
5.4.3 Effect on annealing . . . . 5.5 Ion-Implanted Quartz . . . . 5.6 Electron-Irradiated Tridymite and Cristobalite 5.7 Amorphous SiO2 Thin Films on Si Substrates
119 119 124 129 .. .. . . ... 129 . . . 132 . . . . 137 . . . 148 . . . . . 165 . . . . . 171 functions ... 182 . . . . 187 . . . 190 .... 190 . . . . 191 . . . . 191 . . . . 194 . . . . 194 . . . . 203 205 . . . . 205 ... . 207 ... . 209 . . . . 210 ... . 213 . . . . 216 . . . . 217 6 Discussion
6.1 Termination Effects in RDF Deduction . . . . 6.2 Partial RDFs ... . ... . .... 6.3 Coordination Numbers ... ... .. 6.4 Dynamical Scattering Effect in Amorphous Materials . . . . . 6.5 Medium-Range Order ... ...
6.6 Mechanisms for Metamictization . . . .
6.7 Comparison of Neutron, Electron, and X-Ray Amorphography
Bibliography 222
A Symbols and Sign Conventions 238
List of Figures
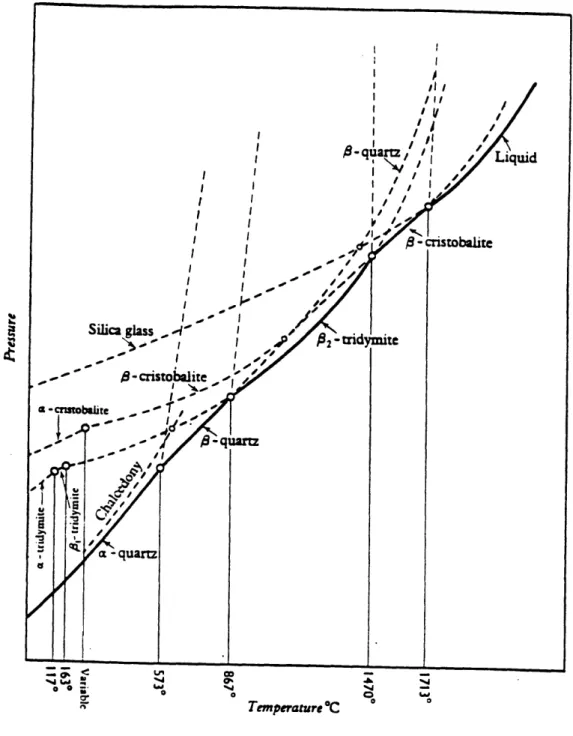
1-1 Phase diagram of silica (after Fenner 1913). . ... 22 1-2 Connection of SiO4 tetrahedra in corner-sharing network structures of
SiO2. . . . . . . . . . . . . . . 24
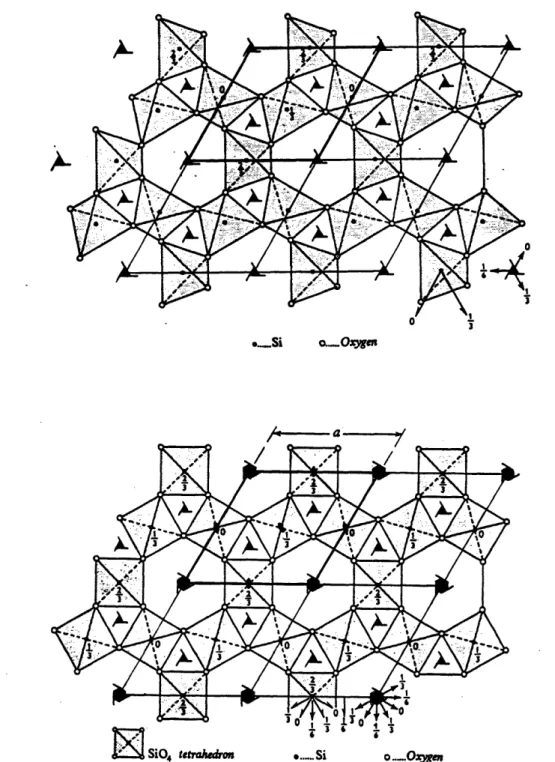
1-3 Crystal structures of (a) o- and (b) 3-quartz (after Deer et al. 1963). Bold lines outline a unit cell in the a, b plane. . ... 26 1-4 (a). Crystal structure of 0-tridymite in [001] projection (after Deer et
al. 1963). A unit cell in the a, b plane is outlined in bold lines. . . . 27
1-4 (b). Crystal structure of 0-tridymite in perspective (after Smyth and Bish 1988) ... 28 1-5 Crystal structure of,3-cristobalite. (a) a-cristobalite and (b) 0-cristobalite
(after Deer et al. 1963). ... .. 30 1-6 Primitive rings of (a) three-fold; (b) four-fold; (c) five-fold; (d) six-fold;
(e) seven-fold; and (f) eight-fold. ... . . . 32 1-7 (a) Zachariasen model for oxide glasses (after Zachariasen 1932) and
(b) corresponding figure in the form of triangle rafts (after Shackelford 1983). ... . ... 34 1-8 Denisty changes of silicas as a function of irradiating fluence of neutrons
(after Lell et al. 1966) . . . . . . . .. . 38 2-1 Geometry of cutting of quartz samples. . ... 44 2-2 Important crystallographic directions and planes of a hexagonal lattice. 45 2-3 Selected-area electron diffraction from quartz crystals. (a) X-cut, (b)
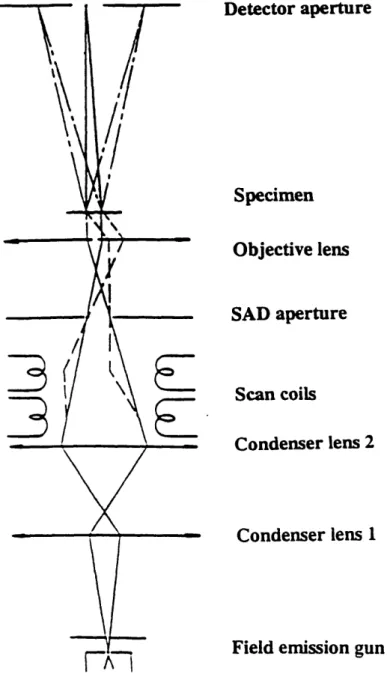
2-4 Schematic diagram of the selected-area diffraction mode in VG HB5
STEM ... .... ... 50
2-5 Digital display of the (hOO)* Bragg reflections from Z-cut quartz. . ... 51
3-1 Electron atomic scattering amplitudes for Si and 0. . ... 60
3-2 Cosine transforms of modification functions. (a) Step function; (b) Lorch modification function ... 82
3-3 Ratio of atomic scattering amplitudes for Si and 0. . ... 84
3-4 Numerical window functions for SiO2. . . . 85
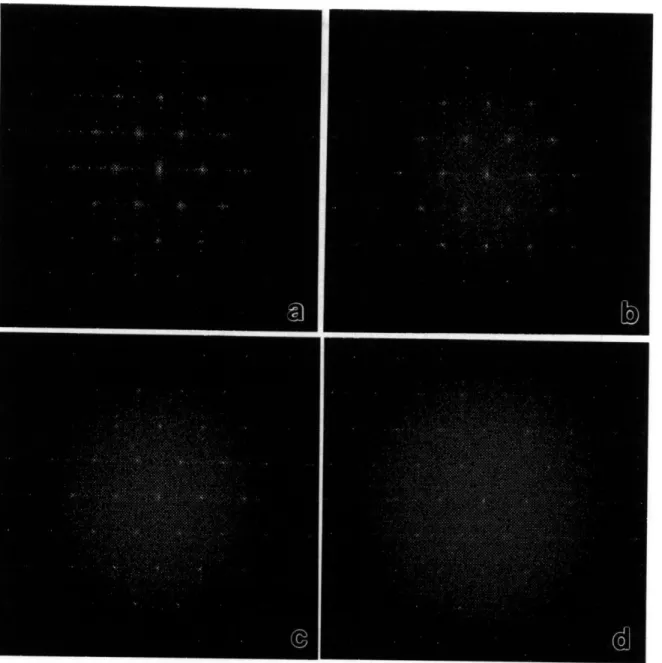
3-5 Composite models with randomly distributed scattering points added to a crystalline patterns with increase numbers p. (a) p = 0; (b) p = 0.31; (c) p = 1.24; (d) p = 2.79 ... ... 89
3-6 Corresponding diffractograms from Fig. 3-5. . ... 90
4-1 Schematic of a TEM in lattice imaging mode. . ... . . . . 95
4-2 Diffraction geometry of Laue case. . ... . 99
4-3 In multislice theory, a slab is divided into many thin slices each of which behaves like a phase grating. . ... 102
4-4 Huygens' principle of wave propagation between slices. . ... 105
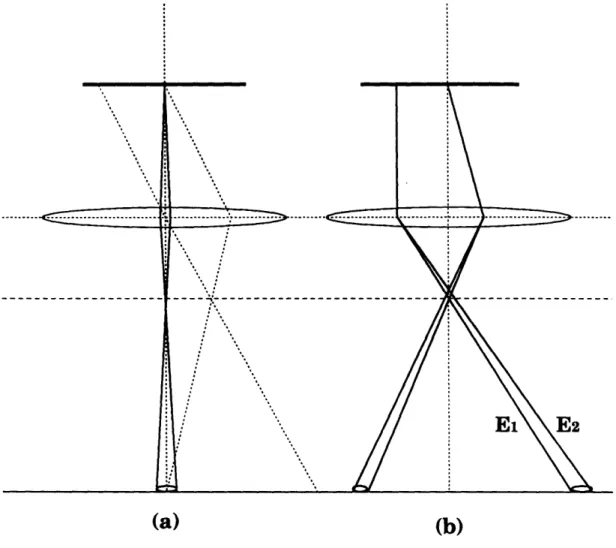
4-5 Schematics illustrating spatial and temporal coherence. (a) partial spatial coherence arising from beam divergence. (b) partial temporal coherence arising from electrons of different kinetic energies El and
E2> E
1). ...
...
110
.4-6 Schematic diagram of the imaging geometry in a TEM. The Laue circle defines the diffraction condition, and the optical center defines origin for the phase shifts caused by the objective lens. . ... 111
4-7 Fading of Bragg reflection intensities from partially disordered structures. 117 5-1 Simulated HREM images of vitreous silica. Horizontal rows are defo-cusing series, and vertical columns are thickness series. (a) Thicknesses: 2.0, 3.9, 5.9, 7.9 nm. Underdefoci: 35, 40, 45, 50 nm; . ... 121 5-1 (b) thicknesses: 2.0, 3.9, 5.9, 7.9 nm. Underdefoci: 55, 60, 65, 70 nm; 122
5-1 (c) thicknesses: 2.0, 3.9, 5.9, 7.9 nm. Underdefoci: 75, 80, 85, 90 nm. 123 5-2 Zero-loss energy-filtered electron diffraction intensity (dotted line) data
for v-Si0 2 and the incoherent scattering intensity (solid line)... 125
5-3 Interference function for v-SiO2 obtained from (a) neutron diffraction (Wright 1990); (b) X-ray diffraction (Mozzi and Warren 1969); and (c) electron diffraction (Qin et al. 1992). . ... . . . 126
5-4 Deduced reduced RDFs for v-Si0 2 using electron diffraction data (solid) and neutron diffraction data (dotted and scaled by multiplying 1/30). 128 5-5 Low-magnification bright field micrograph showing the transitional morphology during metamictization of quartz under electron irradi-ation. Strain contrast is visible around the inclusions. ... . 130
5-6 Selected-area electron diffraction patterns from irradiated quartz. (a) crystalline state; (b-e) mixed states; and (f) metamict state. ... 131
5-7 (a) Lattice image of Z-cut quartz and (b) projected crystal structure. 133 5-8 Simulated images of Z-cut quartz in underfocusing series (horizontal rows) and thickness series (vertical columns). . ... . 134
5-9 (a) Lattice image of X-cut quartz and (b) projected crystal structure. 135 5-10 Simulated images of X-cut quartz in underfocusing series (horizontal rows) and thickness series (vertical columns). . ... . . 136
5-11 Electron micrograph of irradiated quartz showing nucleation-and-growth of a metamict inclusion. (a) Initial formation of inclusion; ... 139
5-11 (b) inclusion grows; ... ... . 140
5-11 (c) inclusion grows bigger; ... .. 141
5-11 (d) metamictization completed. . ... .. 142
5-12 Selected-area diffractograms from strained inclusion. (a) Diffractogram of the whole image; (b) selected area containing lattice around an in-clusion; (c) diffractogram from selected area (b); . ... 143
5-12 (d) diffractogram of whole image at a later stage; (e) selected area containing the inclusion; (f) diffractogram from selected area (e). . . . 144
5-13 Simulated HREM images from metamict inclusions of fixed size. (a) Model structures; (b) t = d; (c) t = 1.5d; (d) t = 2.0d; and (e) t = 2.5d;
where t is the specimen thickness and d = 2.0 nm is the diameter of the spherical inclusion. ... .. . ... .. 146 5-14 Simulated HREM images with metamict inclusions of increasing sizes
at constant sample thickness of 4.9 nm. (a) Model structures, and (b-g) simulated corresponding HREM images. . ... 147 5-15 Simulated HREM images when the location of metamict inclusion
varies. (a) Model structures, and (b-i) simulated corresponding HREM images ... ... ... 149 5-16 Formation of metamict inclusions of about 20 nm in diameter in X-cut
quartz during in-situ electron irradiation. (a) Early stage of formation; 150 5-16 (b) metamict inclusion grows; . ... ... 151 5-16 (c) metamict inclusion coalesced with adjacent metamict region; . . . 152 5-16 (d) metamictization completed. . ... .. 153 5-17 HREM image of Y-cut quartz during the crystalline-to-metamict
trans-formation. Inset is the corresponding selected-area electron diffraction pattern. ... 154 5-18 HREM images showing the nucleation-and-growth of metamict
inclu-sions during electron irradiation. (a) Perfectly crystalline states; . . . 156 5-18 (b) partially damaged; ... 157 5-18 (c) m ore disordered; ... 158 5-18 (d) completely amorphized. . ... .... 159 5-19 Simulated HREM images. Vitreous silica on top with increasing
thick-nesses vertically while the total specimen thickness is maintained con-stant (8.6 nm) ... ... 160 5-20 Simulated HREM images. Crystalline quartz on top with increasing
thicknesses vertically while the total specimen thickness remains con-stant (8.6 nm). ... .. .... . .. ... .. 161
5-21 Simulated HREM images of amorphous-crystalline composite model of total thickness of 17.2 nm at underfocusing of 45 nm. Top layer is amorphous with increasing fractions from 1/16 (top left) to 16/16
(bottom right) ... ... 163
5-22 Simulated HREM images of amorphous-crystalline composite model of total thickness of 17.2 nm at underfocusing of 45 nm. Top layer is crystalline Z-cut quartz with decreasing fractions from 15/16 (top left) to 0/16 (bottom right) ... 164
5-23 Diffractograms from images of progressively metamictizing quartz. (a) Diffractogram from Fig. 5-18(a) image; . ... 166
5-23 (b) Diffractogram from Fig. 5-18(b) image; . ... 167
5-23 (c) Diffractogram from Fig. 5-18(c) image ; . ... 168
5-23 (d) Diffractogram from Fig. 5-18(d) image. . ... . . 169
5-24 Contrast transfer function of 002B TEM at Scherzer focus. ... 172
5-25 Patterns of random local displacements introduced in a crystalline lat-tice with increasing fractions p at maximum amplitude 0.5 of the latlat-tice parameter. (a) Perfect lattice (p = 0) ; (b) p = 0.1; (c) p = 0.2; (d) p = 0.3; ... ... 174
5-25 (e) p - 0.4; (f) p = 0.5; (g) p = 0.75; and (h) completely disordered (p =1.0). ... 175
5-26 Corresponding diffractograms from the patterns shown in Fig. 5-25. (a) Perfect lattice (p = 0) ; (b) p = 0.1; (c) p = 0.2; (d) p = 0.3; . . . 176
5-26 (e) p = 0.4; (f) p = 0.5; (g) p = 0.75; and (h) completely disordered (p= 1.0). ... 177
5-27 Patterns of evenly distributed random displacements introduced in a crystalline lattice with increasing amplitudes A throughout the whole pattern. (a) Perfect lattice (A = 0) ; (b) A = 0.1; (c) A = 0.2; (d) A = 0.3; ... .... ... ... ... 178
5-27 (e) A = 0.4; (f) A = 0.5; (g) A = 0.75; and (h) completely disordered (A = 1.0). ... ... 179
5-28 Corresponding diffractograms from the patterns of shown in Fig. 5-27.
(a) Perfect lattice (A = 0) ; (b) A = 0.1; (c) A = 0.2; (d) A = 0.3; . . 180
5-28 (e) A := 0.4; (f) A = 0.5; (g) A = 0.75; and (h) completely disordered (A = 1.0). ... ... 181
5-29 Corresponding auto-correlation functions of the HREM images shown
in Fig. 5-18. (a) ACF of Fig. 5-18(a); . ...
.
. 183
5-29 (b) ACF of Fig. 5-18(b); ... ... 184
5-29 (c) ACF of Fig. 5-18(c); ... . ... 185
5-29 (d) ACF (xl0) of Fig. 5-18(a) ... 186
5-30 EFED deduced reduced RDFs for electron-metamict quartz (solid line) and vitreous silica (dotted line). . ... .. 188
5-31 Hobbs--Pascucci model for the radiolytic mechanism in the metamicti-zation of quartz (after Hobbs and Pascucci 1980). . ... . . 189
5-32 Selected-area electron diffraction patterns from neutron irradiated Y-cut quartz with increasing neutron fluence. (a) 1.0 x 10²³ n/rn2; (b) 3.0 x 10²³ n/m 2; (c) 1.0 x 1024 n/m 2; (d) 1.5 x 1024 n/ 2. . . . . . 19 2 5-33 EFED deduced reduced RDFs for neutron-metamict quartz, electron-metamict quartz and vitreous silica. . ... 193
5-34 (a) Zero-loss electron diffraction intensities from 150 keV Si+ ion-implanted quartz (dotted line) and neutron-metamict quartz (solid line); (b) corresponding Zernike-Prins interference functions. ... 195
5-35 In-situ HREM images of fast electron-irradiated tridymite. (a) Per-fectly crystalline; (b-c) partially disordered; and (d) metamict state. . 197 5-36 Corresponding power spectra of the HREM images shown in Fig. 5-35. (a) Perfectly crystalline; (b-c) partially disordered; and (d) metamict state ... . ... 198 5-37 In-situ HREM images of fast electron irradiated cristobalite. (a)
5-38 Corresponding power spectra of the HREM images shown in Fig. 5-37. (a) Perfectly crystalline; (b-c) partially disordered; and (d) metamict state ... ... 200 5-39 Reduced RDFs for electron-metamict tridymite (dotted line) and
cristo-balite (dashed line). The reduced RDF for electron-metamict quartz is also indicated by the solid line, serving as a reference. . ... 202 5-40 Reduced RDFs for SiO2 thin films on Si substrates. Dotted line:
CVD-grown; dashed line: thermally-CVD-grown; solid line: vitreous silica. .... 204 6-1 Effects on the RDFs of truncations for various qmax values. (a) 72.0 rim;
(b) 54.0 nim; (c) 45.0 nm; (d) 36.0 nm; (e) 27.0 nm; (f) 18.0 nm. .. 206 6-2 Values of the determinant [equation (6.2)] for SiO2 system. ... 208
6-3 Electron amplitude of the direct beam plotted against specimen thick-ness. (a) vitreous silica; ... ... 211 6-3 (b) Z-cut quartz. ... .. ... ... .... .. .. . .... ... . 212 6-4 Intensity of Bessel function of order zero. . ... 215 6-5 Triangle raft model showing the crystalline-to-amorphous
List of Tables
1.1 Structural data for polymorphs of silica. . ... 25 1.2 Topological structures of silica polymorphs ... 31 6.1 Comparison of neutron, electron, and X-ray amorphography .... . 217
Chapter 1
Introduction
The term Metamict' was initially introduced in 1893 by Norwegian mineralogist W.C. Brogger [10] in a Danish encyclopedia to classify a new class of naturally occurring amorphous materials (porodine, hyaline and metamikte) which, while retaining reg-ular crystalline habit, exhibited glass-like properties, such as isotropic optical behav-ior, lower than normal density, conchoidal fracture, etc. These phenomena were later found [57] to be the result of damage from recoil a-emitting radionuclides accumu-lating over geologic periods in the specimens in question [37]. In these minerals there are normally appreciable concentration of radioactive elements, such as Th or U, and their decay products display extensive evidence of radiation damage.
The fact that all forms of silicon dioxide under high doses of artificial radiations are transformed to an optically isotropic, glass-like material with virtually identical density [161], thermal expansion, elastic properties and absence of Bragg peaks in diffraction pattern led to the proposal [84, 114] that external particle irradiation also produces a new phase of silicon dioxide which is independent of the original phase
before irradiation - metamict silica.
1
amorphous because of the disruption of the crystal structure by radiation from contained or nearby radioactive atoms [157]
1.1
Motivations for Study
Radiation effects are seen in many materials processing techniques, such as sputter-ing (ion-induced target corrosion), sputter deposition coatsputter-ing, ion implantation in semiconductors, ion-induced mixing of layered materials, to give a few examples. Ir-radiation of materials often alters atomic arrangements. This has important impact on many materials applications, such as nuclear fission power reactors, nuclear fusion systems, nuclear waste isolation media, accelerator targets, apertures, beam pipes, and macroscopic energy storage in irradiated materials, etc. Materials performance may change as a result of irradiation; for example, in micro-electronics where exposure of metal/oxide/silicon (MOS) integrated circuits to ionizing radiation can seriously degrade their performance [109], or other applications such as in nuclear waste stor-age [69] and frequency control [79]. Radiation effects also underlie many modern analytical techniques, such as secondary ion mass spectroscopy, surface analysis by ion beam scattering, and ion crystallography.
Silicas (SiO2) are among the most abundant substances existing in earth. A large fraction of the earth crust contains silicas and allied silicates. Various forms of silica are also the basic constituents of many natural minerals. Technologically silicas are good insulators due to their wide band gap (- 8.0 eV) [60] and they are also important in many applications, especially in microelectronics [156].
Radiation effects in silicas have been long of interest for two major reasons. From the viewpoint of technology, silicas have been widely used in many fields, such as fiber optics, optical lenses, windows, large mirror optics, insulating layer in metal-oxide-semiconductor (MOS) devices, nuclear waste forms, etc., and radiation effects cause significant changes in materials properties. From the viewpoint of science, silicas offer a, simple prototype for beginning to understand more complex systems.
1.2
Radiation Damage
In nature, all materials are being exposed to external irradiations, both electromag-netic and particle bombardment. In the case of particle irradiation, the primary event (primary interaction of the constituents of irradiated material with the incident parti-cles) takes place typically at a time scale of less than 1 femtosecond. The dissipation of the primary kinetic energy normally occurs within the next 0.1 picoseconds or so, while the evolution of the nascest damage state takes typically 0.1 picoseconds to 1 second.
In general, the structural evolution of irradiated materials can be classified into four major phases: (a) collisional; (b) relaxation and thermal equilibration; (c) micro-and chemical structural development; micro-and (d) property changes of the irradiated materials.
There are two fundamental primary events in causing atomic displacements in solid materials under irradiation: knock-on displacement and radiolysis.
.1.2.1
Knock-on damage
In knock-on events, the momentum of incident radiations is transferred to the recoil atoms via mechanical collision. The kinetic energy of the incident particles transferred to the recoiled atoms is governed by the conservation laws for energy and momentum in elastic collisions, where no kinetic energy is transferred into other forms of energy.
The maximum energy that a recoil atom can acquire is [62]
4mMS £
Tm = M)( 1 + ) , (1.1)
(m + M) 2
2mc2
where E is the energy of the incident particle, c is the speed of light, m and M are the masses of the incident particle and the recoil atom, respectively. When the ac-quired energy is high enough, cascade collision damage often occurs, where secondary recoil atoms are also displaced from their equilibrium positions. This mechanism is responsible for atomic displacements in all metallic materials and most inorganic
solids.
When the incident radiation is fast electrons, equation (1.1) becomes [151]
Tm = 2147.75(1.022 + £)/A , (1.2)
where A is the atomic mass number of the recoil atom, and Tm is in eV and E in MeV. For silicas, the threshold energies S for displacement of oxygen (0) and silicon (Si) atoms are about 64 keV and 197 keV, respectively [119], corresponding to displacement energies Tm about 9.3 eV and 18.6 eV, respectively.
However, it does not follow that the predominant damage mechanism will be knock-on displacements whenever Tm exceeds the displacement energy for knock-on events. This is because even heavy ions dissipate far more energy in electronic pro-cesses than in direct nuclear displacements. Which process dominates the production of point defects is very much dependent on the materials being examined, and must be determined by experiment.
.1.2.2 Radiolysis
Radiolytic processes are those in which atomic rearrangements take place "driven" by the energy given up when electrons and holes recombine nonradioactively [55]. In non-metals, an electron can be excited from the valence band to a higher energy state in which the electron is either not bound or still bound by the Coulomb attraction to the hole that the electron leaves in the valence band. The former case gives rise to an excited state with a distinct ionization energy, and the latter case creates a neutral unit, the bound electron-hole pair or exciton, with a slightly lower energy.
In radiolytic mechanisms, electrons (holes) excited to a higher (lower) energy band by light or other external irradiation rapidly thermalize, i.e., fall into lower (higher) energy levels in the same band, usually with the emission of phonons [11]. The electron ends up in the bottom of the conduction band and the hole in the top of the valence band; the difference in energy is the band gap Eg (or slightly less if an exciton is formed). They recombine and emit a phonon with the same energy eg, or they
recombine to emit many phonons. For large band gaps, the former process is more probable than the latter because multiphonon emission, being a high order process, is not very probable [11].
When the radiationless recombination phonon has a higher energy than the bond-ing energy in the structure, radiolysis may occur. However, this is just one of the necessary conditions. For radiolysis to occur, in general four conditions have to be met [18]:
1. an electronic excitation must be localized to one or at most a few atom sites; 2. the excitation must have a lifetime (N 0.1 ps) comparable with phonon periods
in order to couple into a mechanical response of nuclear masses;
3. the available excitation energy must be comparable to the atom displacement energy in its excited states, Td*;
4. an energy -- momentum conversion mechanism must exist and compete favor-ably with other excitation decay modes such as recombination luminescence. Radiolysis is responsible for most of the radiation damage in organic materials, and a few other insulators, notably halides.
1.3
Structure of Silica and its Polymorphs
Silica (silicon dioxide) is a highly covalent bonding material, in which the covalent bond is highly directional with well-defined bond length. Silica materials exist in many polymorphic forms under various conditions, which are represented on the phase diagrams [38] (Fig. 1-1).
Silica can also easily form glassy structures where no long-range spatial correlation in atomic positions exists. Common to all the polymorphs of silica except stishovite (a high pressure form with the rutile structure), the structures can be described by corner-sharing of almost regular Si0 4 tetrahedra. In each such tetrahedron, a Si atom
'a
Temperature *C
nearest neighboring SiO4 tetrahedra, however, still have two degrees of freedom in rotation, the rotation angles of 0 and b, as illustrated in Fig. 1-2. In stishovite, the structure is composed of distorted octahedra, and both edge- and corner-sharing exist in network connectivity forming the network structure.
In Table 1.1 the crystallographic data and density are listed for quartz, tridymite, cristobalite, coesite and stishovite. The last column Z is the number of units of composition (SiO2) contained in a unit cell in the corresponding polymorph.
1.3.1
Quartz
a-quartz is the stable phase of silica at ambient conditions. The crystal structure [158, 86] has a trigonal symmetry, belonging to the enantiomorphous class 32 with lattice parameters a = 0.491 nm, c = 0.540 nm, and space group P3121 or P3221 according
to its right- or left-handedness. It is composed of corner-sharing SiO4 tetrahedra.
The density of quartz is 2.65 g/cm3, and each unit cell contains 3 composition units of SiO2.
The high temperature form of quartz (/-quartz) has hexagonal symmetry with space group of P6222 or P6422, which can be derived from the a-quartz structure by
rearranging the relative connecting angles of the SiO4 tetrahedra without breaking
any bond.
The structure is shown schematically in Fig. 1-3. In quartz, there are both six-and eight-membered rings [94].
1.3.2
Tridymite
The high temperature form of tridymite, 0-tridymite, is hexagonal with space group
P63/mmc with lattice parameters a = 0.503 nm, c = 0.822 nm; each unit cell contains
four SiO2 composition units [43]. The structure is best regarded [27] as formed by
the linkage of sheets parallel to (001) plane, one of which is illustrated in Fig. 1-4(a). The sheet is formed by an open network of SiO4 tetrahedra, sharing oxygens to form
Si - 0 : 0.16 nm
0 - 0 : 0.26 nm
Figure 1-2: Connection of Si04 tetrahedra in corner-sharing network structures of
ci: 10 O C) cn N N -4 LO -4 10 O ct N 4; 06 o,
C1
N r-4 --4M
00 C) 0 4-; N N N -4 N N 6 10 6 10 6) 30 Ecy4-Qý
t-NC 0 l'--c. ct .O N O 4, N N 0 0 C0 4-4-;0 . ; N N o oo cq 4-'-4 t-4-8 N C0 o 00 r-4 00 0 .: 4-CI: N o Cbo '-z a - -4 a C~ © O I.Si a.Oxypn
SiO4 tetrahedron
Figure 1-3: Crystal structures of (a) Bold lines outline a unit cell in the a,
a- and (b) b plane.
SiO4 tetrahdron
pointing don
Figure 1-4: (a). Crystal structure of 3f-tridymite in [001] projection (after Deer et al. 1963). A unit cell in the a, b plane is outlined in bold lines.
Continuation of Fig. 1-4
Figure 1-4: (b). Crystal structure of /3-tridymite in perspective (after Smyth and Bish 1988).
but their apices point alternately in opposite directions. Successive parallel sheets of tetrahedra sharing apical oxygens are related by mirror planes passing through them, so that the silicons and basal oxygens of a downward pointing tetrahedron in one sheet lie directly above those of an upward pointing tetrahedron in the sheet below, as illustrated in Fig. 1-4(b) where four layers are shown. In the ideal structure the c axis will be four times the height of a tetrahedron standing on its base, and the a axis twice the tetrahedral edge, so that c/a should be 2V2/3 (= 1.633), the values quoted above give c/a = 1.634. In the actual structure, the SiO4 tetrahedra
are not necessarily regular, but since the silicon atoms lie on inverse hexad axes the tetrahedron must have a triad axis parallel to the c-axis. Passing through the centers of the six-membered rings of tetrahedra are vertical screw diads. In addition to the horizontal mirror plane, the structure has vertical mirror and glide planes and it is centro-symmetric. However, minor deviations from the ideal structure are possible.
The low temperature form, the a-tridymite, has a much more complex structure. It has been found to be different for different samples [78, 80]. But, as in the case of quartz, there is no bond-breaking in the transformation between low- and high-tridymite, so the six-membered ring structure is conserved in the low-tridymite. But the relative orientations in tetrahedral connections are largely modified.
1.3.3
Cristobalite
Cristobalite has, like tridymite, a very open structure consisting of six-membered rings of SiO4 tetrahedra. For the idealized 0-cristobalite structure [168], it is based
upon similar sheets of SiO4 tetrahedra which are again linked by Si-O-Si corner
shar-ing bonds that are normal to the basal plane; but the basal oxygens of a tetrahedron, instead of being directly superimposed on, are rotated by 600 with respect to the basal oxygens of the tetrahedron below it. Therefore, so far as the oxygen layers are con-cerned, although these layers are not closely packed, their relationship in tridymite and cristobalite is similar to hexagonal and cubic close packing respectively. The structural arrangements are also analogous to those of wurtzite and sphalerite re-spectively. The repeat distance perpendicular to the basal plane in cristobalite is
b
7-1
A
S... Si o Oxygen
Stetrahedron
Figure 1-5: Crystal structure of 0-cristobalite. (a) a-cristobalite and (b) 3-cristobalite (after Deer et al. 1963).
Table 1.2: Topological structures of silica polymorphs.
Polymorph :Density Primitive Ring Content Stability Range
quartz 2.65 6 6-rings Low Temperature (537-8700C)
40 8-rings
tridymite 2.22 12 6-rings High Temperature (870-14700C) cristobalite 2.21 12 6-rings High Temperature (1470-17200C)
the height of six tetrahedra instead of four as in tridymite. The idealized struc-ture of 0-cristobalite [118] has therefore in fact cubic symmetry (Fd3m) and can be alternatively described with a cubic cell containing eight SiO2 composition units.
The idealized structure described above is not in fact possible, since it involves an exceptionally small Si-O distance [27]; small deviations must be introduced to accom-modate experimentally determined values, which result in the space group of 142d 'with a tetragonal lattice with a = 0.504 nm; c = 0.713 nm at 270 oC, while the average structure can be described by the idealized F43m structure [167]. Figure 1-5 shows the crystal structure of /-cristobalite.
The low temperature form, the a-cristobalite, was determined to be tetragonal with space group P4121 or its enantiomorph P4321, with lattice parameters a =
0.498 nm, c = 0.694 nm, which is a more distorted form of the 3-cristobalite [29]. The structure is composed of only six-membered rings.
1.3.4
Topological descriptions
Though the crystal structures of various polymorphs of silicas can be well described by their symmetry groups, this description does not stress many of the similarities that are common to all polymorphs. Marians and Hobbs used a different language to describe the structures of silicas, including vitreous forms. Central to this description are ring structures and local clusters [94, 95]. Figure 1-6 shows schematically the three-, four-, five-, six-, seven-, and eight-membered rings respectively in Figs.
(b) (c)
(d) (e) (f)
Figure 1-6: Primitive rings of (a) three-fold; (b) four-fold; (c) five-fold; (d) six-fold; (e) seven-fold; and (f) eight-fold.
In Table 1.2 the ring structures for the three silica polymorphs depicted above are
given [95].
There is also the possibility for many defects in these structures, but the rather rigid structural forms impede diffusion of lattice atoms, exchange of lattice positions or recombination of an interstitial-vacancy pair. These involve rupture and reforma-tion of bonds which oppose small-scale atomic rearrangements. The major defects existing in these materials are normally associated with (and locked into position by) impurities.
1.3.5
Vitreous silica
The corresponding understanding of the structure of amorphous materials is, however, much poorer than that of crystalline materials. For vitreous silica (v-SiO2), which is the best understood oxide glass so far, after about sixty years of continuous effort since Zachariasen proposed in 1932 his continuous random network model [170] and the first X-ray diffraction experimental analysis in 1936 in support of the model reported by Warren, Krutter and Morningstar [153], we still do not yet fully understand the atomic structural arrangements beyond the nearest neighbor connection. Though much progress has been made since Zachariasen stated "It must be frankly admitted that we know practically nothing about the atomic arrangement in glasses," the fact that Zachariasen's original sketchy drawing to illustrate Be20 3 structures (reproduced
one more time here in Fig. 1-7) is still very often used to represent a glassy structure for general purposes conforms the slow progress. Zachariasen also proposed three necessary rules under which an oxide glass may form:
1. the materials must contain a high percentage of cations which are surrounded by oxygen tetrahedra or by oxygen triangle;
2. these tetrahedra or triangles share only corners with each other;
3. some oxygen atoms are linked to only two such cations and do not form further bonds with any other cations.
(a)
(b)
Figure 1-7: (a) Zachariasen model for oxide glasses (after Zachariasen 1932) and (b) corresponding figure in the form of triangle rafts (after Shackelford 1983).
In an amorphous solid, there is still some structural order present. Here "order" is used to refer to topological correlations in atomic positions, as opposed to the often assumed "random" atomic arrangement.
In a hierarchical classification [34], the short-range order (SRO) refers to the length scale in the range of 0.2 - 0.5 nm; and medium-range order (MRO) in the range of 0.5 - 2.0 nm; and long-range order (LRO) beyond 2.0 nm.
In the network structures of silicas, the short-range order is represented by the nearest-neighbor configurations, viz the SiO4 tetrahedron, which is the basic building
unit in all silicas except stishovite. Including the vitreous states, short-range order is well maintained in all structures.
Medium-range order, on the other hand, is not well defined in amorphous silicas. Here the MRO is represented by tetrahedral connections. Although it has been well accepted that the network structure is formed by corner-sharing of SiO4 tetrahedra,
the connections are not well defined.
Long-range order exists only in crystalline states, where atomic positions are speci-fied by the structure of unit cell and the translational symmetry of the crystal lattices. Short-range order in silicas has been quite well understood by examining the radial distribution functions. Medium-range order, however, is still elusive [33].
The Zachariasen rules concern only the short-range order, which is apparently not enough to determine the structure of glasses, since many features of amorphous materials cannot be determined alone by their short-range order. For instance, the short-range order alone does not determine even the macroscopic density of oxide glasses [133].
In the medium-range order, one feature that has been recognized is the presence of structural rings, ranging from the smallest possible three-membered ring, to rings composed of larger number of tetrahedra.
Various diffraction approaches have been applied to deduce the structure of vitre-ous silica. Among these are the first X-ray diffraction RDF analysis (qmax = 16 nm- 1)
2 [153] and later improved analysis (qm,x = 25 nm-1) [107]; neutron diffraction [137]
using various methods (notably twin-axis diffraction experiments (qmax = 32 nm- 1)
[75]; elastic diffraction experiments (qmax = 25 nm-') [166]; and time-of-flight diffrac-tion experiments (qmax = 72 nm-') [54]), and combined X-ray and neutron diffracdiffrac-tion
from the same specimen [59]. These studies have revealed consistent structural fea-tures:
The structure of vitreous silica fits very well to the continuous random network model [6] following Zachariasen's rules, i.e., practically all of the silicon atoms are tetrahe-drally bonded to four oxygen atoms, with an average Si-O distance 0.162 nm. Nearly all of the oxygen atoms are bonded to two silicon atoms. The Si-O-Si bond angle follows a distribution function [21] that varies from 1200 to 1800 with a maximum at about 1440. In the medium-range, six- to ten-fold rings may exist, but six-membered rings are the most probable ones [49].
1.3.6
First Sharp Diffraction Peak
The first sharp diffraction peak, positioned at ql _- 2.4 nm-1 for vitreous silica, has
long been associated with range order. It must bear the signature of medium-range order, since the first two peaks in the RDFs for various silicas are insensitive to this peak. However, the correlation of this peak and the medium-range order is still controversial. There are three main theories on the structural origin of the peak:
1. Quasi-crystalline structural configurations
In this model [120], the FSDP is related to layer-like structures where the FSDP is identified as a Bragg-like peak by the relationship d ý_ 1/q1, where d is the
corresponding real-space spacing; 2. Molecular correlations
In this model [102], the FSDP is related to the interplay between the intramolec-ular scattering and the intermolecintramolec-ular scattering;
2
The reciprocal space parameter q is here defined as q E 2sin(6/2)/A, where E is the total
3. Chemical-order pre-peak
In this model [35, 36], the FSDP is proposed to arise from the clustering of interstitial voids around cation-centered "clusters".
The FSDP has anomalous behaviors as temperature and pressure change. The intensity increases with increasing temperature [104]; the intensity decreases, and the position ql shifts to larger values, with increasing pressure [145].
1.4
Radiation Damage in Silicas: Literature
Re-view
1.4.1
Effects of neutron irradiation
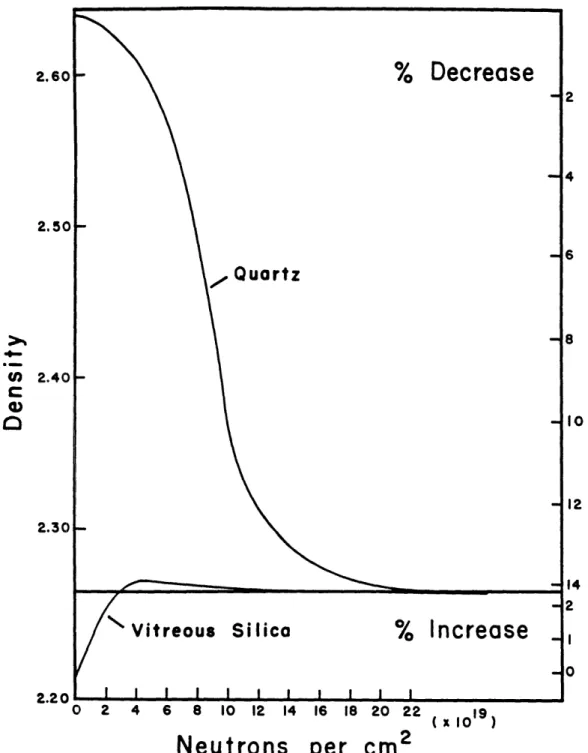
Early studies using neutrons to bombard quartz crystals and vitreous silica [161] report that the crystalline structure of quartz was altered by irradiation, as evidenced by the changes in many physical properties of the irradiated sample compared to unirradiated quartz crystals. It was established that large fluences of fast neutrons were required to introduce noticeable damage to the structure of quartz, vitreous silica and other polymorphs of silica. Density changes do not begin to be discernible before a fluence of 2 x 10¹⁹ nvt (neutrons/cm2) and reach saturation at about 2 x 10²⁰ nvt. After intense neutron irradiation, the quartz crystal loses its birefringence [123, 121], and its Raman spectral lines widen [173].
It was also found that densities of all crystalline polymorphs (quartz, cristobalite, tridymite) decrease and reach the same value of 2.26 g/cm3 at saturation [161, 162],
while the density of vitreous silica increases to the same value [122, 84]. The swelling of crystalline quartz is about 14% and the contraction of vitreous silica is about 3%. Figure 1-8 shows the density changes as a function of neutron irradiation doses for quartz and vitreous silica [84]. The fact that all forms of silicon dioxide are transformed to optically isotropic, glass-like materials with virtually identical density, thermal expansion [136], elastic properties [97] and absence of Bragg peaks in X-ray diffraction patterns led to the conclusion that neutron irradiation produces a new
Decrease
Qr
SQuartz~--Vitreous
I I I ISilica
%
I I I I ! I I 0 2 4 6 8 10 12 14Neutrons
16 18 20 22per cm
2
Figure 1-8: Denisty changes of silicas as a function of irradiating fluence of neutrons (after Lell et al. 1966).
2.60 2.50 2.40 4-.-em (0 C 0-2.30 2.20
ncrease
( x 1019)phase of silicon dioxide which is independent of the original phase before irradiation. Diffraction investigations have also been carried out to compare results for v-SiO2
before and after neutron irradiation. Lukesh [90] showed that, in X-ray diffraction patterns, the first peak from the irradiated vitreous silica was shifted and broadened compared with that same peak from unirradiated vitreous silica. Comparison of X-ray-diffraction-deduced radial distribution functions [134] between fused silica and neutron irradiated quartz found that there is no change in the nearest neighbor Si-O interatomic distance in the irradiated quartz, but the Si-Si distance has been ren-dered somewhat smaller in the disorren-dered quartz than in v-SiO2. The decreased Si-Si
distance indicates a Si-O-Si bond angle decrease from 142' to 1390 [135, 5]. By mea-suring the difference in correlation functions, Leadbetter and Wright [83] concluded that the shift in the first Si-Si peak was in fact caused by an extra contribution at
0.286 nm, attributed to oxygen interstitials formed during neutron irradiation. Chan et al. [14] used magic angle spinning nuclear magnetic resonance (MAS-NMR)
tech-nique to investigate both a-quartz and vitreous silica after fast neutron irradiation up to doses of 8.7 x 10¹⁹ nvt and demonstrated that the Si-O-Si bond angle in vitreous silica does indeed decrease on fast neutron irradiation. Very recent neutron diffrac-tion studies combined with MAS-NMR performed by Wright el al. [165] on vitreous silica before and after fast neutron irradiation to a dose of 2.8 x 10²⁰ nvt showed that on fast neutron irradiation the first peak in the diffraction pattern was reduced in height, broadened and shifted to a slightly higher scattering vector, as in the X-ray diffraction patterns [90]. A slight reduction in the first peak in the deduced total correlation function was also reported. The Si-O-Si mean bond angle was determined to be 1410 compared with the value of 150.5' obtained for unirradiated vitreous silica sample. These researchers also proposed that more three-membered rings were gen-erated on fast neutron irradiation and therefore that the intermediate range order in vitreous silica is considerably reduced on heavy fast neutron irradiation.
It was also was proposed that the damage was accompanied by an a --4 f transition
of the quartz structure initiated by the energy deposited in the lattice [82], which was based on the observation of hexagonal symmetry in X-ray diffraction patterns
[173]. The @-lattice is believed to be stabilized by the high concentration of defects. Primak [124] proposed a thermal spike theory to explain the metamictization, where the energy dissipated by the displaced primary atoms caused a small region of local melting followed by rapid quenching.
Anisotropic behavior in Raman light scattering in quartz crystals of different orien-tations was reported, while no dependence on orientation was detected in unirradiated quartz [173]. This led to the model by Weissmann to suggest that the oxygen atoms were mainly displaced into the channels along the c-axis of the quartz crystals.
Formation of magnetic centers during neutron irradiation was measured to be at a rate of 3.7 centers formed per incident fast neutron before reaching saturation [143], and the saturation values were found to be the same for both vitreous silica and for quartz [8]. The majority point defects generated are E'1 centers as a result of direct atomic displacement damage during neutron irradiation [73].
1.4.2
Effects of electron irradiation
Metamictization of silica crystals also occurs under electron irradiation. Investiga-tions of in situ electron irradiation with a wide range of incident electron energies have been reported, from a few keV in Auger spectroscopy [149] to a few MeV in high voltage electron microscopy [70]. Das and Mitchell [25] reported the radiation damage structures in synthetic Z-cut quartz as a function of incident electron ener-gies at room temperature, from 50 keV to 650 keV, and concluded that two kinds of damage mechanisms may be involved in the crystalline-to-amorphous transformation,
viz a knock-on displacement mechanism which led to the formation of strain centers
interpreted as dislocation loops, and radiolytic damage (ionization) which leads to the crystalline-to-amorphous transformation in the entire irradiated volume. They also observed that the electron dose required for amorphizing the quartz crystals increased monotonically as the electron energies increased, which was attributed to radiolysis because the cross-section for ionization damage reduces with increasing electron en-ergies. More detailed studies carried by Hobbs and Pascucci [64] within the energy range 20 keV to 125 keV later revealed that the strain centers were in fact metamict
inclusions. Both the formation of heterogeneously-nucleated disordered strain cen-ters and the homogeneous gradual crystalline-to-amorphous transformation of the surrounding matrix were attributed to radiolysis.
Using convergent-beam electron diffraction at low temperatures, Pascucci et al. [114] showed unambiguously that higher order Bragg reflections vanished first during the degradation of the crystalline structures, which led them to suggest that the disordering began in the short-range regime. High-resolution electron microscopy [112, 114] also showed clearly the strain centers formed in the early stage of electron irradiation were indeed amorphous inclusions.
Careful studies on the dependence on electron energies up to 2250 keV [70] showed that the radiolytic damage mechanism was the dominant process at least up to .1500 keV, and that knock-on damage became the dominant mechanism only beyond t.his energy value. However, it seems that there is no difference in the microstructural damage morphologies arising from these two distinct mechanisms.
Hobbs and Pascucci [64] proposed an atomic model for the radiolytic damage re-sponsible for the metamictization, linked to an adjacent oxygen atom based on the well-accepted model for E' in silicas [39]. As a result of radiolytic bond-breakage and to form an O peroxy linkage, the resultant E" oxygen vacancy and peroxy linkage form a close-spaced Frenkel pairs. By using specimens of different water contents, they demonstrated that nucleation of the metamict inclusions was closely related to water impurity; presumably, the hydrolized SiOH-HOSi bonds can serve as preferred nucleation sites. Observation of the inclusion formation at various temperatures sup-ports this model. The nucleation centers were suggested to be water impurity in the quartz crystals [114]. It was also observed that amorphization was more likely to oc-cur first in crystal defect sites, such as dislocations in quartz [16] and twin boundaries in quartz, cristobalite [32] and coesite [9].
Temperature-effect on radiation damage was also studied [112, 70], which showed that, in the radiolytic damage regime, the required dose to amorphize quartz crystals decreases as the temperature is elevated, while the opposite trend was observed in the knock-on damage regime.
Electron paramagnetic resonance studies [85] of the point defects in irradiated silicas show that E' centers [169] and peroxy radicals (02) are the dominant defects in silicas damaged by electrons, neutrons, or y rays.
Densification of vitreous silica occurs under electron irradiation [125], as in the cases of neutron irradiation [123] and ion implantation [28], with saturation volume change of less than 3%, and it was also found that the Si-O-Si bridging bond angle is reduced by about 100.
The effects of electron irradiation on a number of properties of various glasses were measured by Mike et al. [101]. They found that there was a density decrease (though they thought it insignificant!) of a lead silicate glass, which is consistent with a decrease in density of a similar glass after particle irradiation [117].
1.5
Objectives of the Present Study
The objectives of the present study were to answer the following questions:
1. What are the quantitative relationships between the high-resolution electron microscopy (HREM) image contrast and the specimen structures when there are amorphous inclusions and amorphous layers?
2. What are the structures of the various metamict states of silicas obtained from different starting materials?
3. To what extent we can understand the medium range-order from electron diffrac-tion data?
4. What are the advantages and disadvantages of electron amorphography com-paring to X-ray and neutron amorphography?
Chapter 2
Experimental
2.1
Specimens
Hydrothermally grown single crystals of a-quartz were obtained from the Sawyer Research Company, Eastlake, Ohio. Typical impurities contained by weight in the material are [112]: < 100 ppm H; < 50 ppm Na; < 10 ppm Al; < 5 ppm Li; < 5 ppm K.
Electron microscope specimens of three orthogonal orientations were prepared, which were designated as X-, Y-, and Z-cut samples, respectively. The corresponding crystallographic directions and cutting planes are schematically shown in Fig. 2-1.
For reasons of convenience, in Fig. 2-2 the commonly useful crystallographic direc-tions and crystallographic planes are shown for a trigonal system using a hexagonal lattice description.
The Cartesian coordinate system (X,Y,Z) was chosen in such a way that the X-, Y-, and Z-axes are parallel to crystallographic directions [100], [120], and [001], respec-tively. Accordingly, X-, Y-, and Z-cut samples refer to quartz slices cut perpendicular
[001]
Y-cut
(010)
!
z
X-cut
(210)
Figure 2-1: Geometry of cutting of quartz samples.
L1U20
[100]
[120](010]
[120]
AA• fFigure 2-2: Important crystallographic directions and planes of a hexagonal lattice.
to these three orthogonal axes.
Given in Fig. 2-3 are selected-area electron diffraction patterns from X-cut, Y-cut, and Z-cut quartz crystals, respectively.
Mineralogical samples of cristobalite (collection catalog number 128694) and tridy-mite (collection catalog number 119881) in the form of powders were obtained from the Harvard Mineralogical Museum.
Vitreous silica (Supersil-W) was obtained from the Naval Research Laboratory, courtesy of Dr. D.L. Griscom.
CVD and thermally-grown SiO2 thin films on Si substrates were obtained from the MIT Department of Electrical Engineering and Computer Science, courtesy of Ms. Lisa Su.
2.2
Irradiations
Neutron irradiation of Y-cut quartz was carried out at the Oak Ridge National Lab-oratory using 1 MeV fission neutrons in nuclear reactor with the following fluences: Sample 1: 1.0 x 10¹⁹ nvt = 1.0 x 10²³ neutrons/m2;
Sample 2: 3.0 x 10¹⁹ nvt = 3.0 x 10²³ neutrons/m2; Sample 3: 1.0 x 10²⁰ nvt = 1.0 x 1024 neutrons/m 2;
Sample 4: 1.5 x 10²⁰ nvt = 1.5 x 1024 neutrons/mi2.
Electron irradiation was performed in situ in transmission electron microscopes. Typical irradiation flux in a Akashi-ISI 002B transmission electron microscope, used for high-resolution studies and operating at 200 kV, was about
106 e/nm2sec = 1024 e/m 2se ,
while the amorphization fluence is estimated to be about 1025 electrons/m 2.
Ion implantation was carried out at the Naval Research Laboratory with fluence 2 x 10²¹ ions/m2 using Si+ ions of energy 150 keV. The penetration depth is about
Figure 2-3: Selected-area electron diffraction from quartz crystals. (a) X-cut, (b) Y-cut, and (c) Z-cut.
2.3
Specimen Preparation
Due to the different forms of the available silica samples, different techniques were applied accordingly to prepare transmission electron microscopy samples.
2.3.1
Quartz and vitreous silica
The original quartz single crystals (including neutron-irradiated) and vitreous silica materials were first cut into thin slices of thickness of about 1 mm using a diamond saw in water. Circular disks of 3 mm in diameter were obtained using hollow ultrasonic drills. Mechanical polishing using 320-grit SiC grinding paper in water was employed to obtain thin disks of about 100 pm in thickness. Dimpling using 1 pm diamond paste was carried out to make the central part of the sample close to 10 - 30 pm in thickness before ion milling was applied. 3 keV Ar+ ions were used as the milling
source to reduce the central part to electron transparency.
Finally, the specimens were coated with amorphous carbon of thickness less than 10 nm to prevent charging effects in the electron beam.
2.3.2
Cristobalite and tridymite
Powders of these materials were dispersed into methanol, which were then collected onto copper grids covered by holey carbon films.
2.3.3
Silica thin films
Since the silica thin films were grown on silicon substrates, only one-sided (silicon side) thinning was applied. After polishing and dimpling from the silicon side, samples were ion milled from one side. The final samples obtained have therefore thin region comprising only amorphous SiO2 thin film left near the edge of the thinning hole.
![Figure 1-4: (a). Crystal structure of 3f-tridymite in [001] projection (after Deer et al.](https://thumb-eu.123doks.com/thumbv2/123doknet/14243223.487131/27.918.167.769.388.828/figure-crystal-structure-tridymite-projection-deer-et-al.webp)