HAL Id: hal-00296437
https://hal.archives-ouvertes.fr/hal-00296437
Submitted on 8 Feb 2008
HAL is a multi-disciplinary open access
archive for the deposit and dissemination of
sci-entific research documents, whether they are
pub-lished or not. The documents may come from
teaching and research institutions in France or
abroad, or from public or private research centers.
L’archive ouverte pluridisciplinaire HAL, est
destinée au dépôt et à la diffusion de documents
scientifiques de niveau recherche, publiés ou non,
émanant des établissements d’enseignement et de
recherche français ou étrangers, des laboratoires
publics ou privés.
observed during the Hohenpeissenberg Aerosol
Characterization Experiment (HAZE2002)
N. Hock, J. Schneider, S. Borrmann, A. Römpp, G. Moortgat, T. Franze, C.
Schauer, U. Pöschl, C. Plass-Dülmer, H. Berresheim
To cite this version:
N. Hock, J. Schneider, S. Borrmann, A. Römpp, G. Moortgat, et al.. Rural continental aerosol
properties and processes observed during the Hohenpeissenberg Aerosol Characterization Experiment
(HAZE2002). Atmospheric Chemistry and Physics, European Geosciences Union, 2008, 8 (3),
pp.603-623. �hal-00296437�
www.atmos-chem-phys.net/8/603/2008/
© Author(s) 2008. This work is distributed under the Creative Commons Attribution 3.0 License.
Chemistry
and Physics
Rural continental aerosol properties and processes observed during
the Hohenpeissenberg Aerosol Characterization Experiment
(HAZE2002)
N. Hock1, J. Schneider1, S. Borrmann1,2, A. R¨ompp3,*, G. Moortgat3, T. Franze4, C. Schauer4, U. P¨oschl4,**, C. Plass-D ¨ulmer5, and H. Berresheim5,***
1Particle Chemistry Dept., Max Planck Institute for Chemistry, Mainz, Germany 2Institute for Atmospheric Physics, Johannes Gutenberg University, Mainz, Germany 3Atmospheric Chemistry Dept., Max Planck Institute for Chemistry, Mainz, Germany 4Institute of Hydrochemistry, Technical University of Munich, Germany
5German National Meteorological Service (DWD), Observatory Hohenpeissenberg, Germany *now at: Institute for Inorganic and Analytical Chemistry, Justus Liebig University Giessen, Germany **now at: Biogeochemistry Dept., Max Planck Institute for Chemistry, Mainz, Germany
***now at: Dept. of Physics, National University of Ireland, Galway, Ireland
Received: 30 May 2007 – Published in Atmos. Chem. Phys. Discuss.: 21 June 2007 Revised: 3 January 2008 – Accepted: 7 January 2008 – Published: 8 February 2008
Abstract. Detailed investigations of the chemical and
mi-crophysical properties of rural continental aerosols were per-formed during the HAZE2002 experiment, which was con-ducted in May 2002 at the Meteorological Observatory Ho-henpeissenberg (DWD) in Southern Germany.
Online measurements included: Size-resolved chemical composition of submicron particles; total particle number concentrations and size distributions over the diameter range of 3 nm to 9 µm; gas-phase concentration of monoterpenes, CO, O3, OH, and H2SO4. Filter sampling and offline
an-alytical techniques were used to determine: Fine particle mass (PM2.5), organic, elemental and total carbon in PM2.5 (OC2.5, EC2.5, TC2.5), and selected organic compounds (dicarboxylic acids, polycyclic aromatic hydrocarbons, pro-teins).
Overall, the non-refractory components of submicron particles detected by aerosol mass spectrometry (PM1, 6.6±5.4 µg m−3, arithmetic mean and standard deviation) accounted for ∼62% of PM2.5 determined by filter gravime-try (10.6±4.7 µg m−3). The relative proportions of
non-refractory submicron particle components were: (23±39)% ammonium nitrate, (27±23)% ammonium sulfate, and (50±40)% organics (OM1). OM1 was closely correlated with PM1 (r2=0.9) indicating a near-constant ratio of non-refractory organics and inorganics.
Correspondence to: J. Schneider
The average ratio of OM1 to OC2.5 was 2.1±1.4, indicat-ing a high proportion of heteroelements in the organic frac-tion of the sampled rural aerosol. This is consistent with the high ratio of oxygenated organic aerosol (OOA) over hydrocarbon-like organic aerosol (HOA) inferred from the AMS results (4:1), and also with the high abundance of pro-teins (∼3%) indicating a high proportion of primary bio-logical material (∼30%) in PM2.5. This finding was con-firmed by low abundance of PAHs (<1 ng m−3) and EC
(<1 µg m−3) in PM2.5 and detection of several secondary
organic aerosol compounds (dicarboxylic acids) and their precursors (monoterpenes).
New particle formation was observed almost every day with particle number concentrations exceeding 104cm−3 (nighttime background level 1000–2000 cm−3). Closer
in-spection of two major events indicated that the observed nucleation agrees with ternary H2SO4/H2O/NH3nucleation
and that condensation of both organic and inorganic species contributed to particle growth.
1 Introduction
Aerosol particles represent an important constituent of the Earth’s atmosphere, since they influence the radiative bal-ance, the chemical composition and the water cycle of the atmosphere. The radiative effects include the direct aerosol effects, i.e. the direct backscattering of incoming solar ra-diation into space, and the indirect effects due to the abil-ity of aerosol particles to act as CCN (cloud condensation
nuclei) and thereby to alter cloud properties (e.g., Lohmann and Feichter, 2005; Penner et al., 2006; Yu et al., 2006; Stier et al., 2007). Furthermore, aerosol particles affect air quality and human health. Several studies showed a direct link between adverse effects on human health and fine par-ticle (d<2.5 µm) as well as ultrafine parpar-ticles (d<0.1 µm) (Oberd¨orster, 2001; Pope et al., 2002; Pope and Dockery, 2006).
A significant fraction of atmospheric aerosol particles are formed by gas-to-particle conversion (nucleation) of sul-furic acid, ammonia, water, and/or oxidized hydrocarbons (see review articles by Kulmala et al., 2004, and Curtius, 2006). The mentioned precursor compounds can be of an-thropogenic or natural origin. While sulfuric acid has been identified in several experiments to trigger atmospheric nu-cleation (Berndt et al., 2005; Birmili et al., 2003; Birmili et al., 2000), the role of organic compounds is an open question (Bonn and Moortgat, 2002, 2003; Curtius, 2006).
The chemistry of atmospheric aerosols, especially their or-ganic chemistry, is very complex, and the investigation of aerosol formation and atmospheric transformation processes is an ongoing challenge (e.g., Fuzzi et al., 2006; Kanakidou et al., 2005; P¨oschl, 2005; Rogge et al., 1998; Seinfeld and Pankow, 2003). The above mentioned effects of aerosol par-ticles on health, clouds, and climate depend both on the size (a physical property) and on the chemical composition of the aerosol particles.
A recent study by Dusek et al. (2006) suggested that vari-ations of the chemical composition play only a minor role compared to particle size in CCN activation of continental aerosol particles, but this finding may not be generally appli-cable (Cubison et al., 2006; Broekhuizen et al., 2006; Mc-Figgans et al., 2006; Hudson, 2007).
To achieve a better understanding of these atmospheric aerosol processes, it is essential to have size-resolved infor-mation on the chemical composition of the aerosol phase, be-sides many other aerosol properties. The large experimental setup that is needed to characterize the ambient aerosol can only be realized within intensive field studies. Such an inten-sive aerosol study, the Hohenpeissenberg Aerosol Character-iZation Experiment (HAZE), was performed in May 2002 at the Meteorological Observatory Hohenpeissenberg (MOHp). The objective of this campaign was to perform a detailed study on physical and chemical properties of continental ru-ral aerosol particles. The MOHp is located at a ruru-ral site about 40 km north of the Alps and surrounded by forest and agricultural pastures. In previous long-term measurements at MOHp the formation of new particles from gaseous pre-cursors (in particular H2SO4) was observed quite frequently
during spring but only rarely in summer (Birmili et al., 2000, 2003).
In the present paper we report on the results of the HAZE2002 study with respect to the chemical composition and size distribution of the aerosol phase, with emphasis on the organic composition inferred from mass spectrometry
and filter analyses, comparison of the methods, mass closure, and the dependence of the aerosol properties on meteorolog-ical conditions as temperature and air mass origin.
2 Experimental
The HAZE2002 Experiment was conducted between 16 May 2002 and 30 May 2002 at the Meteorological Observatory Hohenpeissenberg (47◦48′N, 11◦02′E, 985 m a.s.l.) which is operated by Deutscher Wetterdienst (DWD) and is part of the Global Atmospheric Watch (GAW) program of the World Meteorological Organization (WMO). The observatory is lo-cated at about 300 m elevation above the surrounding area in a region with significant agricultural structure. A broad range of meteorological, trace gas, and aerosol parameters is continuously measured at MOHp, among which are H2SO4
and OH, measured by selected ion chemical ionization mass spectrometry (SI/CIMS) (Berresheim et al., 2000), number density of aerosol particles with d>3 nm and d>14 nm us-ing condensation particle counters (CPC, models 3025A and 7610, TSI Inc., St. Paul, Minnesota) as well as monoterpenes and aromatic hydrocarbons which are monitored using gas chromatography – ion trap mass spectrometry (Birmili et al., 2003).
During the HAZE2002 campaign the following additional measurements were performed: The size distribution of am-bient aerosol particles was measured with an optical parti-cle counter (OPC PALAS model PCS 2010) for partiparti-cles with diameters between 270 nm and 9.5 µm, and with a scan-ning mobility particle sizer (SMPS, models 3081 and 3085, TSI Inc.) for particle size ranges 7–300 nm and 3–65 nm, respectively. The number density of aerosol particles with
d>3 nm was measured with an ultrafine condensation
par-ticle counter (UCPC, model 3025A, TSI Inc.). The size-resolved chemical composition of non-refractory submicron aerosol particles was measured with the Aerodyne Q-AMS (Quadrupole Aerosol Mass Spectrometer) (Allan et al., 2003; Canagaratna et al., 2007; Jayne et al., 2000; Jimenez et al., 2003b). Q-AMS mass concentration and size distribution data were taken between 20 May 2002 and 30 May 2002, with a time resolution of 6 min. For the calculation of ambi-ent mass concambi-entrations, a collection efficiency with respect to particle bounce from the vaporizer (CE) of 0.5 was used (Alfarra et al., 2004; Allan et al., 2004a). Implications and errors that result from this assumption will be discussed in the following sections. The aerodynamic lens of the Q-AMS (Zhang et al., 2002, 2004) transmits particles in the size range (vacuum aerodynamic diameter, dva) from 50 to 600 nm with 100% efficiency. The transmission of the lens drops off sig-nificantly for dva>1 µm, providing similar characteristics to PM1size selective inlets used in filter based measurements
(Weimer et al., 2006).
Filter samples of fine air particulate matter (PM2.5) were collected on 150 mm diameter glass fiber filters
(Macherey-Nagel, MN 85/90 binder-free) with a high volume filter sampler (HVS; Digitel DHA 80, volumetric flow rate 500 L/min, sampling interval 24 h). Prior to use, the filters were heated to 300◦C for 12–18 h in a muffle furnace to remove organic contaminants. For gravimetric mass determination of the sampled particulate matter, the filters were conditioned at 45% relative humidity at room temperature (295 K) over saturated K2CO3-solution in a
glass desiccator for 2 days before weighing. The weighing was performed at (50±10)% RH and the weighing results were not significantly affected by uptake or loss of water during the weighing procedure, as confirmed by test experi-ments. After weighing on an analytical balance, the samples were wrapped in aluminum foil and stored at –20◦C. The total carbon (TC2.5) and elemental carbon (EC2.5) contents of the aerosol filter samples have been determined with a thermochemical carbon analyzer (Stroehlein Coulomat 702). TC2.5was measured by combustion of sample aliquots
under O2 at 600◦C and detection of the evolved CO2 by
coulometric detection. For EC determination the sample aliquots were pre-conditioned by solvent extraction and thermal desorption prior to combustion; organic carbon (OC2.5) was determined as the difference between TC2.5 and EC2.5 (Schauer et al., 2004). Polycyclic aromatic hydrocarbons (PAH) were determined by high perfor-mance liquid chromatography with fluorescence detection (Schauer et al., 2004, 2003a, b). The PAH concentrations reported in this manuscript refer to the sum of 12 out of the 16 EPA PAH priority pollutants: phenanthrene, anthracene, fluoranthene, pyrene, benzo[a]anthracene, chrysene, benzo[b]fluoranthene, benzo[k]fluoranthene, benzo[a]pyrene, dibenz[ah]anthracene, benzo[ghi]perylene, indeno[1,2,3-cd]pyrene. Not included are the four EPA PAHs with lowest molecular mass and highest volatility (naphthalene, acenaphthene, acenaphthylene, fluorene).
Proteins were determined with a bicinchoninic acid assay calibrated with bovine serum albumin (Franze, 2004; Franze et al., 2005). The reported values have to be considered as equivalent concentrations which approximate the actual protein content of the samples but may be influenced by re-lated macromolecular substances – e.g., humic or humic-like substances, respectively (Fehrenbach, 2006; Franze, 2004; Graber and Rudich, 2006; Ivleva et al., 2007).
On 22 May 2002 and 23 May 2002, filter samples were taken with a time resolution of 3 h during the day (08:00 to 20:00) and 12 h during the night (20:00 to 08:00 CEST) us-ing an additional Digitel DA-80 high volume sampler, also equipped with a 2.5 µm sampling head (calculated for a vol-umetric sample flow rate of 500 L min−1). The flow rate in
this study was increased to 1000 L min−1resulting in a cut-off size of 2.0 µm. The samples were analyzed for carboxylic acids with a LC/MS/MS-ToF instrument combining tandem mass spectrometry and high mass resolution measurements (R¨ompp, 2003). A regular reversed-phase HPLC system (2 mm C18colum) was coupled to a hybrid mass
spectrome-ter (quadrupole and time-of-flight) QSTAR (Applied Biosys-tems MDS SCIEX, Toronto, Canada) by an electrospray ion source.
The Q-AMS as well as the SMPS, OPC and UCPC were set up in a laboratory in the top floor of the observatory on the southwestern side facing the dominant wind direction. The aerosol samplers were mounted outside on the roof platform of the building, and precautions were taken that the exhaust of the instrument did not affect the particle sampling. The particle inlet to the indoor instruments, a stainless steel tube with a length of 2 m and an inner diameter of 8 mm, was de-signed to be near-isokinetic. Raindrops were prevented from entering the line by means of a downward facing funnel at the beginning of the line. The tube included one 90◦-bend to transmit the particles to the Q-AMS as well as to the SMPS, UCPC and OPC. Ambient air was pumped through this tube with 25 L min−1, including a sample flow of 0.1 L min−1of
the Q-AMS. The transport losses of the sampling system with respect to inertia, diffusion and settling losses have been cal-culated based on simple aerodynamic calculations (Hinds, 1999). Averaged over the size ranges that are detected by the Q-AMS, the SMPS, the UCPC, and the OPC the total transport losses are smaller than 12%.
3 Results and discussion
3.1 Overview and aerosol mass closure
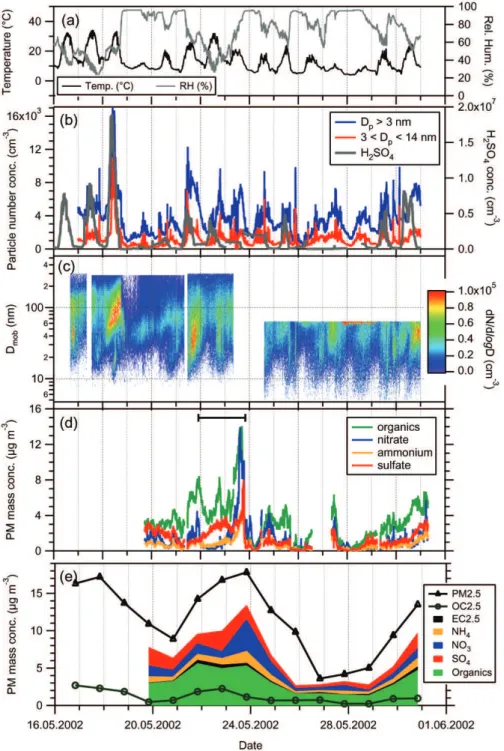
Figure 1 gives an overview on the time series of sev-eral important parameters measured during the HAZE2002 project: Temperature, relative humidity, particle number den-sity, H2SO4concentration, particle number size distribution,
mass concentrations of sulfate, nitrate, ammonium, organics, PM2.5, EC2.5, and OC2.5.
Panels (a) to (c) reveal that the temperature, the num-ber concentration of total and ultrafine particles, and H2SO4
number concentration show a pronounced diurnal cycle, which is an indication for photochemical particle formation. This will be discussed in more detail in Sect. 3.4.
The mass concentrations measured with the Q-AMS data (Panels d and e) show a large variation, ranging between 3 µg/m3 to 13 µg/m3 (diurnal averaged concentration). All four species increase significantly between 21 May 2002 and 23 May 2002 with values for both nitrate and organics reaching up to 14 µg/m3. Also the sulfate and ammonium mass concentrations during this period markedly exceed the average values measured during the campaign. Backward trajectory calculations performed with the LM1 model of DWD and with the NOAA HYSPLIT model confirmed that the air masses that arrived at the Hohenpeissenberg station between 21 May 2002, 22:00, and 23 May 2002, 20:00, have encountered the polluted Po Valley area in northern Italy within the planetary boundary layer between 18 and 48 h prior to our measurements. The arrival times of the
Fig. 1. Time series of the measured quantities during HAZE2002: (a) Temperature and relative humidity; (b) Total (>3 nm) and ultrafine (3–14 nm) particle number density along with H2SO4number concentration. (c) Number size distribution measured with the SMPS; (d) Mass concentrations of ammonium, sulfate, nitrate and organics measured by the Q-AMS; (e) 24-h averaged mass concentrations (stacked: organics, EC2.5, ammonium, nitrate, sulfate), along with OC2.5 and total PM2.5.
trajectories originating from the Po Valley are indicated with the horizontal bar in panel (d) of Fig. 1.
The correlation between PM1 and the HVS mass concen-tration (PM2.5) is given in Fig. 2a). To obtain PM1, we added EC2.5 to the sum of the Q-AMS concentrations to
ac-count for the fact that the Q-AMS does not detect elemental carbon. The error by adding a PM2.5 quantity to PM1 data is regarded to be negligible, because we do not expect a large fraction of elemental carbon to be found in the size range be-tween 1.0 and 2.5 µm. The term “PM1” in this paper will
14 12 10 8 6 4 2 0 O M 1 ( µ g m -3 ), A M S 3.0 2.5 2.0 1.5 1.0 0.5 0.0 OC2.5 (µg m-3) slope = 2.1 ± 1.2 r2 = 0.63 (b) OM1 vs. OC2.5 20 15 10 5 0 P M 1 ( µ g m -3 ), A M S 20 15 10 5 0 PM2.5 (µg m-3), HVS slope = 0.68 ± 0.22 r2 = 0.83 (a) PM1 vs. PM2.5 5 4 3 2 1 0 T C 2 .5 ( µ g m -3 ) 20 15 10 5 0 PM2.5 (µg m-3) TC2.5 vs. PM2.5 slope: 0.17 ± 0.08 r2 = 0.62 (c) 14 12 10 8 6 4 2 0 O C 2 .5 , O M 1 ( µ g m -3 ) 20 15 10 5 0 PM (µg m-3) OM1 vs. PM1 slope = 0.43 ± 0.10 r2 = 0.90 OC2.5 vs. PM2.5 slope = 0.13 ± 0.06 r2 = 0.60 (d)
Fig. 2. Correlation between various aerosol parameters measured with the Q-AMS (PM1) and the HVS (PM2.5): (a) PM1 (derived by summing the Q-AMS mass concentrations plus EC2.5 from HVS) vs. total PM2.5 mass concentration from HVS; (b) Total organic mass concentration from Q-AMS (OM1) vs. OC2.5 from HVS (as difference of total carbon (TC) and elemental carbon (EC)). (c) Total carbon (TC2.5) vs. PM2.5 from HVS; (d) OM1 vs. PM1 and OC2.5 vs. PM2.5 (HVS). The error bars represent the standard deviations within the averaging intervals of Q-AMS data to HVS sampling intervals.
therefore refer to “sum Q-AMS” plus EC2.5. The linear re-gression has a slope of 0.68±0.22. The overall ratio of PM1 to PM2.5 was 0.62. Note that other refractory material like mineral dust is also not measured by the Q-AMS. It further has to be noted that this PM1/PM2.5 ratio is based on the chosen CE factor of 0.5.
Verification of the chosen CE value relies on the follow-ing observations: For the first half of the measurements also a complete size distribution, recorded by an SMPS system (10–300 nm) and an optical particle counter (>300 nm) are available. In order to obtain PM1 and PM2.5, respectively, from this data set, we selected a refractive index of 1.450, converted number distributions into volume distributions as-suming spherical particles, integrated the size distributions to the corresponding upper limits, and converted volume to mass using a density of 1.3 g cm−3. The values for the refrac-tive index and the density were taken from the comparisons shown in Sect. 3.2. The result shows that the PM2.5 values inferred from both methods do not agree: An average particle density of 2.8 is required to obtain mass closure, a value that
is certainly too high to be realistic. However, determination of a mass concentration by a gravimetric method is in gen-eral more reliable than converting a number distribution into a mass concentration. Comparing PM1 from SMPS + OPC to PM1 from AMS shows good agreement when a density of 1.3 and a collection efficiency of 0.5 is used, but this would imply that no refractory material other than EC is present.
We can obtain the maximum and minimum value for the collection efficiency of the AMS using the following extreme assumptions:
1. We take PM2.5 from the HVS, subtract the mass be-tween 1 and 2.5 µm, obtained from the OPC using a density of 1.3 g cm−3, subtract EC2.5, and assume that no other refractory material is present. This method yields CE≈0.33.
2. We take PM1 from SMPS and OPC, use a density of 1.3 g cm−3, and assume that 33% of PM1 is refractory material. Then we arrive at CE≈0.66.
Thus, an average CE value of 0.5 seems justified, but has an uncertainty of ±0.16, corresponding to 33%.
Chemical resolved mass concentrations from the HVS are available only for organic carbon (OC2.5), which is calcu-lated by the difference of total carbon (TC2.5) and elemental carbon (EC2.5). Figure 2b shows the correlation between the total organic mass concentration measured with the Q-AMS (= total organic matter, OM1) and OC2.5.
We determined the possible error introduced by comparing OM1 to OC2.5 using the following procedure: As explained above, we estimated the mass in the aerosol phase between 1.0 and 2.5 µm. The result shows that the size range be-tween 1.0 and 2.5 µm contributes only with (4.53±1.38)% to the PM2.5 mass concentration (mean value and standard deviation). If we assume a “worst case” scenario, i.e., we as-sume that the complete aerosol mass between 1.0 and 2.5 µm (0.53±0.23 µg m−3) is made up of OM and add this to the
OM measured by the AMS, the AMS OM values increase by (15±5)%. However, this increase is not uniformly dis-tributed over the OM mass concentration range. As a result, the slope of Fig. 2b does not change significantly. Summariz-ing, taking into account the possible maximum contribution of OM between 1.0 and 2.5 µm does not affect the OM1 to OC2.5 slope. The uncertainty range from the linear regres-sion is ±1.2. Together with the 33% uncertainy of the collec-tion efficiency this results in a value for the OM1 to OC2.5 slope of 2.1±1.4.
Although large variations of the total aerosol concentra-tion and composiconcentra-tion have been observed during the cam-paign, OM1 and OC2.5 are well correlated with an r2value of 0.63. OM/OC ratios for rural locations reported in the lit-erature range between 1.8 and 2.3 (Bae et al., 2006; El-Zanan et al., 2005; Yu et al., 2005; Lim and Turpin, 2002; Turpin and Lim, 2001; Gelencser, 2004) while for urban and pol-luted continental locations values between 1.2 and 1.6 were reported (Turpin and Lim, 2001; Lim and Turpin, 2002; Ge-lencer, 2004; Bae et al., 2006; Gilardoni et al., 2007). Thus, our value of 2.1±1.4 is in very good agreement with the literature values for rural organic aerosol and indicates that the average organic aerosol measured during HAZE was not substantially influenced by fresh anthropogenic emissions. Compounds dominating fresh anthropogenic emission (e.g., alkanes, alkenes, aromatic hydrocarbons) have low OM/OC ratios in the range of 1.1–1.2, while oxygenated organic components that are indicative of aged or secondary organic aerosol (e.g., dicarboxylic acids, ketones, aldehydes) have OM/OC in the range of 2.3 to 3.8 (Russell, 2003). In our data, underestimation of OM1 in comparison to OC2.5 due to the different upper size cuts would result in an even higher ratio. It must further be stressed that this ratio is directly de-pendent on the assumed Q-AMS collection efficiency factor for organic particles which was chosen to CE=0.5. But since the same conclusion will later be drawn from a Q-AMS inter-nal method (independent on CE, see Sect. 3.4.1), the picture is consistent.
Figure 2c shows the correlation between total carbon (TC2.5) and total particulate matter (PM2.5), Fig. 2d gives the correlations between OC2.5 and PM2.5 as well as be-tween OM1 and PM1. The high correlation bebe-tween OM1 and PM1 (r2=0.90 for the diurnal averages and r2=0.89 for the AMS time resolution of 10 min) indicates that in spite of strongly changing meteorological conditions and abso-lute concentration levels of particulate matter (3–13 µg m−3 PM1), the ratio of non-refractory organics and inorganics of 1:1 was nearly constant.
The non-refractory inorganic components, namely ammo-nium nitrate and ammoammo-nium sulfate, were calculated from the measured NH4, NO3, and SO4by assuming that
ammo-nium preferably neutralizes sulfate and adding the remaining ammonium to the nitrate concentration to obtain ammonium nitrate. This results in average values (mean and standard deviations) of (23±39)% ammonium nitrate and (27±23)% ammonium sulfate, while the remaining (50±40)% are or-ganics (OM1). Previously published data by several authors (e.g., Meszaros and Horvath, 1984; Willison et al., 1985; Zhang et al., 2003; Morino et al., 2006) showed that there is a temperature dependency of the partitioning of ammonium nitrate between the gas phase and the solid phase. If the am-bient relative humidity (RH) is lower than the deliquescence relative humidity (DRH), ammonium nitrate exists in the solid phase, if RH is higher than DRH, NH4NO3dissociates
to NH+4 and NO−3 in an aqueous solution. If NH3and HNO3
can exchange readily between the gas and particle phases, a temperature dependent equilibrium exists between partic-ulate NH4NO3and gaseous NH3and HNO3(Mozurkewich,
1993). During HAZE2002, ambient temperatures ranged be-tween 32◦C and 14◦C (see Fig. 1). Figure 3 shows the ra-tio of ammonium nitrate mass concentrara-tion and the total non-refractory PM1 mass concentration (measured with the Q-AMS) as a function of temperature, as 2h-mean values, and binned into temperature bins of 2 K below 298 K. Above 298 K we used one 4-K bin and one 5-K bin, since less data points were available. The data fall into two regimes: Below a temperature of about 293 K, the ammonium nitrate fraction remains fairly constant (about 25%), while above 293 K the NH4NO3fraction decreases and reaches zero at about 303 K.
These data illustrate shifting of the equilibrium of NH4NO3
into the gas phase at temperatures above 293 K. Similar ob-servatons were reported by Zhang et al. (2003) who found an anticorrelation of nitrate with temperature in the temper-ature range between 292 and 308 K during the 1999 Atlanta Supersite Experiment.
3.2 Aerosol size distributions
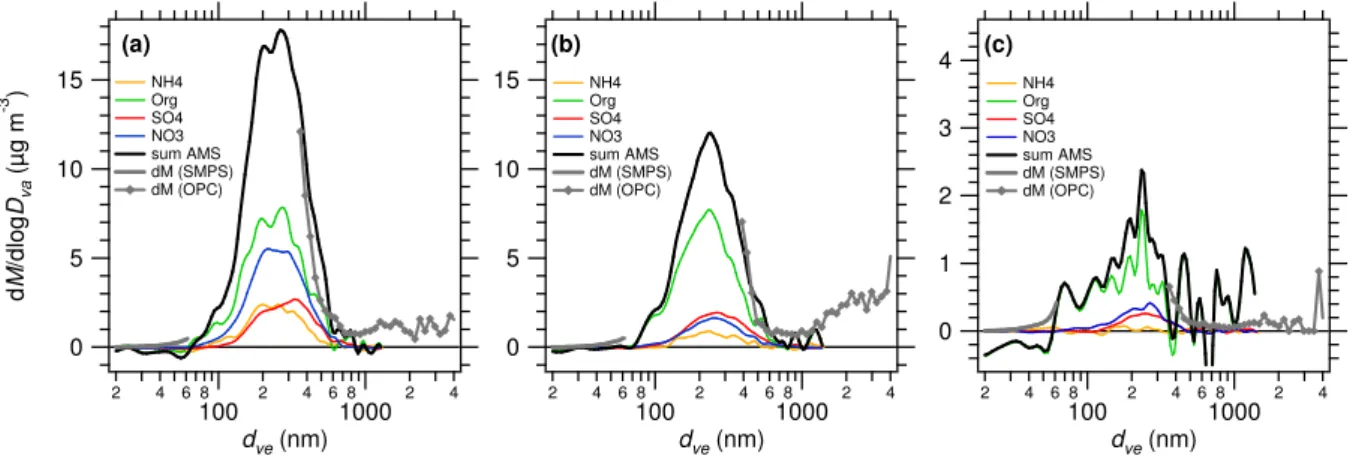
Figure 4 gives the chemically resolved size distributions of the four species measured by the Q-AMS as a function of time for the second week of the campaign. During the observed time period, the submicron aerosol mass is con-centrated in a size range (vacuum aerodynamic diameter)
between 200 and 600 nm. In the following we will concen-trate on three time periods A, B, and C (see Table 1 and Fig. 4) showing a distinct difference in the chemically re-solved size distributions: Period A is characterized by high concentrations of all four species, period B by high sulfate and organics but low nitrate and ammonium, while in pe-riod C the aerosol mass concentrations of all four species are markedly lower than before. Figure 5 depicts the size distri-butions averaged for these three time periods A, B, and C. Size distribution data have additionally been obtained from SMPS and OPC. In order to compare the size distributions obtained with Q-AMS, SMPS, and OPC, the mean density of the aerosol particles was estimated from the chemical com-position. Ammonium sulfate and ammonium nitrate were calculated from the measured sulfate and nitrate content. These data are given in Table 1. The vacuum aerodynamic diameter (dva) was converted into volume equivalent diame-ter dveunder the assumption of spherical particles using the equation
dve=dva·
ρ0 ρp
(1) (Jimenez et al., 2003a), where ρp is the particle density and ρ0is the density of water. The mobility diameter
mea-sured by the SMPS equals the volume equivalent diameter for spherical particles (DeCarlo et al., 2004).
For the optical particle counter PALAS PCS 2010, we per-formed Mie calculations following the algorithms of (Bohren and Huffmann, 1983), in order to find the refractive index at which the obtained size distributions match best to the AMS size distribution. The PCS 2010 operates with a white light source and the scattered light is detected under 90◦ (Umhauer, 1983). It was calibrated with PSL spheres of 800 nm (refractive index n=1.588) at the beginning of the campaign. By comparing the total mass distribution of the Q-AMS and the mass distribution obtained by the OPC (us-ing the density inferred from chemical composition), it was found that the data match best for refractive indices of 1.400 and 1.450, respectively (see Table 1). The SMPS size range reaches only up to 65 nm (due to the use of the Nano-DMA). In this size range the transmission of the aerodynamic lens of the Q-AMS is less than 100%. Additionally, the low mass concentrations observed in period C leads to larger uncertain-ties and therefore also to some negative values in the mass size distributions measured by the Q-AMS, which makes comparison between Q-AMS and SMPS difficult, although qualitative agreement is achieved.
In the following we will focus on the wet removal pro-cess observed during a precipitation event which occurred between 14:00 and 20:00 on 25 May 2002, with highest rain rates of >0.1 L m−2min−1between 14:00 and 16:00 (lowest panel of Fig. 4). The three time periods A, B, and C shown in Figs. 3 and 4 reflect the wet removal of aerosol particles during the precipitation event on 25 May 2002. The CO data (lowest panel of Fig. 4) show that no air mass change
oc-1.0 0.8 0.6 0.4 0.2 0.0 N H4 N O3 / t o ta l P M1 305 300 295 290 285 280 275 Temperature (K) NH4NO3 / total PM1: 2h-averages binned linear fit
Fig. 3. Measured ratio of NH4NO3 mass concentration to total
aerosol mass concentration as a function of temperature, binned into temperature intervals. The dots indicate the two hour averages. The solid lines represent linear fits to the temperature ranges below and above 293 K.
curred during the precipitation event and therefore the de-crease of the mass concentrations (Table 1) is only due to wet removal. The mass concentrations before and after the precipitation event suggest different wet removal efficiency for the different species: Ammonium sulfate is removed by a factor of 12, ammonium nitrate by a factor of 19, organics by a factor of 8.
This can be seen as an indication for partial external ture of the aerosol particles, since in a complete internal mix-ture all species would be removed to the same degree. Small organic particles appear to be less efficiently removed, as shown by panel (c): After the precipitation event, an aerosol mode around 60–80 nm is present which is dominated by or-ganic compounds.
3.3 The organic fraction of the aerosol particles 3.3.1 Oxygenated organic aerosol (OOA)
and hydrocarbon-like organic aerosol (HOA) The correlation between the organic mass concentration measured by the Q-AMS (OM1) and OC2.5 measured by the HVS (Fig. 2b) has already been discussed (Sect. 3.1). In order to further investigate the formation processes of or-ganic aerosol particles, the multicomponent HOA/OOA anal-ysis (MCA, Zhang et al., 2005a, c, 2007) was used.
This analysis yielded 3 major components: a hydrocarbon-like organic aerosol component (HOA) and two oxygenated organic aerosol components (OOA1 and OOA2). HOA contributed (20±17)% to the total organics mass, OOA1 (18±12)% and OOA2 (62±19)%, respectively (arithmetic means and standard deviations). The components are
Table 1. Composition, mean particle density ρmeanand inferred refractive index n of the aerosol particles for the three time periods (A, B, and C) indicated in Fig. 4.
Date & (NH4)2SO4 NH4NO3 Organics ρmean n
Time (µg m−3) (µg m−3) (µg m−3) (g cm−3) A 24 May 2002, 13:48:00– 1.50 3.22 3.55 1.32 1.450 25 May 2002, 00:29:56 B 25 May 2002, 03:05:55– 1.17 0.90 3.42 1.19 1.400 25 May 2002, 15:47:47 C 25 May 2002, 16:47:47– 0.12 0.17 0.42 1.22 1.450 26 May 2002, 05:59:40
Fig. 4. Size distribution of the individual aerosol species measured with the Q-AMS during the second week of the campaign, along with precipitation and CO concentration.
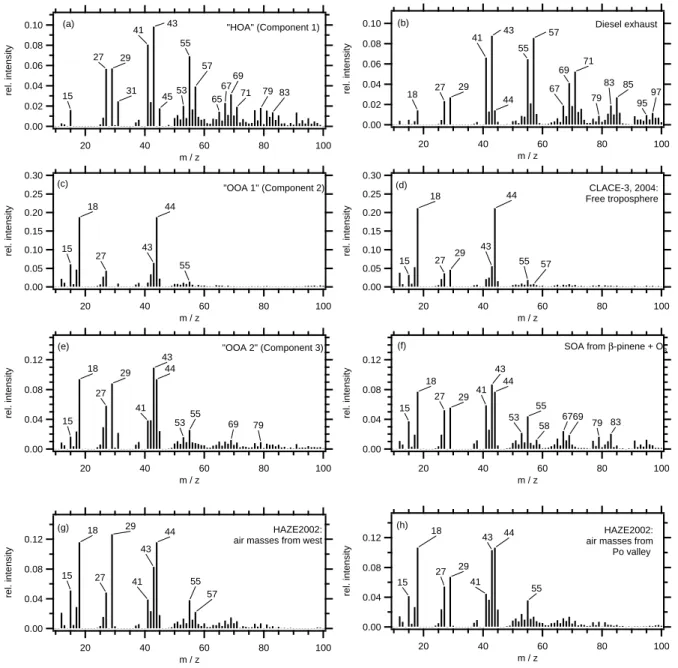
displayed in Fig. 6, along with previously recorded mass spectra that resemble the multicomponent analysis results: Panel (a) and (b) compare the HOA component with a mass spectrum from diesel engine exhaust particles measured on a
engine test dynamometer (Schneider et al., 2006). Both mass spectra are dominated by the ion series m/z 27, 29, 41, 43, 55, 57, 69, 71, 83, 85. . . , as has been reported previously for hydrocarbon-like organic aerosol (HOA) from fossil fuel
4 3 2 1 0 2 4 6 8 100 2 4 6 81000 2 4 dve (nm) (c) NH4 Org SO4 NO3 sum AMS dM (SMPS) dM (OPC) 15 10 5 0 2 4 6 8 100 2 4 6 81000 2 4 dve (nm) (b) NH4 Org SO4 NO3 sum AMS dM (SMPS) dM (OPC) 15 10 5 0 d M /d lo g Dva ( µ g m -3 ) 2 4 6 8 100 2 4 6 81000 2 4 dve (nm) (a) NH4 Org SO4 NO3 sum AMS dM (SMPS) dM (OPC)
Fig. 5. Mass size distributions measured with the Q-AMS, SMPS and OPC for the three time periods indicated in Fig. 4.
combustion sources (Canagaratna et al., 2004; McLafferty and Turecek, 1992; Zhang et al., 2005a, c, 2006).
Panel (c) and (d) compare the component OOA1 with a a mass spectrum of free tropospheric aerosol sampled at the High Alpine Research Station Jungfraujoch during the CLACE-3 project (Walter et al., 20071). In aged or-ganic aerosol (as encountered in the free troposphere) m/z 44 (CO+2) dominates, since the CO+2 has been found to be strongly associated with oxygenated organic compounds in aerosols (Alfarra et al., 2004; Zhang et al., 2005a), while in fresh anthropogenic emissions (as in diesel exhaust) m/z 44 contributes only to a small degree, compared to other peaks. Similar to m/z 44, m/z 18 (H2O+) is also a fragmentation
product of the vaporization of oxidized aerosol compounds that was found to be approximately equal in size as m/z 44 (Alfarra et al., 2004) and is therefore set equal to m/z 44 by the analysis software (Allan et al., 2004b).
Panels (e) and (f) compare the component OOA2 (which dominated the organic fraction) with a mass spectrum from secondary organic aerosol (SOA) particles from β-pinene ox-idation. In both mass spectra, the mass fragment m/z 43 (C3H+7 or C2H3O+) is the highest peak, followed by m/z 44
(and m/z 18). Further prominent peaks are m/z 41 (C3H+5
or C2HO+), m/z 29 (C2H5+or CHO+), m/z 27 (C2H+3), and m/z 55 (C4H+7 or C3H3O+). Although both mass spectra (e)
and (f) are not identical, the patterns are quite similar, indi-cating that the dominating component (OOA2) is influenced by secondary organic aerosol formation.
Similar mass spectrometric patterns for two different types of oxygenated organic aerosol were found by positive ma-trix factorization (PMF) from aerosol sampled at Zurich,
1Walter, S., S., Schneider, J., Hock, B. N., Curtius, J., Bor-rmann, S., Mertes, S., Weingartner, E., Verheggen, B., Cozic J., Baltensperger, U., Allan, J. D., Crosier, J., Bower, K., and Coe, H.: On the chemical composition of ice nuclei: Results from the 3rd and 4th Cloud and Aerosol Characterization Experiment (CLACE), Atmos. Chem. Phys. Discuss., in preparation, 2008.
Switzerland (Lanz et al., 2007). The source profile “OOA type I” displayed in Fig. 3 in Lanz et al. corresponds well to our aged organic aerosol “OOA1”. The second OOA com-ponent (“OOA type II”) in Lanz et al. is somewhat different from our “OOA2” component: We find a large contribution also of m/z 44 in this mass spectrum, while in “OOA type II” from Lanz et al., m/z 44 is completely missing.
Panels (g) and (h) show two mass spectra recorded dur-ing HAZE: The mass spectrum (g) was averaged over a time period when the air masses were arriving from the West (24 May 2002, 00:00–24 May 2002, 12:00), while the mass spec-trum (h) was averaged for a time period when air masses ar-rived from the Po Valley, Italy, and the organic mass concen-trations were highest (21 May 2002, 22:00–23 May 2002, 20:00, as indicated in Fig. 1). These mass spectra that were chosen only on the basis of trajectory analysis show certain differences that need to be discussed. The ratios m/z 29 to
m/z 27 as well at the ratios m/z 44 to m/z 43 and m/z 57
to m/z 55 are significantly higher in spectrum (g) than in spectrum (h). The finding that the ratio m/z 44 to m/z 43 is higher indicates that the organic aerosol components in these air masses have experienced more photochemical ag-ing than the aerosol particles arrivag-ing with the air masses from the polluted Po Valley. Aerosol particles emitted by industrial pollution in the Po Valley region have spent ap-proximately two days in the atmosphere before reaching the measurement station. Mass spectrum (h) can therefore be regarded as an example for photochemical conversion of an-thropogenic emitted aerosol particles. The high ratio of m/z 29 to m/z 27 (the highest of all spectra displayed in Fig. 6) might indicate influence of biomass burning (Alfarra et al., 2007) but m/z 29 is not unique to this source and therefore might have other explanations. Biomass burning does not ap-pear to be a likely source since no large contributions of res-idential wood burning are expected in May in southern Ger-many. Furthermore, the most indicative marker for biomass burning, m/z 60 (Schneider et al., 2006; Alfarra et al, 2007) is not found to be elevated in mass spectrum (g).
0.12 0.08 0.04 0.00 rel. intensity 100 80 60 40 20 m / z 18 43 44 29 27 41 15 55 HAZE2002: air masses from Po valley (h) 0.12 0.08 0.04 0.00 rel. intensity 100 80 60 40 20 m / z 29 18 44 43 15 27 41 55 57 HAZE2002: air masses from west
(g) 0.30 0.25 0.20 0.15 0.10 0.05 0.00 rel. intensity 100 80 60 40 20 m / z 18 44 43 29 27 15 CLACE-3, 2004: Free troposphere 57 55 (d) 0.10 0.08 0.06 0.04 0.02 0.00 rel. intensity 100 80 60 40 20 m / z 43 57 41 55 71 69 85 29 27 67 83 18 44 79 9597 Diesel exhaust (b) 0.10 0.08 0.06 0.04 0.02 0.00 rel. intensity 100 80 60 40 20 m / z 43 41 55 29 27 57 69 31 4553 67 71 79 15 65 83 "HOA" (Component 1) (a) 0.30 0.25 0.20 0.15 0.10 0.05 0.00 rel. intensity 100 80 60 40 20 m / z 18 44 43 15 27 55 (c) "OOA 1" (Component 2) 0.12 0.08 0.04 0.00 rel. intensity 100 80 60 40 20 m / z 43 18 29 44 27 41 55 15 (e) "OOA 2" (Component 3) 79 69 53 0.12 0.08 0.04 0.00 rel. intensity 100 80 60 40 20 m / z 43 18 44 41 29 27 55 15 67 53 69 83 79 58
(f) SOA from β-pinene + O3
Fig. 6. Comparison of the MCA results with reference mass spectra: (a) HOA (component 1) (b) Diesel exhaust measured at an engine test facility (Schneider et al., 2006); (c) OOA1 (component 2); (d) Free tropospheric aerosol measured at the Jungfraujoch station during CLACE-3 (Walter et al., 20071); (e) OOA2 (component 3); (f) SOA from β-pinene oxidation; (g) HAZE2002, averaged over the time period when the air masses arrived from westerly direction; (h) HAZE2002, averaged over the time period when the air masses arrived from the Po Valley
Figure 7 displays the diurnal pattern of the three compo-nents. The diurnal cycle is similar for all three components, with higher values between 09:00 and 21:00 and lower val-ues during nighttime between 21:00 and 09:00. The relative contribution of the three individual types to the total organic mass is nearly constant during the diurnal cycle. The max-imum during daylight hours reflects the photochemical pro-duction of aerosol of type OOA2, while the contribution of the aged organics fraction (OOA1) and the fossil fuel burn-ing related HOA play only a minor role in the diurnal
cy-cle. A further indication for the fact that direct emissions of HOA (e.g. traffic exhaust) play only a minor role in the diurnal cycle is the absence of the morning traffic peak be-tween 07:00 and 09:00. This morning traffic peak has been observed previously in urban measurements (Drewnick et al., 2004; Zhang et al., 2005b) where primary anthropogenic HOA emissions are more important.
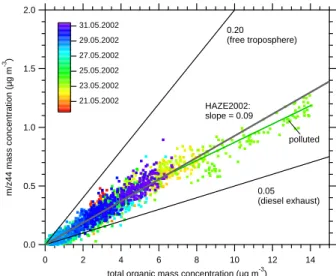
Figure 8 shows the correlation between the mass concen-tration of m/z 44 and the total organic mass concenconcen-tration for the measurements during HAZE2002. The data points
6 5 4 3 2 1 0 m a s s c o n c ., µ g m -3 0 :0 0 1 :0 0 1 :0 0 2 :0 0 2 :0 0 3 :0 0 3 :0 0 4 :0 0 4 :0 0 5 :0 0 5 :0 0 6 :0 0 6 :0 0 7 :0 0 7 :0 0 8 :0 0 8 :0 0 9 :0 0 9 :0 0 1 0 :0 0 1 0 :0 0 1 1 :0 0 1 1 :0 0 1 2 :0 0 1 2 :0 0 1 3 :0 0 1 3 :0 0 1 4 :0 0 1 4 :0 0 1 5 :0 0 1 5 :0 0 1 6 :0 0 1 6 :0 0 1 7 :0 0 1 7 :0 0 1 8 :0 0 1 8 :0 0 1 9 :0 0 1 9 :0 0 2 0 :0 0 2 0 :0 0 2 1 :0 0 2 1 :0 0 2 2 :0 0 2 2 :0 0 2 3 :0 0 2 3 :0 0 2 4 :0 0 20.0% 17.7% 62.3% "HOA" "OOA1" "OOA2"
Fig. 7. Diurnal patterns averaged over the whole measurement pe-riod of HOA, OOA1 and OOA2 obtained from the multicomponent analysis.
reveal an average regression slope of 0.09 for the HAZE2002 data. For comparison, the slopes from two other data sets are plotted: Data obtained from diesel exhaust particles that con-tain mainly hydrocarbon-like organic compounds (Panel b in Fig. 6) yield a slope of 0.05, while data measured in the free troposphere (Panel d in Fig. 6) are highly oxidized and re-veal a slope of 0.20. This implies that the ratio of m/z 44 to total organics measured with the Q-AMS can be used as an approximation for the degree of oxidation of organic aerosol compounds for ambient aerosol data. This method has al-ready been applied by Takegawa et al. (2005) for Tokyo city, who inferred a low degree of oxidation for a ratio of m/z 44 to total organics below 0.04 and a highly oxidized aerosol for a ratio above 0.08. Following this classification, the average aerosol observed during HAZE2002 was “highly” oxidized. However, it must be stressed that this method can only be applied in field data that are not influenced be fresh biomass burning emissions since biomass burning particles are likely to deviate from this behavior (Schneider et al., 2006). Mass spectrometric markers for biomass burning aerosol are m/z 60, m/z 73, and m/z 137 (Schneider et al., 2006; Alfarra et al., 2007). Although a small signature of m/z 60 is ob-served in the HAZE mass spectra, and m/z 60 was found to be weakly correlated with CO during HAZE2002 (r2=0.38), the MCA results do not indicate an biomass burning aerosol component. Thus we can conclude that the measurement site was not significantly influenced by biomass burning. This finding is not unexpected, because the domestic heating sea-son is over in Southern Germany during May and June, and no forest fires were noticed or reported in that area during our measurements. Also given in Fig. 8 is the slope of the part of the data when the air masses arrived from the Po Valley, Italy, and the organic mass concentrations were highest (21 May 2002, 22:00–23 May 2002, 20:00, labelled “polluted”). For these data, the slope is slightly lower (0.08), indicating a less oxidized aerosol and a higher influence of anthropogenic emissions. 2.0 1.5 1.0 0.5 0.0 m/z44 mass concentration (µg m -3 ) 14 12 10 8 6 4 2 0
total organic mass concentration (µg m-3)
21.05.2002 23.05.2002 25.05.2002 27.05.2002 29.05.2002 31.05.2002 0.20 (free troposphere) 0.05 (diesel exhaust) HAZE2002: slope = 0.09 polluted
Fig. 8. Correlation between the mass concentrations of m/z 44 and total organics along with ratios measured in the free troposphere (Walter et al., 20081) and in diesel exhaust (Schneider et al., 2006). The label “polluted” denotes only the data between 21 May 2002, 22:00 and 23 May 2002, 20:00, when the air masses originated from the Po valley.
3.3.2 Polycyclic aromatic hydrocarbons (PAHs) and pro-teins
Figure 9 shows the measured concentrations of polycyclic aromatic hydrocarbons (PAHs) and of proteins. PAHs are characteristic trace components of pyrogenic aerosols from fossil fuel combustion and biomass burning, whereas pro-teins are characteristic main components of primary biolog-ical particles. The PAH concentrations were mostly in the range of 0.2–0.4 ng m−3 and exhibited only little
variabil-ity, except for an increase towards the end of the measure-ment period which coincides with lower temperatures and may be attributable to local heating emissions. Even the el-evated concentrations observed at the end of the campaign (∼0.6 ng m−3), however, were much lower than the
concen-tration levels typically observed in the nearest metropoli-tan area (1–5 ng m−3, city of Munich, Schauer et al., 2004, 2003a) and in polluted urban areas around the world (20– 110 ng m−3 in Mexico city, 2003; Marr et al., 2006; up to 670 ng m−3 in Delhi, 2002/2003, Sharma et al., 2007). The low PAH concentrations (<1 ng m−3) are fully
consis-tent with the low EC concentrations (<1 µg m−3, Fig. 1) observed during HAZE2002; the mass fractions of PAH in diesel soot and the ratio of PAH to EC in atmospheric aerosol samples recently determined with the same analytical tech-niques were also on the order of 10−3to 10−4(Schauer et al., 2004, 2003a). Both the PAH and EC measurement re-sults indicate a low contribution of soot and other combustion emissions to the rural aerosols sampled during HAZE2002.
The measured protein concentrations varied in the range of 0.1–0.6 µg m−3and followed essentially the same temporal
1000 800 600 400 200 0 PAH (pg m -3 ) 16.5 18.5 20.5 22.5 24.5 26.5 28.5 30.5 01.6 Date Σ (12 PAHs) (a) 0.8 0.6 0.4 0.2 0.0 Proteins (µg m -3 ) 16.5 18.5 20.5 22.5 24.5 26.5 28.5 30.5 01.6 Date 8 6 4 2 0 OM1 (µm m -3 ) Proteins OM1 (b) 6x10⁻² 5 4 3 2 1 0 Proteins / PM 2.5 16.05.2002 20.05.2002 24.05.2002 28.05.2002 01.06.2002 Date Proteins / PM2.5 mean (c)
Fig. 9. PAHs und Proteins in PM2.5: (a) Sum of 12 PAHs; (b) Pro-teins (left scale) along with OM1 (right scale); (c) Ratio of proPro-teins to PM2.5 (mean: 0.029±0.011).
pattern as the concentrations of PM2.5 and OM1, with pro-nounced minima on 20–21 and 26–29 May. The ratios of proteins to OM1 and PM2.5 were fairly constant at ∼8% and
∼3%, respectively, indicating a substantial contribution of primary biogenic particles to the sampled rural aerosol. The relative abundance of proteins in biomass is typically on the order of ∼10%, suggesting that ∼30% of the rural PM2.5 sampled during HAZE2002 were of primary biological ori-gin. This first-order estimate is subject to high uncertainties with regard to the characteristic relative abundance of pro-teins in primary biogenic aerosol particles (∼1% for wood,
∼10% for leaves, up to ∼50% for microorganisms; GCEP, 2005; Banner et al., 1979; Briza et al., 1988; Zubkov et al., 1999) and potential interferences of humic or humic-like substances with the determination of proteins (Fehrenbach, 2006; Franze, 2004; Graber and Rudich, 2006; Ivleva et al., 2007). Thus, further chemical and biological speciation will be required to corroborate these findings. Nevertheless, they are in agreement with other recent studies indicating high abundances of primary biological particles in atmospheric aerosols (Zhang and Anastasio, 2003; Mikhailov et al., 2004; Jaenicke, 2005; P¨oschl, 2005; Despres et al., 2007; Elbert et al., 2007, and references therein). The identification of mass spectrometric markers for primary biological materials ap-pears desirable in order to quantify primary organic aerosol components with the AMS.
3.3.3 Dicarboxylic acids and monoterpenes
On 22 May 2002 and 23 May 2002, filter samples were taken with a time resolution of 3 h during the day (08:00 to 20:00) and 12 h during the night (20:00 to 08:00). These samples were analyzed for dicarboxylic acids originating from the oxidation of monoterpenes. At the same time gas-phase con-centrations of several monoterpenes (α-pinene, β-pinene, 3-carene and limonene) were measured online/in-situ. These data are depicted in Fig. 10, along with the aerosol mass con-centrations measured by the Q-AMS as well as O3, NOxand
OH gas-phase concentrations.
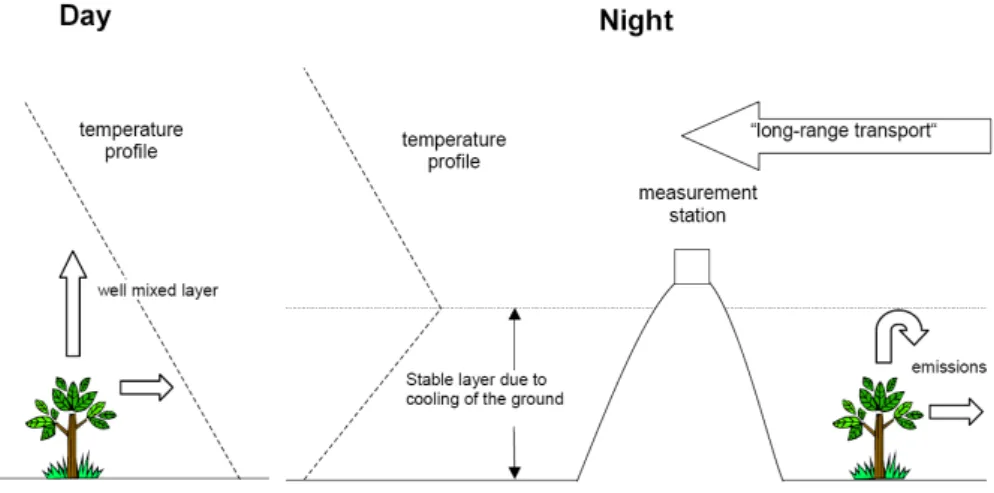
The gas-phase monoterpene concentrations show a sharp decrease during the night between 22 May 2002, 22:30, and 23 May 2002, 04:30. This time period is shaded grey in all four panels. Sabinic and ketolimonic acid also show a min-imum during this period. The total organic aerosol as mea-sured by the AMS does not show this minimum. We ex-plain this sharp nighttime decrease of the monoterpenes by the meteorological situation at Hohenpeissenberg (Fig. 11): the measurement station is located on the top of a small mountain that rises about 300 m above the surrounding area. During the night a stable layer is formed in the lower tropo-sphere due to cooling of the ground. Therefore vertical mix-ing is very low and the station on top of Hohenpeissenberg is isolated from the emission sources (e.g., monoterpene emit-ting trees) on the ground. Above this stable inversion layer, wind speeds are higher and air masses are transported hor-izontally. Consequently the night samples are not affected by local emissions around the sampling station but represent long-range transport of air masses. Any monoterpenes that might have been present in these air masses have already re-acted with the remaining ozone. Gas-phase concentrations of ozone and nitrogen oxides were still present at levels compa-rable to those during the day (ozone remained constant at around 60 ppb, NOxranged between 1.2 and 2.0 ppb). The
same is true for the longer-lived aerosol species such as am-monium sulfate, amam-monium nitrate, and for the concentra-tions of pinic and pinonic acid. The decrease of ketolimonic and sabinic acid during the night is consistent with a decrease in total organics from AMS. It might be due to lower bio-genic impact and lower emissions of the corresponding pre-cursor monoterpenes (limonene and sabinene (Warnke et al., 2006)) in the source area of the “aged” air mass. The atmo-spheric lifetimes of the dicarboxylic acids originating from terpene oxidation should be comparable. These compounds are assumed to be relatively stable and are removed from the atmosphere primarily by dry and wet deposition which should be very similar for the different compounds. Using the measured α-pinene and ozone concentrations, and yields determined in laboratory experiments, one would expect sub-stantially higher cumulative production than observed in the aerosol. However, little is known about the decay of these compounds in the particulate phase, which may be the reason
14 12 10 8 6 4 2 0
aerosol mass concentration (µg m
-3 ) 00:00 22.5 12:00 00:00 23.5 12:00 00:00 24.5 12:00 Date and Time
organics ammonium nitrate sulfate (a) 4 3 2 1 0 mass concentration (ng m -3 ) 50 40 30 20 10 0 pinonic acid (ng m -3 ) 00:00 22.5 12:00 00:00 23.5 12:00 00:00 24.5 12:00 Date and Time
pinic acid pinonic acid (right axis) sabinic acid ketolimonic acid caric acid (b) 40 30 20 10 0 concentration (ppt) 160 140 120 100 80 60 40 20 0 concentration (ppt) 00:00 22.5 12:00 00:00 23.5 12:00 00:00 24.5 12:00 Date and Time
α-pinene β-pinene (c) 3-carene limonene 100 80 60 40 20 0 O3 , NO x x10 (ppb) 8 6 4 2 0 OH (10 6 cm -3 ) 00:00 22.05.2002 12:00 00:00 23.05.2002 12:00 00:00 24.05.2002 12:00 Date and Time
O3 OH NOx
(d)
Fig. 10. Expanded time series 22 May to 24 May: (a) Non-refractory PM1 compounds (Q-AMS); (b) dicarboxylic acids; (c) gas-phase monoterpenes; (d) O3, NOx(multiplied by 10), and OH. Grey shading: time period where monoterpenes decrease to zero.
for the different behavior of the caboxylic acids displayed in Fig. 10.
3.4 New particle formation and growth
An additional objective of the HAZE2002 project was the investigation of new particle formation or nucleation events. During a previous long-term study, new particle formation events have been observed regularly on 18% of all days at
Fig. 11. Meteorological situation at the Hohenpeissenberg.
Hohenpeissenberg (Birmili et al., 2003). Here, we used the particle number concentration between 3 and 14 nm to iden-tify new particle formation events. These data, given in panel (b) of Fig. 1, reveal that new particle formation occurred al-most regularly every afternoon, with the strongest observed nucleation and growth events on 18 May 2002 and 21 May 2002. These two events will be analyzed in more detail in the following.
Figures 12 and 13 show the parameters relevant to nucle-ation and growth, measured on 18 May 2002 and on 21 May 2002, respectively. Panels (a) show the time series of num-ber size distribution, measured with the SMPS in a size range between 7 and 300 nm, Panels (b) show the particle concen-trations in different size ranges: The total particle concentra-tion Ntot(all particles with diameter >3 nm), and the
ultra-fine particle concentration N3−14 (size range 3–14 nm). On
18 May 2002, the background concentration of particles in a diameter range between 30 and 100 nm before the onset of nucleation is markedly higher than on 21 May. On both days, newly formed particles are detected in the SMPS sys-tem around 11:30. The growth of the particles in the course of the afternoon is only observed on 21 May. The particles grow in diameter from 25 nm at 11:30 until the modal diame-ter reaches 50 nm around 20:00 and remains stable afdiame-ter sun-set. The corresponding particle growth rate between 11:30 and 20:00 is 3 nm h−1. On 18 May the SMPS did not show the peak detected by the CPCs around 09:30 (Panel b), in-dicating that these particles had diameters below the lower cut-off size of the SMPS (7 nm). Assuming particles with di-ameters smaller than 7 nm at 09:30 and particle growth to 20 nm at 13:00, this corresponds to growth rates of about 4 nm h−1, a value that is similar to the growth rate of 3 nm h−1observed on 21 May. Both values agree well with pre-vious findings by Birmili et al. (2003) who found average growth rates of 2.6 nm h−1at Hohenpeissenberg. The ultra-fine particle number concentration on 18 May increases from 1780 cm−3at 07:44 to a maximum value of 10 990 cm−3at
09:55, while on 21 May, N3−14increases from 340 cm−3at
07:53 to 7100 cm−3at 10:55.
Panels (c) of Figs. 12 and 13 show the H2SO4 and
OH concentrations on both days, as measured with se-lected ion chemical ionization mass spectrometry (SI/CIMS) (Berresheim et al., 2000). On 18 May, a maximum H2SO4
concentration of 1.9×107cm−3is reached, on 21/05, H2SO4
reached up to 6×106cm−3. As shown in Panels (d), the day-time hours featured intense solar radiation of up to 6 and 6.6 J m2, temperatures up to 34◦C and 25◦C, and relative hu-midities of 50 and 70%, respectively. As additional infor-mation, the aerosol mass concentrations for organics, nitrate, sulfate, and ammonium measured on 21 May are displayed in Panel (e) of Fig. 13.
Numerous observations of nucleation rates and H2SO4
va-por concentration suggest the involvement of H2SO4 in
at-mospheric nucleation (e.g., Kulmala et al., 2004). Further-more, it is known that that under the presence of gas-phase ammonia, ternary H2SO4-H2O-NH3 nucleation is the
pre-ferred nucleation mechanism (Korhonen et al., 1999). This is confirmed by recent field studies: Results from the Pittburgh Air Quality Study (PAQS, 2002) showed that binary H2SO4
-H2O nucleation alone can not explain the observed
nucle-ation rates (Stanier et al., 2004) and that ternary H2SO4
-H2O-NH3nucleation can predict accurately the presence or
lack of nucleation (Gaydos et al., 2005). During the ANAR-ChE experiment in Atlanta, Georgia, McMurry et al. (2005), who measured also gas-phase H2SO4 and NH3, found that
nucleation occurred when H2SO4 concentrations exceeded
5×105cm3, and that the number of newly formed particles is sensitive to ammonia mixing ratios. Birmili et al. (2000) estimated that for ternary particle formation in the Hohen-peissenberg environment a concentration H2SO4in the range
of 1–2×107cm−3is required.
During HAZE, on 18 May 2002, the H2SO4
concentra-tions reached up to 1.9×107cm3 and coincided with high ultra fine particle concentrations of up to 1.1×104cm−3.
10 2 4 100 2 4 1000 2 4 Mobility diameter (nm) 10000 8000 6000 4000 2000 0 Number density (#/cm³)
(
a)
2.0x10⁷ 1.5 1.0 0.5 0.0 Concentration (cm -3 ) H2SO4 OH(
c)
2.0x10⁴ 1.5 1.0 0.5 0.0 Number concentration (#/cm³) Ntot (D > 3nm) N3-14(
b)
00:00 18.05.2002 06:00 12:00 18:00 00:00 19.05.2002 Date and Time50 40 30 20 10 0 Temperature (°C) 160 120 80 40 0 Relative humidity (%) 10 8 6 4 2 0 Global Radiation (J/m²) temperature
relative ambient humidity global radiation
(
d)
Fig. 12. Nucleation event on 18 May 2002. (a), (b) Particle number density; (c) Gas-phase concentration of H2SO4and OH; (d) Global
radiation, temperature, and relative humidity.
On 21 May 2002, H2SO4 concentrations reached up to
6×106cm−3. We estimate the particle formation rate of par-ticles between 3 and 14 nm, J3−14, by dividing the number
increase of particles between 3 and 14 nm by its correspond-ing duration. From the values obtained above from Panel (b) in Fig. 12 we infer an average rate J3−14of ≈1.2 cm3s1for
the nucleation event on 18 May 2002, and from Panel (b) in Fig. 13 a rate of ≈0.6 cm−3s−1 for 21 May 2002. Ko-rhonen et al. (1999) presented calculations for the ternary H2SO4/H2O/NH3 nucleation from which we can infer that
at an H2SO4 concentration of 6×106cm−3 and a
temper-ature of 298 K, significant nucleation can be expected for
NH3concentrations above 40 ppt. The ambient NH3
concen-tration at the Hohenpeissenberg area certainly exceeds this value, because the surrounding area of Hohenpeissenberg is mainly used for agriculture.
Summarizing, the observed new particle formation during HAZE2002 can be explained by ternary H2SO4-H2O-NH3
nucleation, a conclusion that is in agreement with previous observations at Hohenpeissenberg by Birmili et al. (2003), and also with observations reported by Zhang et al. (2004) on nucleation events at Pittsburgh, USA. However, our data do not allow to rule out that organic species were involved in the nucleation.
10 2 4 100 2 4 1000 2 4 Mobility diameter (nm) 10000 8000 6000 4000 2000 0 Number density (cm-3)
(
a)
14x103 12 10 8 6 4 2 0 Number concentration (cm -3 ) Ntot (D > 3nm) N3-14(
b)
8x10⁶ 6 4 2 0 Concentration (cm -3 ) H2SO4 OH(
c)
40 35 30 25 20 15 10 5 Temperature (°C) 8 6 4 2 0 Global Radiation (J/m²) 100 80 60 40 20 0 Relative humidity (%) temperaturerelative ambient humidity global radiation
(
d)
10 8 6 4 2 0Aerosol mass conc. (µg m
-3 )
00:00 21.05.2002
06:00 12:00 18:00 00:00
22.05.2002 Date and Time
NH4 Organics
NO3 SO4
(
e)
Fig. 13. Nucleation event on 21 May 2002. (a), (b) Particle number density; (c) Gas-phase concentration of H2SO4and OH; (d) Global
radiation, temperature, and relative humidity; (e) Aerosol mass concentrations measured with the Q-AMS.
The aerosol mass concentrations measured by the Q-AMS on 21 May 2002 (Fig. 13, Panel (e) can give information on further particle growth. The mass concentrations show an increase of all species between 11:00 and 14:00. This find-ing suggests that not only the species that trigger the nucle-ation (H2SO4, NH3), but also all other condensable species
are involved in the particle growth, especially organic sub-stances and nitrate. From data measured at Pittsburgh, Zhang et al. (2004) inferred that besides H2SO4and NH3, only
or-ganic species contributed to the particle growth, while nitrate plays only a minor role in particle growth. In a remote re-gion (Hyyti¨al¨a, Finland), Allan et al. (2006) observed that
the growing particles following nucleation events were ex-clusively organic in nature during the early stages of their evolution. Observations on Appledore Island, Maine, dur-ing ICARTT/CHAiOS 2004 also showed that condensation of organic species is an important process for nanoparticle growth (Russel et al., 2007). These findings are different from the observations made on 21 May during HAZE, be-cause as can be seen in Panel (e) of Fig. 13, nitrate appears to be an important constituent of the growing particles. Appar-ently, the availability of condensable species in the gas phase determines the composition of the growing particles follow-ing nucleation events.
4 Summary and conclusion
Microphysical properties and chemical composition of ru-ral continental aerosol particles have been measured during HAZE2002 with a wide range of instrumentation. The data yielded size-resolved information on the chemical compo-sition of the aerosol phase at a typical rural site in central Europe which also serves as a global GAW station.
Comparison between gravimetrically determined PM2.5 and mass spectrometrically determined non-refractory PM1 showed that on average 62% of PM2.5 was non-refractory PM1 material. The non-refractory PM1 was composed to 50% of organic and 50% of inorganic components. The rural continental organic aerosol was identified as being composed mainly of oxygenated aerosol from both the comparison of OM1 and OC2.5 (ratio: 2.1±1.4) as well as from the mass spectrometric composition: The multicomponent analysis of the Q-AMS data showed that the organic aerosol was only to about (20±17)% composed of hydrocarbon-like organic aerosol, indicating the low influence of fresh anthropogenic emissions on the measurement site. The oxygenated organic aerosol was found to be composed partly of an aged com-ponent, similar to organic aerosol observed in the free tro-posphere, but dominated by an aerosol type that resembled secondary organic aerosol from chamber experiments. The conclusion that the organic aerosol was dominated by SOA was confirmed by the diurnal cycle of the organic aerosol, indicating SOA production during during sunlight hours.
The high abundance of proteins (∼3%) indicated a high proportion of primary biological material (∼30%) in PM2.5. The low abundance of PAHs (<1 ng m−3) and EC
(<1 µg m−3) in PM2.5 confirmed the low contribution of
combustion emissions, which are usually also major sources for HOA. The influence of polluted air masses originating from the Po Valley, Italy, was clearly detectable during an episode and was confirmed by trajectory calculations.
The comparison between the mass size distribution mea-sured with the Q-AMS and the mass size distributions in-ferred from SMPS and OPC data showed good agreement if the density inferred from the chemical composition was used to convert volume into mass and vacuum aerodynamic
diameter into volume equivalent diameter. The refractive in-dex of the aerosol particle was found to be around 1.40–1.45. Wet removal of aerosol particles were investigated during a precipitation event. It was found that ammonium nitrate is most efficiently removed, while organics compounds were less efficiently removed, especially small organic particles. Furthermore, ammonium nitrate was observed to partition into the gas phase at temperatures above 293 K, while below 293 K, the ammonium mass fraction of the non-refractory PM1 remained almost constant at about 25%.
New particle formation events were observed during HAZE2002 (18 May 2002 and 21 May 2002). Dur-ing these nucleation events particle number densities ex-ceeding 104cm−3 in the nucleation mode (3–14 nm) were observed along with high sulfuric acid concentrations (∼6×106cm−3). The observed particle formation rates and
sulfuric acid concentrations and the estimated abundance of NH3 are in agreement with calculated nucleation threshold
for ternary nucleation and are also consistent with a previous long-term study and calculations.
Summarizing, it was found that the rural continental aerosol in spring 2002 at Hohenpeissenberg was very lit-tle influenced by fresh anthropogenic emissions, but mainly dominated by regional and long range transport. The organic aerosol compounds were highly oxidized (OOA to HOA ratio of 4:1), and contained around 30% primary biological mate-rial. Natural aerosol sources appear to play a major role in rural continental aerosol not only in the supermicron but also in the submicron size range. Since the measurement station was isolated from ground based sources due to a stable inver-sion layer during night-time, it can be concluded that these natural sources are important not only on a local but also on a regional scale.
Acknowledgements. We would like to thank T. B¨ottger and the GAW/MOHp staff for technical and data support during the campaign. T. Elste and G. Stange performed the OH and H2SO4 measurements, U. Kaminski provided the GAW/MOHp particle data, S. Gilge the trace gas data. We also thank T. Vetter for providing the Mie scattering program, J. D. Allan and all contributors for the Q-AMS evaluation software, Q. Zhang (SUNY, Albany) for the multicomponent analysis, and V. Lanz (EMPA, Switzerland) as well as two anonymous reviewers for many helpful comments. T. Franze, C. Schauer, and U. P¨oschl gratefully acknowledge funding by the German Federal Ministry of Education and Research (BMBF – AFO2000 CARBAERO) and support by R. Leube, S. Mahler, R. Niessner, and A. Zerrath.
References
Alfarra, M. R., Coe, H., Allan, J. D., Bower, K. N., Boudries, H., Canagaratna, M. R., Jimenez, J. L., Jayne, J. T., Garforth, A. A., Li, S. M., and Worsnop, D. R.: Characterization of urban and rural organic particulate in the Lower Fraser Valley using two Aerodyne Aerosol Mass Spectrometers, Atmos. Environ., 38, 5745–5758, 2004.
Alfarra, M. R., Pr´evˆot, A. S. H., Szidat, S., Sandradewi, J., Weimer, S., Lanz, V. A., Schreiber, D., Mohr, M., and Baltensperger, U.: Identification of the Mass Spectral Signature of Organic Aerosols from Wood Burning Emissions, Environ. Sci. Technol., 41, 5770–5777, 2007.
Allan, J. D., Bower, K. N., Coe, H., Boudries, H., Jayne, J. T., Canagaratna, M. R., Millet, D. B., Goldstein, A. H., Quinn, P. K., Weber, R. J., and Worsnop, D. R.: Submicron aerosol com-position at Trinidad Head, California, during ITCT 2K2: Its rela-tionship with gas phase volatile organic carbon and assessment of instrument performance, J. Geophys. Res.-Atmos., 109, D13S24, doi:10.1029/2003JD004208, 2004a.
Allan, J. D., Delia, A. E., Coe, H., Bower, K. N., Alfarra, M. R., Jimenez, J. L., Middlebrook, A. M., Drewnick, F., Onasch, T. B., Canagaratna, M. R., Jayne, J. T., and Worsnop, D. R.: A generalised method for the extraction of chemically resolved mass spectra from Aerodyne aerosol mass spectrometer data, J. Aerosol Sci., 35, 909–922, doi:10.1016/j.jaerosci.2004.02.007, 2004b.
Allan, J. D., Jimenez, J. L., Williams, P. I., Alfarra, M. R., Bower, K. N., Jayne, J. T., Coe, H., and Worsnop, D. R.: Quantita-tive sampling using an Aerodyne aerosol mass spectrometer – 1. Techniques of data interpretation and error analysis, J. Geophys. Res.-Atmos., 108, 4090, doi:10.1029/2002JD002358, 2003. Allan, J. D.,Alfarra, M. R., Bower, K. N., Coe, H. Jayne, J. T.,
Worsnop, D. R., Aalto, P. P.. Kulmala, M., Hy¨otyl¨ainen, T., Cav-alli, F., and Laaksonen, A.: Size and composition measurements of background aerosol and new particle growth in a Finnish forest during QUEST 2 using an Aerodyne Aerosol Mass Spectrome-ter, Atmos. Chem. Phys., 6, 315-327, 2006,
http://www.atmos-chem-phys.net/6/315/2006/.
Allen, A. G., Harrison, R. M., and Wake, M. T.: A meso-scale study of the behavior of atmospheric ammonia and ammonium, Atmos. Environ., 22, 1347–1353, 1988.
Bae, M.-S., Demerjian, K. L., and Schwab, J. J.: Seasonal esti-mation of organic mass to organic carbon in PM2.5 at rural and urban locations in New York state, Atmos. Environ., 40, 7467– 7479, 2006.
Banner, M. J., Mattick, L. R., Splittstoesser, D. F.: Chemical com-position of the ascospores of Byssochlamys fulva, J. Food Sci., 44, 545–548, 1979.
Berndt, T., B¨oge, O., Stratmann, F., Heintzenberg, J., and Kul-mala, M.: Rapid formation of sulfuric acid particles at near-atmospheric conditions, Science, 307, 698–700, 2005.
Berresheim, H., Elste, T., Plass-D¨ulmer, C., Eisele, F. L., and Tan-ner, D. J.: Chemical ionization mass spectrometer for long-term measurements of atmospheric OH and H2SO4, Interna-tional Journal of Mass Spectrometry, 202, 91–109, 2000. Birmili, W., Berresheim, H., Plass-D¨ulmer, C., Elste, T., Gilge,
S., Wiedensohler, A., and Uhrner, U.: The Hohenpeissenberg aerosol formation experiment (HAFEX): a long-term study in-cluding size-resolved aerosol, H2SO4, OH, and monoterpenes
measurements, Atmos. Chem. Phys., 3, 361–376, 2003, http://www.atmos-chem-phys.net/3/361/2003/.
Birmili, W., Wiedensohler, A., Plass-D¨ulmer, C., and Berresheim, H.: Evolution of newly formed aerosol particles in the continen-tal boundary layer: A case study including OH and H2SO4 mea-surements, Geophys. Res. Lett., 27, 2205–2208, 2000.
Bohren, C. F. and Huffmann, D. R.: Absorption and scattering of light by small particles, Wiley and Sons, New York, 1983. Bonn, B. and Moortgat, G. K.: New particle formation during
alpha- and beta-pinene oxidation by O3, OH and NO3, and the influence of water vapour: particle size distribution studies, At-mos. Chem. Phys., 2, 183–196, 2002,
http://www.atmos-chem-phys.net/2/183/2002/.
Bonn, B. and Moortgat, G. K.: Sesquiterpene ozonolysis: Origin of atmospheric new particle formation from biogenic hydrocarbons, Geophys. Res. Lett., 30, 1585, doi:10.1029/2003GL017000, 2003.
Briza, P., Ellinger, A., , Winkler, G., and Breitenbach, M.: Chemical Composition of the Yeast Ascospore Wall, Journal of Biological Chemistry, 263, 11 569–11 574, 1988.
Broekhuizen, K., Chang, R. Y.-W., Leaitch, W. R., Li, S.-M., and Abbatt, J. P. D.: Closure between measured and modeled cloud condensation nuclei (CCN) using size-resolved aerosol composi-tions in downtown Toronto, Atmos. Chem. Phys., 6, 2513–2524, 2006,
http://www.atmos-chem-phys.net/6/2513/2006/.
Canagaratna, M. R., Jayne, J. T., Ghertner, D. A., Herndon, S., Shi, Q., Jimenez, J. L., Silva, P. J., Williams, P., Lanni, T., Drewnick, F., Demerjian, K. L., Kolb, C. E., and Worsnop, D. R.: Chase studies of particulate emissions from in-use New York City vehi-cles, Aerosol Sci. Technol., 38, 555–573, 2004.
Canagaratna, M. R., Jayne, J. T., Jimenez, J. L., Allan, J. D., Al-farra, M. R., Zhang, Q., Onasch, T. B., Drewnick, F., Coe, H., Middlebrook, A., Delia, A., Williams, L. R., Trimborn, A. M., Northway, M. J., DeCarlo, P. F., Kolb, C. E., Davidovits, P., and Worsnop, D. R.: Chemical and microphysical characterization of ambient aerosols with the Aerodyne aerosol mass spectrometer, Mass Spectrometry Reviews, 26, 185–222, 2007.
Cubison, M. J., Alfarra, M. R., Allan, J., Bower, K. N., Coe, H., McFiggans, G. B., Whitehead, J. D., Williams, P. I., Zhang, Q., Jimenez, J. L., Hopkins, J., and Lee, J.: The characterisation of pollution aerosol in a changing photochemical environment, Atmos. Chem. Phys., 6, 5573-5588, 2006,
http://www.atmos-chem-phys.net/6/5573/2006/.
Curtius, J.: Nucleation of atmospheric aerosol particles, Comptes Rendus Physique, 7, 1027–1045, 2006.
DeCarlo, P. F., Slowik, J. G., Worsnop, D. R., Davidovits, P., and Jimenez, J. L.: Particle morphology and density characterization by combined mobility and aerodynamic diameter measurements. Part 1: Theory, Aerosol Sci. Technol., 38, 1185–1205, 2004. Despres, V., Nowoisky, J., Klose, M., Conrad, R., Andreae, M. O.,
and P¨oschl, U.: Characterization of primary biogenic aerosol particles in urban, rural, and high-alpine air by DNA sequence and restriction fragment analysis of ribosomal RNA genes, Bio-geosciences, 4, 1127-1141, 2007,
http://www.biogeosciences.net/4/1127/2007/.
Drewnick, F., Jayne, J. T., Canagaratna, M., Worsnop, D. R., and Demerjian, K. L.: Measurement of ambient aerosol composition during the PMTACS-NY 2001 using an aerosol mass