HAL Id: hal-00303159
https://hal.archives-ouvertes.fr/hal-00303159
Submitted on 2 Nov 2007HAL is a multi-disciplinary open access
archive for the deposit and dissemination of sci-entific research documents, whether they are pub-lished or not. The documents may come from teaching and research institutions in France or abroad, or from public or private research centers.
L’archive ouverte pluridisciplinaire HAL, est destinée au dépôt et à la diffusion de documents scientifiques de niveau recherche, publiés ou non, émanant des établissements d’enseignement et de recherche français ou étrangers, des laboratoires publics ou privés.
Factors influencing the large-scale distribution of Hg° in
the Mexico City area and over the North Pacific
R. Talbot, H. Mao, E. Scheuer, J. Dibb, M. Avery, E. Browell, G. Sachse, S.
Vay, D. Blake, G. Huey, et al.
To cite this version:
R. Talbot, H. Mao, E. Scheuer, J. Dibb, M. Avery, et al.. Factors influencing the large-scale distribution of Hg° in the Mexico City area and over the North Pacific. Atmospheric Chemistry and Physics Discussions, European Geosciences Union, 2007, 7 (6), pp.15533-15563. �hal-00303159�
ACPD
7, 15533–15563, 2007
Large-scale distribution of Hg◦
over the Pacific R. Talbot et al. Title Page Abstract Introduction Conclusions References Tables Figures ◭ ◮ ◭ ◮ Back Close
Full Screen / Esc
Printer-friendly Version
Interactive Discussion Atmos. Chem. Phys. Discuss., 7, 15533–15563, 2007
www.atmos-chem-phys-discuss.net/7/15533/2007/ © Author(s) 2007. This work is licensed
under a Creative Commons License.
Atmospheric Chemistry and Physics Discussions
Factors influencing the large-scale
distribution of Hg
◦
in the Mexico City area
and over the North Pacific
R. Talbot1, H. Mao1, E. Scheuer1, J. Dibb1, M. Avery2, E. Browell2, G. Sachse2, S. Vay2, D. Blake3, G. Huey4, and H. Fuelberg5
1
Institute for the Study of Earth, Oceans, and Space, Climate Change Research Center, University of New Hampshire, Durham, NH 03824, USA
2
NASA Langley Research Center, Chemistry and Dynamics Branch, Hampton, VA 23681, USA
3
University of California – Irvine, Department of Chemistry, Irvine, CA 92697, USA
4
Department of Earth and Atmospheric Sciences, Georgia Institute of Technology, Atlanta, GA 30332, USA
5
Department of Meteorology, Florida State University, Tallahassee, FL 32306, USA
Received: 19 September 2007 – Accepted: 24 October 2007 – Published: 2 November 2007 Correspondence to: R. Talbot (robert.talbot@unh.edu)
ACPD
7, 15533–15563, 2007
Large-scale distribution of Hg◦
over the Pacific R. Talbot et al. Title Page Abstract Introduction Conclusions References Tables Figures ◭ ◮ ◭ ◮ Back Close
Full Screen / Esc
Printer-friendly Version
Interactive Discussion
EGU Abstract
Gas-phase elemental mercury (Hg◦) was measured aboard the NASA DC-8 aircraft during the Intercontinental Chemical Transport Experiment Phase B (INTEX-B) cam-paign in spring 2006. Flights were conducted around Mexico City and on two sub-sequent deployments over the North Pacific based out of Honolulu, Hawaii and An-5
chorage, Alaska. Data obtained from 0.15–12 km altitude showed that Hg◦ exhibited a relatively constant vertical profile centered around 100 ppqv. Highly concentrated pollution plumes emanating from the Mexico City urban agglomeration revealed that mixing ratios of Hg◦ as large as 500 ppqv were related to combustion tracers such as CO, but not SO2which is presumably released locally from coal burning, refineries, and 10
volcanoes. Our analysis of Mexico City plumes indicated that widespread multi-source urban/industrial emissions may have a more important influence on Hg◦ than specific point sources. Over the Pacific, correlations with CO, CO2, CH4, and C2Cl4 were
dif-fuse overall, but recognizable on flights out of Anchorage and Honolulu. In distinct plumes originating from the Asian continent the Hg◦- CO relationship yielded an aver-15
age value of ∼0.56 ppqv/ppbv, in good agreement with previous findings. A prominent feature of the INTEX-B dataset was frequent total depletion of Hg◦in the upper tropo-sphere when stratospherically influenced air was encountered. Ozone data obtained with the differential absorption lidar (DIAL) showed that the stratospheric impact on the tropospheric column was a common and pervasive feature on all flights out of Honolulu 20
and Anchorage. We propose that this is likely a major factor driving large-scale sea-sonality in Hg◦ mixing ratios, especially at mid-latitudes, and an important process that should be incorporated into global chemical transport models.
1 Introduction
In the lower troposphere (0–6 km) elemental mercury (Hg◦) is observed ubiqui-25
tously with contemporary mixing ratios at the parts per quadrillion by volume (ppqv; 15534
ACPD
7, 15533–15563, 2007
Large-scale distribution of Hg◦
over the Pacific R. Talbot et al. Title Page Abstract Introduction Conclusions References Tables Figures ◭ ◮ ◭ ◮ Back Close
Full Screen / Esc
Printer-friendly Version
Interactive Discussion 1 ng m−3=112 ppqv) level. Accumulation of mercury in lake sediments of both
hemi-spheres shows a worldwide increase in its atmospheric deposition that is highly corre-lated with industrialization and emissions of CO2from combustion of fossil fuels (Lam-borg et al., 2002). Although atmospheric measurements are exceedingly sparse, mix-ing ratios near the Earth’s surface appear to have decreased from the mid- 1980’s 5
to 1990’s and stayed constant thereafter (Slemr and Scheel, 1998; Ebinghaus et al., 2002; Slemr et al., 2003; Kim et al., 2005).
The sources and sinks of atmospheric mercury are just beginning to be character-ized and quantified. Anthropogenic sources appear to be dominated by emissions from combustion of coal, waste incineration, space heating, transportation, mining, 10
and chlor-alkali facilitites (Seigneur et al., 2004, 2006). Natural emissions occur from mercury-enriched soils and vegetation, forest fires, volcanoes, and the oceans (Sigler et al., 2003; Sigler and Lee, 2006; Brunke et al., 2001; Friedli et al., 2001, 2003a, 2003b, 2004; Ebinghaus et al., 2007). Global budget estimates put anthropogenic sources at ∼2100 metric tons yr−1with nearly equal amounts derived from natural pro-15
cesses and re-emission (Seigneur et al., 2004; Mason and Sheu, 2002; Pacyna and Pacyna, 2002), for a total input of 6000–6500 metric tons yr−1 (Streets et al., 2005). However, accurate estimation of natural source strengths is confounded by re-emission of anthropogenic mercury that has deposited to ecosystems and oceans.
There have been few measurements of Hg◦over the North Pacific. The first airborne 20
observations were made during the ACE-Asia 2001 campaign over the western Pacific. Plumes containing industrial emissions contained the highest levels that reached 706, 336, and 336 ppqv from China, Korea, and Japan respectively (Friedli et al., 2004). Background concentrations of Hg◦from the surface to 7 km were estimated to be about 146 ppqv. Overall, the vertical distribution of Hg◦was ∼224 ppqv at 0.5 km, decreasing 25
slightly to 190 ppqv from 1 to 6 km, and then again sharply to 146 ppqv at 7 km. In a later ground-based study directly downwind of Asian continental outflow at Okinawa, Japan, the mean Hg◦ concentration was 224 ppqv over the period 23 March to 2 May 2004 (Jaffe et al., 2005).
ACPD
7, 15533–15563, 2007
Large-scale distribution of Hg◦
over the Pacific R. Talbot et al. Title Page Abstract Introduction Conclusions References Tables Figures ◭ ◮ ◭ ◮ Back Close
Full Screen / Esc
Printer-friendly Version
Interactive Discussion
EGU
Asian Hg◦ emissions have also been assessed through sampling on the U.S. west coast at Mount Bachelor, Oregon. The site is located at 2.7 km altitude, with discreet Asian pollution plume events sampled periodically during springtime. The instrument arrangement measured total gaseous and particulate Hg (TGM) with an average con-centration of 198 ppqv from 28 March to 19 May 2004 (Weiss-Penzias et al., 2006). 5
Time periods impacted by Asian emissions were identified by TGM-CO ratios charac-teristic of Asian sources (∼0.005 ng m−3/ppbv or 0.56 ppqv/ppbv). The largest of these events (25 April) exhibited a TGM concentration near 280 ppqv, and a TGM-CO ratio of 0.045 ng m−3/ppbv or 5.0 ppqv/ppbv (Jaffe et al., 2005; Weiss-Penzias et al., 2006).
Over the eastern Pacific in spring 2002, Radke et al. (2007) found much lower con-10
centrations where the median ranged from 134 ppqv at 0.5 km to 56 ppqv at 8 km dur-ing the Intercontinental Transport and Chemical Transformation Experiment – 2002 (ITCT2K2). Using the variance of their measurements, a lifetime of ∼100 days was determined for Hg◦compared to earlier estimates that suggested a much longer time-frame of 0.5–2 years (Schroeder and Munthe, 1998).
15
The Tropospheric Chemistry Program (TCP) at the National Aeronautics and Space Administration has conducted airborne science missions over the past 25 years to un-derstand the human impact on the global atmosphere (McNeal et al., 1998). A primary focus has been on quantifying the impact of long-range transport of trace gases and aerosols on the changing chemical composition of the troposphere. Special emphasis 20
has been placed on the North Pacific troposphere due to accelerating Asian emis-sions during the last two decades (Streets et al., 2001). Four major Pacific expeditions have been conducted by the TCP since 1991 (Hoell et al., 1996, 1997; Jacob et al., 2003), with the Intercontinental Chemical Transport Experiment Phase B (INTEX-B) being the most recent one in spring 2006. Instrumentation for measurement of Hg◦ 25
was integrated into the University of New Hampshire (UNH) flight package for INTEX-B to examine its large-scale distribution in North Pacific air masses traveling toward the North American continent.
ACPD
7, 15533–15563, 2007
Large-scale distribution of Hg◦
over the Pacific R. Talbot et al. Title Page Abstract Introduction Conclusions References Tables Figures ◭ ◮ ◭ ◮ Back Close
Full Screen / Esc
Printer-friendly Version
Interactive Discussion
2 Methods
2.1 Field deployments
The INTEX-B flight series was conducted in two deployments, with the first component based out of Houston, Texas, and the second half split between Honolulu, Hawaii and Anchorage, Alaska. The six Houston flights (4–19 March 2006) were focused on the 5
Mexico City area and the MILAGRO mega-city air quality study occurring there 1–30 March 2006. After a three-week break with the aircraft based at Moffett Field, Cal-ifornia, the DC-8 flew three flights out of Honolulu (23–28 April 2006) and then four additional flights from Anchorage (4–12 May 2006). There were an additional 3 transit flights between the hub locations. Mercury measurements were not obtained during 10
the initial transit from Grand Forks, North Dakota to Houston and then on the first lo-cal flight (#3) due to a data acquisition problem with the computer. Once this was corrected, data was obtained on all remaining flights.
2.2 Airborne measurements
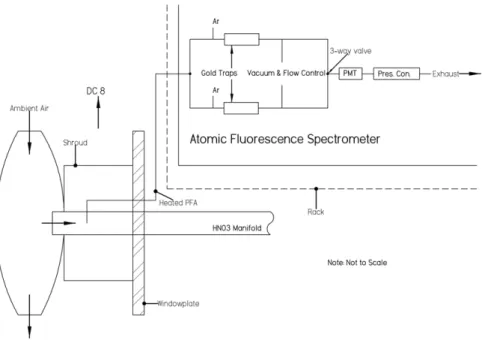
The inlet arrangement utilized our existing high flow manifold (1500 standard liters per 15
minute) for HNO3(Talbot et al., 1997a, 1999). It is designed with a diffuser that boosts the internal pressure of the inlet by up to 150 mbar over ambient to facilitate attaining high flow rates in the upper troposphere, especially when the DC-8 is cruising at Mach 0.88 (Fig. 1). The diffuser and shroud assembly was anodized with mil-spec coating MIL-A-8625E, Chromic Type 1, Class Z with black color. This provided a very hard 20
and smooth surface over the aluminum which reduced drag significantly and acted as an inert surface. The manifold pipe was coated with a vapor deposited fused-silica and heated to 40◦C during flight. Flow was maintained by ram pressure and a 400 Hz blower on the exhaust port. For the Hg◦ measurements the high flow air stream was sub-sampled through a heated (40◦C) PFA Teflon line just a few centimeters after the 25
ACPD
7, 15533–15563, 2007
Large-scale distribution of Hg◦
over the Pacific R. Talbot et al. Title Page Abstract Introduction Conclusions References Tables Figures ◭ ◮ ◭ ◮ Back Close
Full Screen / Esc
Printer-friendly Version
Interactive Discussion
EGU
A modified Tekran 2537A cold vapor atomic fluorescence spectrometer was used to measure Hg◦in a sequential dual channel arrangement with a 150 s time response and limit of detection of ∼10 ppqv. Constant mass flow was stabilized through the instrument by the addition of a vacuum source from one of our venturi pumps used for aerosol sampling. The internal pressure of the instrument was maintained during 5
the analysis stage at a slight overpressure to sea level using upstream control set to 1100 hPa. Mercury-free zero air was generated onboard the DC-8 using cabin air and our own Hg-stripping cartridge train assembly. Zeroing was performed in-flight, and there was no detectable Hg◦in the zero air stream at any time during INTEX-B.
To the best of our knowledge, we conducted the first in-flight standard additions for 10
Hg◦. On non-flight days these were conducted on the ground and then on every sci-ence flight at altitudes ranging from 1–12 km. Overall, the Hg◦ permeation rate was reproducible to within ±9.2% at 0.098±0.009 ng min−1(n=312). Instrument calibration was cross-checked using injections from the headspace of a thermoelectrically cooled Hg◦ reservoir (Tekran model 2505). This was done during instrument integration prior 15
to field deployment, and then again back at UNH after INTEX-B was completed. The calibration was reproducible to within ±3% over this five month time period. The re-sponse factor (peak area counts pg−1Hg◦) was calculated for each of the two channels and found to be constant to ±1% for the entire data set (Fig. 2). The average response factor for each channel (7170 and 7325 counts pg−1) was used in the preparation of 20
the final data to provide an internally consistent data product.
The precision of the measurements was assessed by sampling ambient air at ground level using three co-located 2537A instruments. This was done at our local AIRMAP (http://www.airmap.unh.edu) field site (Thompson Farm) in Durham, New Hampshire (Mao and Talbot, 2004) immediately after the INTEX-B campaign. These instruments 25
were inter-calibrated using a syringe injection from a Tekran 2505 unit prior to the am-bient air measurement time periods. We found that two brand new instruments agreed within ±4–5%, while including a one-year old instrument in the average increased it to ±8–10%. Based on these comparisons, it appears that the precision is on the order of
ACPD
7, 15533–15563, 2007
Large-scale distribution of Hg◦
over the Pacific R. Talbot et al. Title Page Abstract Introduction Conclusions References Tables Figures ◭ ◮ ◭ ◮ Back Close
Full Screen / Esc
Printer-friendly Version
Interactive Discussion ±10%. The accuracy of the Hg◦ measurements should be around ±5% due to careful
calibration with the headspace injections. This may need to be re-assessed when rig-orous calibration standards are available from the U.S. National Institute of Standards and Technology.
The Tekran instrument measures TGM (Hg◦ + RGM) as Hg◦ (reactive gaseous mer-5
cury = RGM = HgCl2 + HgBr2+ HgOBr + . . . ). However, we are not aware of any
published information on the direct response of the 2537A to RGM species. At this time we do not have a reliable RGM calibration source in which we have high confi-dence regarding its operation and output; this is work in progress. In addition, we are unsure of the passing efficiency of RGM through our heated PFA line, but we config-10
ured our inlet design to facilitate its quantitative transfer based on extensive experience with airborne HNO3measurements. We believe that it should pass RGM with high
ef-ficiency based on our current understanding of measuring highly reactive trace gases. In practice the amount of TGM measured over a several minute time interval essentially represents Hg◦unless there is an unusually large amount of RGM present. In most en-15
vironments, a few minute sampling resolution for RGM is too short to contribute to the measured TGM. Although the distribution of RGM is not known with much certainty, it is predicted to increase with altitude reaching ∼25 ppqv at 12 km (Selin et al., 2007). Until we have a better understanding of atmospheric mercury and its speciation, we have chosen to report our TGM measurements as Hg◦.
20
The complementary data used here from numerous instruments has a long history of inclusion in the DC-8 TCP payload, and the techniques were essentially identical to those described previously by Jacob et al., (2003). Our analysis utilized data for in situ O3, CO, CO2, CH4, hydrocarbons, halocarbons, and remotely sensed O3from the
DIAL. For the in situ measurements, the TCP data center generated a merged product 25
averaged to the Hg◦time stamp. This was used extensively to understand the principal factors influencing the large-scale distribution of Hg◦during INTEX-B.
ACPD
7, 15533–15563, 2007
Large-scale distribution of Hg◦
over the Pacific R. Talbot et al. Title Page Abstract Introduction Conclusions References Tables Figures ◭ ◮ ◭ ◮ Back Close
Full Screen / Esc
Printer-friendly Version
Interactive Discussion
EGU 3 Large-scale distribution
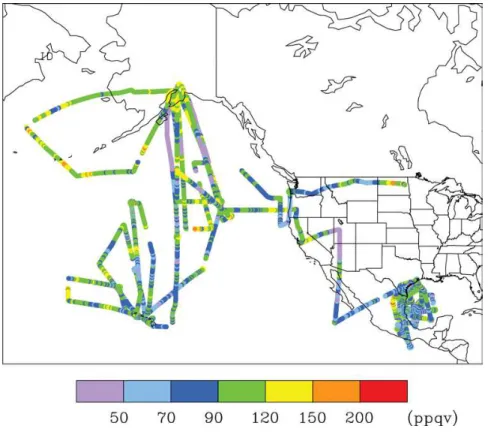
The large-scale distribution of Hg◦during flights 4–19 is presented in Fig. 3. The major-ity of Hg◦mixing ratios fell within the range of 60–150 ppqv in all three sampling regions. Exceptions to this were Hg◦ mixing ratios of 200-500 ppqv in plumes in the vicinity of Mexico City and Hg◦dropping to essentially zero in air masses at ≥10 km altitude that 5
were impacted by stratospheric inputs. Relatively few distinct plumes of Asian conti-nental outflow (>200 ppqv) were encountered over the eastern North Pacific. These interesting cases of high and low Hg◦ are examined in more detail in Sects. 3.2 and 3.3.
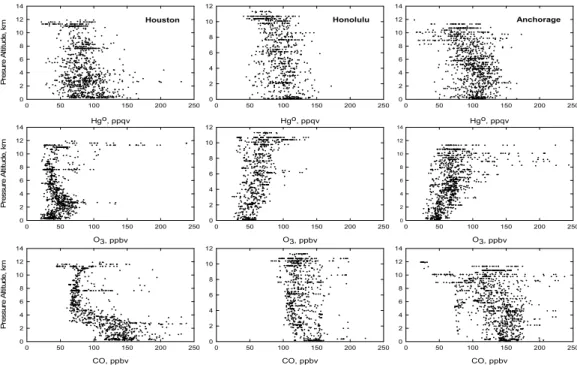
The vertical distribution of Hg◦, O3, and CO, covering the latitudinal band of 14◦– 10
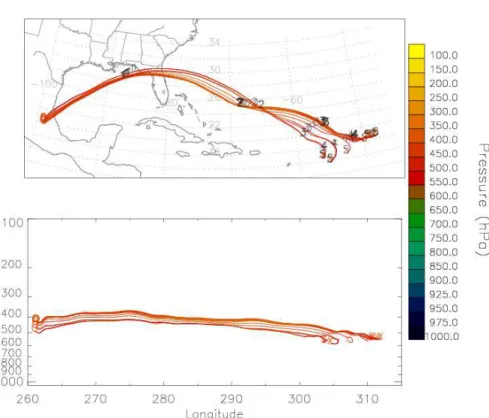
62◦N over the North Pacific basin, is presented in Fig. 4. An interesting feature of the data from the Mexico City area was the strikingly reduced mixing ratios of CO, and to a lesser extent O3, above 4 km altitude. Backward trajectories indicated that air masses sampled in the middle and upper troposphere originated over the tropical North Atlantic. To illustrate this point, a 5-day kinematic backward trajectory, calculated 15
by the Florida State University group, is shown in Fig. 5. This trajectory corresponded to a constant altitude leg flown near the midpoint of flight 7. If the trajectories are run backward farther in time, most of them meander in the equatorial region north of the Inter-Tropical Convergence Zone. This indicates that these air masses aged photochemically over the remote tropical North Atlantic.
20
The DIAL data show that there was a preponderance of low O3 in the 20-40 ppbv
range up to 12 km altitude. This was apparent in the DIAL data for every flight con-ducted in the Mexico City area, and we use flight 7 to depict this pronounced feature in the vertical distribution (Fig. 6). The associated air masses most likely originated at low altitude over the equatorial Atlantic and were lifted to higher altitudes by convective 25
activity, as observed over the Pacific on previous DC-8 airborne missions (Browell et al., 1996, 2001, 2003a). The fact that Hg◦ did not follow the CO altitude trend (Fig. 4) indicates that it is not being depleted rapidly in the Tropics. This suggests that oxidation
ACPD
7, 15533–15563, 2007
Large-scale distribution of Hg◦
over the Pacific R. Talbot et al. Title Page Abstract Introduction Conclusions References Tables Figures ◭ ◮ ◭ ◮ Back Close
Full Screen / Esc
Printer-friendly Version
Interactive Discussion processes and conversion to RGM with subsequent removal by convective scavenging
were not efficient sinks during this season. In particular, abundant equatorial OH does not appear to have a large impact on the Hg◦distribution. Indeed, slow removal of Hg◦ in the troposphere by OH was surmised recently through theoretical considerations by Calvert and Lindberg (2005).
5
Our data provide the first detailed look at the vertical distribution of Hg◦in the middle and upper troposphere (Fig. 4). In moving from low to high latitudes we observed the expected patterns in O3and CO: (1) a general increase in CO and the presence of
dis-tinct plumes due to transport of Asian emissions across the Pacific and, (2) an increas-ing impact of the stratosphere on the troposphere above 6 km resultincreas-ing in increased 10
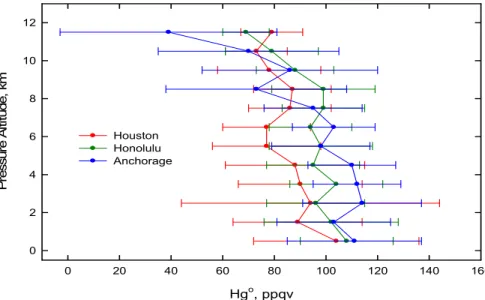
O3and decreased CO. The overall corresponding latitudinal trends in Hg◦were subtle, as illustrated by the data binned (average ± standard deviation) in 1 km increments (Fig. 7). In the boundary layer mixing ratios of Hg◦ were essentially indistinguishable between the three study regions. From 2–7 km the average mixing ratio of Hg◦ was lowest around Mexico City and as much as 25 ppqv higher at mid-to-high latitudes over 15
the north Pacific. Above 8 km there was little variation in the average mixing ratios of Hg◦ observed during the Mexico City based flights, with values centered around 80 ppqv. As the study area moved northward, sharp decreases in average values were documented. At 11.5 km altitude, the steepest decline occurred in the high latitude flights out of Anchorage where the average mixing ratio of Hg◦was 39±42 ppqv with a 20
median of 13 ppqv. These low mixing ratios were driven by the substantial number of 150 s measurement intervals with no detectable Hg◦ (Talbot et al., 2007).
There have been few measurements of Hg◦ over the oceans. Laurier et al. (2003) found a relatively constant 280 ppqv over the North Pacific during a May 2002 cruise between Osaka, Japan, and Honolulu, Hawaii. These relatively high concentrations 25
were collected about ∼10 m above the sea surface and could be influenced by recent oceanic emissions of Hg◦. During ACE-Asia 2001 over the western Pacific Friedli et al. (2004) observed an average TGM concentration of about ∼225 ppqv in the marine boundary layer (MBL). Over the eastern Pacific just offshore from California, Oregon,
ACPD
7, 15533–15563, 2007
Large-scale distribution of Hg◦
over the Pacific R. Talbot et al. Title Page Abstract Introduction Conclusions References Tables Figures ◭ ◮ ◭ ◮ Back Close
Full Screen / Esc
Printer-friendly Version
Interactive Discussion
EGU
and Washington in spring 2002, measurements of Hg◦ during ITCT2K2 yielded an average MBL concentration of ∼135±22 ppqv (Radke et al., 2007). The Radke et al. (2007) data are well within the range of our MBL (<2 km) grand mean value of 105±27 ppqv (n=691).
We note that, on the average and over a large geographic region, there was no 5
noticeable removal of Hg◦in the MBL based on the vertical profiles. The following sce-nario, which is largely speculative, may explain this result. In the MBL, rapid oxidation of Hg◦ through reactions with marine-derived halogen species (e.g., Cl, Br, Cl2, Br2,
BrCl, BrO) (Oum et al., 1998; Knipping et al., 2000; Laurier et al., 2003) to form RGM and particulate mercury (HgP) may lead to efficient loss of mercury via dry and wet 10
deposition. In the surface ocean RGM may be reduced to Hg◦ and reemitted to the atmosphere (Laurier et al., 2003; Mason and Sheu, 2002). Rapid ocean-atmosphere recycling of Hg◦ in the MBL (Strode et al., 2007) could account for our observed Hg◦ and obscure the oceanic sink.
3.1 Correlation with source tracer species 15
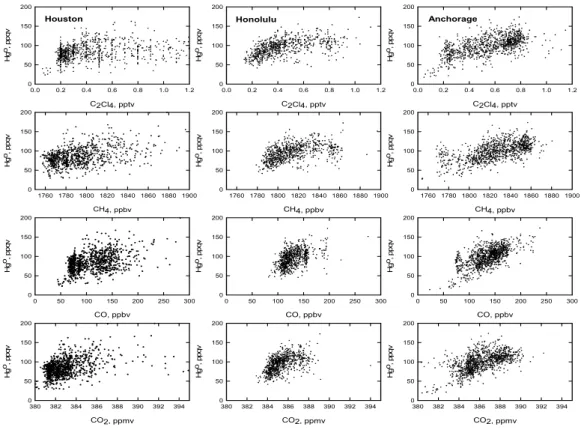
Regional correlations between Hg◦ and CO, CO2, CH4, and C2Cl4 are illustrated in
Fig. 8. Although these relationships are somewhat diffuse, they suggest a continental urban source for Hg◦ in the sampled air masses, especially at latitudes downwind of Asian and possibly European sources. It is well known that there is rapid and sub-stantial export of polluted air masses to the North Pacific from the Asian continent in 20
springtime (Talbot et al., 1997b; Russo et al., 2003). Kinematic backward trajectories calculated along the INTEX-B flight tracks indicated that the plumes originated over the Asian continent usually 2–3 days prior to our sampling of them (not shown). The general correlation of Hg◦ with C2Cl4 in these plumes is indicative of urban/industrial
sources, and there was also an identical relationship with CHCl3 (not shown) but not
25
halon-1211 (CF2ClBr) which is a fairly recent specific tracer of Chinese urban emis-sions (Blake et al., 2003). The apparent correlation of Hg◦ with CH4 and other
hy-drocarbons such as C2H6, C2H2, and C3H8(not shown) likely reflects their co-located
ACPD
7, 15533–15563, 2007
Large-scale distribution of Hg◦
over the Pacific R. Talbot et al. Title Page Abstract Introduction Conclusions References Tables Figures ◭ ◮ ◭ ◮ Back Close
Full Screen / Esc
Printer-friendly Version
Interactive Discussion sources in Asia such as landfills, wastewater treatment, and bio/fossil fuel burning
(Bartlett et al., 2003). There was little or no correlation of Hg◦ with SO2, CO2, or
aerosol-SO2−4 as might be expected from the large and increasing emissions from coal combustion in China (Streets et al., 2005). This result probably reflects the influence of wet convective processing on Asian sulfur emissions and a complexity of sources for 5
CO2.
Overall, the correlations were weaker in the Honolulu dataset and essentially nonex-istent around Mexico City except in concentrated pollution plumes. At low latitudes this may have been the result of aged well processed equatorial air masses sampled above 4 km altitude. This consequently was reflected in, for example, the mixing ra-10
tios of CO2 being several ppmv less at low compared to mid-to-high latitudes (Fig. 8). These trends were present despite CO2 reaching its seasonal maximum mixing ratio
in March (Mexico City) and approaching the high northern latitude minimum in May (Anchorage).
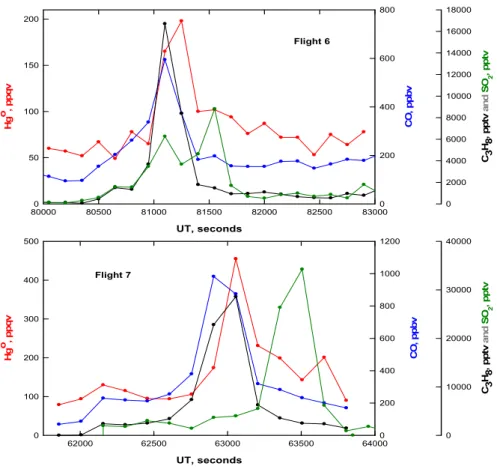
Pollution plumes originating from Mexico City were easily identifiable by their anoma-15
lously enriched mixing ratios of C3H8 (Blake and Rowland, 1995), on the order of tens
of ppbv. The largest mixing ratios of Hg◦ observed during INTEX-B were also found in these plumes. The plumes, sampled near 2.6 km (i.e., near the altitude of Mexico City), were thin well defined layers rich in combustion related trace gases represented by CO in Fig. 9. The highest mixing ratio of Hg◦in the Mexico City plumes approached 20
500 ppqv (Fig. 9, lower panel), coincident with C3H8levels near 30 ppbv. While some
of the C3H8was undoubtedly a combustion byproduct, its exceedingly high mixing
ra-tios and C2H6/C3H8 ratios <0.5 indicate that leakage is still occurring from liquefied petroleum storage on a massive scale as identified by Blake and Rowland (1995) more than a decade ago. Moreover, many of the layers contained mixing ratios of HCN and 25
CH3CN at several ppbv which is indicative of combustion contributions from biomass burning. There were not, however, coincidently enhanced mixing ratios of the biomass burning tracer CH3Cl, a result that complicates source identification. There was little
ACPD
7, 15533–15563, 2007
Large-scale distribution of Hg◦
over the Pacific R. Talbot et al. Title Page Abstract Introduction Conclusions References Tables Figures ◭ ◮ ◭ ◮ Back Close
Full Screen / Esc
Printer-friendly Version
Interactive Discussion
EGU
coal combustion, refineries, and active volcanoes in the area. In fact, Hg◦ and SO2 were almost anti-correlated in these layers (Fig. 9), and all the other ones encountered during the Mexico City flight series. Our analysis of the composition of these Mex-ico City plumes indicates that widespread multi-source urban/industrial emissions may have a more important influence on Hg◦ than specific point sources.
5
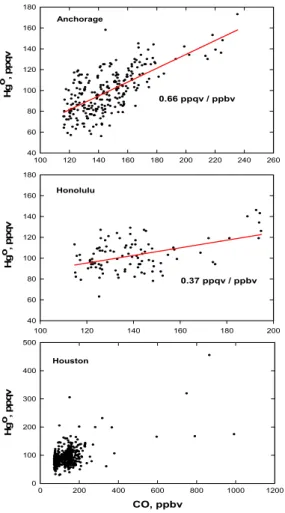
3.2 Plume Hg◦-CO relationships
It is apparent from the vertical distributions of Hg◦and CO (Fig. 4) that pollution plumes were sampled in all three study areas. These data were extracted from the dataset by calculating the median CO mixing ratio in 2 km altitude bins to generate subsets with several hundred data points in each. The data corresponding to CO values 10
greater than the median value are plotted in Fig. 10. We were able to fit the data from the flight series in Honolulu and Anchorage with a linear correlation that produced slopes of 0.37±0.07 ppqv/ppbv and 0.66±0.05 ppqv/ppbv respectively. The data ob-tained around the Mexico City area exhibited too much scatter to reliably determine a relationship between Hg◦ and CO with the few measurements obtained in the highly 15
concentrated plumes emanating from Mexico City. We also examined the Hg◦-CO2
relationship in all three study locations, but the scatter was too great to provide mean-ingful information.
For comparison to our Hg◦- CO correlations, Jaffe et al. (2005) reported a mean value of 0.63±0.18 ppqv/ppbv determined at Okinawa, Japan and a similar value for 20
Asian plumes sampled at Mount Bachelor, Oregon. The Asian plume data collected at Mount Bachelor between March 2004 and September 2005 was summarized by Weiss-Penzias et al. (2007), and yielded 0.52±0.15 ppqv/ppbv. Friedli et al. (2004) also examined the Hg◦- CO relationship in Asian emissions over the western Pacific during ACE-Asia-2001. They found no clear relationship and attributed it to the suite of mixed 25
combustion sources sampled in the same air masses. In the Shanghai plume, sampled separately, a value of 0.63 ppqv/ppbv was determined. These two studies close to Asia and our data for the central North Pacific all indicate that Asian, in particular continental
ACPD
7, 15533–15563, 2007
Large-scale distribution of Hg◦
over the Pacific R. Talbot et al. Title Page Abstract Introduction Conclusions References Tables Figures ◭ ◮ ◭ ◮ Back Close
Full Screen / Esc
Printer-friendly Version
Interactive Discussion outflow from China, has a characteristic Hg◦-CO ratio near 0.56 ppqv/ppbv. In the
U.S. with lower mercury emissions (Pacyna and Pacyna, 2002), we have determined a distinguishing value for the Northeast of ∼0.22 ppqv/ppbv (Mao et al., 2007). This value is similar to what was found on one flight over the Los Angeles Basin where the Hg◦-CO relationship varied from 0.17 to 0.27 ppqv/ppbv (Radke et al., 2007). Somewhat lower 5
Hg◦- CO emission ratios result from biomass burning in South America, South Africa, Canada, and the U.S., falling within the rather narrow range of 0.67–2.4±10−7mol/mol (∼0.16 ppqv/ppbv) (Ebinghaus et al., 2007).
3.3 Hg◦depletion in upper troposphere
A prominent feature of the INTEX-B dataset was the frequent total depletion of Hg◦ 10
(∼zero ppqv) in the upper troposphere/lower stratosphere (Talbot et al., 2007). Deple-tion (i.e., Hg◦<50 ppqv, the minimum observed in the lower troposphere) was observed
on four of the six flights flown from Anchorage, Alaska, and on one flight from Houston, Texas to Moffett Field, California during March 2006. The mixing ratios of O3 in these
air masses were commonly 200–400 ppbv, and peaked near 1 ppmv during flight 14. 15
A negative correlation between Hg◦ and O3 was also observed previously at 6–8 km
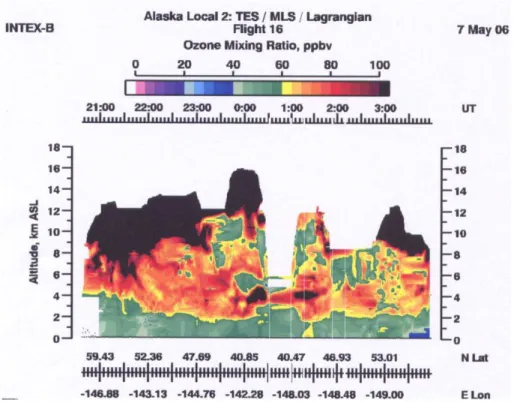
altitude during two ITCT2K2 flights along the U.S. west coast (Radke et al., 2007). The DIAL data, for example, show that on flight 16 the tropopause folding region north of 48◦N indicating that the DC-8 was well within this stratospherically influenced region during three Hg◦depletion events (Fig. 11). It also appears that the stratospheric 20
influence (i.e., elevated O3) penetrated downward to 2 km altitude. Overall, the DIAL
data demonstrate that a pervasive stratospheric impact on the tropospheric column was a common feature of all flights out of Honolulu and Anchorage.
Our previous measurements have shown that in tropospheric air impacted by strato-spheric inputs there is good correspondence between O3 and potential vorticity over
25
large regions (Browell et al., 2003a, b). Mixing of stratospheric and tropospheric air would effectively reduce the mixing ratio of Hg◦ in the free troposphere by addition of stratospheric air containing little or no Hg◦. Eventually this impact must filter down into
ACPD
7, 15533–15563, 2007
Large-scale distribution of Hg◦
over the Pacific R. Talbot et al. Title Page Abstract Introduction Conclusions References Tables Figures ◭ ◮ ◭ ◮ Back Close
Full Screen / Esc
Printer-friendly Version
Interactive Discussion
EGU
the MBL, but there was no evidence of a gradient in the Hg◦mixing ratio at low altitude (Fig. 7). Because tropopause folding events occur with highest frequency in late winter and spring (Seo and Bowman, 2001; Holton et al., 1995), they are likely a major factor driving large-scale seasonality in tropospheric Hg◦ mixing ratios. In fact, the INTEX-B data probably reflect the minimum annual level of Hg◦over the central and North Pacific 5
basins. Interestingly, the lowest average Hg◦mixing ratios below 6 km altitude were ob-served in the Mexico City area (Fig. 7), which potentially could be related to emission of mega-city anthropogenic halogen compounds. A better understanding of this phe-nomenon will require additional measurements and modeling to determine the relative influence of halogen chemistry with subsequent removal of RGM by precipitation scav-10
enging compared to an impact from Hg◦-depleted stratospheric air. We note that a stratospheric influence is not evident in the boundary layer over populated mid-latitude continental areas due to active emission/sink processes obscuring the effect. A case in point is in the northeastern U.S. where the UNH AIRMAP ground-based atmospheric mercury monitoring network shows a reproducible seasonality in Hg◦, driven largely by 15
local removal processes, with the highest mixing ratios occurring in late March/early April and the lowest levels in late September/early October (Mao et al., 2007).
4 Conclusions
Our findings increase the complexity required to simulate atmospheric mercury with a global chemical transport model and also seemingly explain the low mixing ratios of 20
Hg◦ that were present below 8 km altitude. An important unanswered question arises, “What is the fate of stratospheric HgP that is presumably transported throughout the tropospheric column?” Furthermore, tropospheric halogen chemistry is probably an important factor influencing mixing ratios of Hg◦, which needs to be separated from the stratospheric effect identified here that could potentially penetrate deep into the lower 25
troposphere. Clearly, global atmospheric mercury cycling is multifaceted and very de-tailed simultaneous measurements of Hg◦, RGM, and HgP are highly desirable to gain
ACPD
7, 15533–15563, 2007
Large-scale distribution of Hg◦
over the Pacific R. Talbot et al. Title Page Abstract Introduction Conclusions References Tables Figures ◭ ◮ ◭ ◮ Back Close
Full Screen / Esc
Printer-friendly Version
Interactive Discussion increased insight on processes revealed by our dataset and better inform regional and
global models.
Acknowledgements. We thank the flight crew of the NASA DC-8 aircraft for their help with this
field deployment and another successful airborne sciences mission. This work was supported by the NASA Tropospheric Chemistry Program under grant #NNG06GA56G and the NOAA
5
AIRMAP grant#NA06OAR4600189 to UNH.
References
Bartlett, K. B., Sachse, G. W., Slate, T., Harward, C., and Blake, D. R.: Large-scale distribution of CH4 in the western North Pacific: Sources and transport from the Asian continent, J. Geophys. Res., 108(D20), 8807, doi:10.1029/2002JD003076, 2003.
10
Blake, D. R. and Rowland, F. S.: Urban leakage of liquefied petroleum gas and its impact on Mexico City air quality, Science, 269, 953–956, 1995.
Blake, N. J., Blake, D. R., Simpson, I. J., Meinardi, S., Swanson, A. L., Lopez, J. P., Katzenstein, A. S., Barletta, B., Shirai, T., Atlas, E., Sachse, G., Avery, M., Vay, S., Fuelberg, H. E., Kiley, C. M., Kita, K., and Rowland, F. S.: NMHCs and halocarbons in Asian continental outflow
dur-15
ing the Transport and Chemical Evolution over the Pacific (TRACE-P) Field Campaign: Com-parison with PEM-West B, J. Geophys. Res., 108(D20), 8806, doi:10.1029/2002JD003367, 2003.
Browell, E. V., Fenn, M. A., Butler, C. F., Grant, W. B., Merrill, J., Newell, R. E., Bradshaw, J. D., Sandholm, S., Anderson, B., Bandy, A. R., Bachmeier, A. S., Blake, D. R., Davis, D.
20
D., Gregory, G. L. , Heikes, B., Kondo, Y., Liu, S., Rowland, F. S., Sachse, G. W., Singh, H., Talbot, R. W., and Thornton, D. C.: Large-scale air mass characteristics observed over Western Pacific during summertime, J. Geophys. Res., 101(D1), 1691–1712, 1996.
Browell, E. V., Fenn, M. A., Butler, C. F., Grant, W. B., Ismail, S., Ferrare, R. A., Kooi, S. A., Brackett, V. G., Clayton, M. B., Avery, M. A., Barrick, J. D. W., Fuelberg, H. E., Maloney, J. C.,
25
Newell, R. E., Zhu, Y., Mahoney, M. J., Anderson, B. E., Blake, D. R., Brune, W. H., Heikes, B. G., Sachse, G. W., Singh, H. B., and Talbot, R. W.: Large-scale air mass characteristics observed over the remote tropical Pacific Ocean during March-April 1999: Results from PEM-Tropics B field experiment, J. Geophys. Res., 106(D23), 32 481–32 501, 2001.
ACPD
7, 15533–15563, 2007
Large-scale distribution of Hg◦
over the Pacific R. Talbot et al. Title Page Abstract Introduction Conclusions References Tables Figures ◭ ◮ ◭ ◮ Back Close
Full Screen / Esc
Printer-friendly Version
Interactive Discussion
EGU
Browell, E. V., Fenn, M. A., Butler, C. F., Grant, W. B., Brackett, V. G., Hair, J. W., Avery, M. A., Newell, R. E., Hu, Y., Fuelberg, H. E., Jacob, D. J., Anderson, B. E., Atlas, E. L., Blake, D. R., Brune, W. H., Dibb, J. E., Fried, A., Heikes, B. G., Sachse, G. W., Sandholm, S. T., Singh, H. B., Talbot, R. W., Vay, S. A., and Weber, R. J.: Large-scale ozone and aerosol distributions, air mass characteristics, and ozone fluxes over the western Pacific Ocean in late winter/early
5
spring, J. Geophys. Res., 108(D20), 8805, doi:10.1029/2002JD003290, 2003a.
Browell, E. V., Hair, J. W., Butler, C. F., Grant, W. B., DeYoung, R. J., Fenn, M. A., Brackett, V. G., Clayton, M. B., Brasseur, L. A., Harper, D. B., Ridley, B. A., Klonecki, A. A., Hess, P. G., Emmons, L. K., Tie, X., Atlas, E. L., Cantrell, C. A., Wimmers, A. J., Blake, D. R., Coffey, M. T., Hannigan, J. W., Dibb, J. E., Talbot, R. W., Flocke, F., Weinheimer, A. J., Fried,
10
A., Wert, B., Snow, J. A., and Lefer, B. L.: Ozone, aerosol, potential vorticity, and trace gas trends observed at high-latitudes over North America from February to May 2000, J. Geophys. Res., 108(D4), 8369, doi:10.1029/2001JD001390, 2003b.
Brunke, E. G., Labyschagne, C., and Slemr, F.: Gaseous mercury emissions from a fire in the Cape Peninsula, South Africa, during January 2000, Geophys. Res. Lett., 28, 1483–1496,
15
2001.
Calvert, J. G. and Lindberg, S. E.: Mechanisms of mercury removal by O3 and OH in the atmosphere, Atmos. Environ., 39, 3355–3367, 2005.
Ebinghaus, R., Kock, H. H., Coggins, A. M., Spain, T. G., Jennings, S. G., and Temme C. H.: Long-term measurements of atmospheric mercury at Mace Head, Irish west coast, between
20
1995 and 2001, Atmos. Environ., 36, 5267–5276, 2002.
Ebinghaus, R., Slemr, F., Brenninkmeijer, C. A. M., van Velthoven, P., Zahn, A., Hermann, M., O’Sullivan, D. A., and Oram, D. E.: Emissions of gaseous mercury from biomass burning in South America in 2005 observed during CARIBIC flights, Geophys. Res. Lett., 34, L08813, doi:10.1029/2006GL028866, 2007.
25
Friedli, H. R., Radke, L. F., and Lu, J. Y.: Mercury in smoke from biomass fires, Geophys. Res. Lett., 28(17), 3223–3226, 2001.
Friedli, H. R., Radke, L. F., Lu, J. Y., Banic, C. M., Leaitch, W. R., and MacPherson, J. I.: Mercury emissions from burning of biomass from temperate North American forests: laboratory and airborne measurements, Atmos. Environ., 37, 253–267, 2003a.
30
Friedli, H. R., Radke, L. F., Prescott, R., Hobbs, P. V., and Sinha, P.: Mercury emissions from the August 2001 wildfires in Washington State and an agricultural waste fire in Ore-gon and atmospheric mercury budget estimates, Global Biogeochem. Cycles, 17(2), 1039,
ACPD
7, 15533–15563, 2007
Large-scale distribution of Hg◦
over the Pacific R. Talbot et al. Title Page Abstract Introduction Conclusions References Tables Figures ◭ ◮ ◭ ◮ Back Close
Full Screen / Esc
Printer-friendly Version
Interactive Discussion
doi:10.1029/2002GB001972, 2003b.
Friedli, H. R., Radke, L. F., Prescott, R., Li, P., Woo, J.-H., and Carmichael, G. R.: Mercury in the atmosphere around Japan, Korea, and China as observed during the 2001 ACE-Asia field campaign: Measurements, distributions, sources, and implications, J. Geophys. Res., 109, D19S25, doi:10.1029/2003JD004244, 2004.
5
Hoell, J. M., Davis, D. D., Liu, S. C., Newell, R., Shipham, M., Akimoto, H., McNeal, R. J., Ben-dura, R. J., and Drewry, J. W.: Pacific Exploratory Mission-West (PEM-West A): September-October 1991, J. Geophys. Res., 101(D1), 1641–1654, 1996.
Hoell, J. M., Davis, D. D., Liu, S. C., Newell, R. E., Akimoto, H., McNeal, R. J., and Bendura, R. J.: The Pacific Exploratory Mission-West Phase B: February-March, 1994, J. Geophys.
10
Res., 102(D23), 28 223–28 240, 1997.
Holton, J. R., Haynes, P. H., McIntyre, M. E., Douglass, A. R., Rood, R. B., and Pfister, L.: Stratosphere-troposphere exchange, Rev. Geophys., 33, 403–439, 1995.
Jacob, D. J., Crawford, J. H., Kleb, M. M., Connors, V. S., Bendura, R. J., Raper, J. L., Sachse, G. W., Gille, J. C., Emmons, L., and Heald, C. L.: Transport and Chemical Evolution over the
15
Pacific (TRACE-P) aircraft mission: Design, execution, and first results, J. Geophys. Res., 108(D20), 9000, doi:10.1029/2002JD003276, 2003.
Jaffe, D., Prestbo, E., Swartzendruber, P., Weiss-Penzias, P., Kato, S., Takami, A., Hatakeyama, S. and Kajii, Y.: Export of atmospheric mercury from Asia, Atmos. Environ., 39, 3029–3038, 2005.
20
Kim, K.-H., Ebinghaus, R., Schroeder, W. H., Blanchard, P., Kock, H. H., Steffen, A., Froude, F. A., Kim, M.-Y., Hong, S., and Kim, J.-H.: Atmospheric mercury concentrations from several observatory sites in the northern hemisphere, J. Atmos. Chem., 50, 1–24, 2005.
Knipping, E. M., Lakin, M. J., Foster, K. L., Jungwirth, P., Tobias, D. J., Gerber, R. B., Dab-dub, D., and Finlayson-Pitts, B. J.: Experiments and simulations of ion-enhanced interfacial
25
chemistry on aqueous NaCl aerosols, Science, 288, 301–306, 2000.
Lamborg, C. H., Fitzgerald, W. F., Damman, A. W. H., Benoit, J. M., Balcom, P. H., and Engstrom, D. R.: Modern and historic atmospheric mercury fluxes in both hemispheres: Global and regional mercury cycling implications, Global Biogeochem. Cycles, 16(4), 1104, doi:10.1029/2001GB001847, 2002.
30
Laurier, F. J. G., Mason, R. P., Whalin, L., and Kato, S.: Reactive gaseous mercury formation in the North Pacific Ocean’s marine boundary layer: A potential role of halogen chemistry, J. Geophys. Res., 108(D17), 4529, doi:10.1029/2003JD003625, 2003.
ACPD
7, 15533–15563, 2007
Large-scale distribution of Hg◦
over the Pacific R. Talbot et al. Title Page Abstract Introduction Conclusions References Tables Figures ◭ ◮ ◭ ◮ Back Close
Full Screen / Esc
Printer-friendly Version
Interactive Discussion
EGU
Mao, H. and Talbot, R.: Role of meteorological processes in two New England ozone episodes during summer 2001, J. Geophys. Res., 109, D20305, doi:10.1029/2004JD004850, 2004. Mao, H., Talbot, R., Sigler, J., Sive, B., and Hegarty, J.: Seasonal and diurnal variations of Hg◦
over New England, Atmos. Chem. Phys. Discuss., in press, 2007.
Mason, R. P. and Sheu, G.-R.: Role of the ocean in the global mercury cycle, Global Bio.
5
Cycles, 16(4), 1093, doi:10.1029/2001GB001440, 2002.
McNeal, R. J., Jacob, D. J., Davis, D. D., and Liu, S. C.: NASA Global Tropospheric Experi-ment, IGACtivities Newsletter, No. 13, NOAA Pacific Marine Environmental Laboratory, Seat-tle, Washington, available at: http://www.igac.noaa.gov/newsletter/highlights/1998/gte.php, 1998.
10
Oum, K. W., Lakin, M. J., DeHaan, D. O., Brauers, T., and Finlayson-Pitts, B. J.: Formation of molecular chlorine from the photolysis of ozone and aqueous sea-salt particles, Science, 279, 74–77, 1998.
Pacyna, E. G. and Pacyna, J. M.: Global emission of mercury from anthropogenic sources in 1995, Water, Air, and Soil Pollution, 137, 149–165, 2002.
15
Radke, L. F., Friedli, H. R., and Heikes, B. G.: Atmospheric mercury over the NE Pacific during ITCT2K2: Gradients, residence time, stratosphere-troposphere exchange, and long-range transport, J. Geophys. Res., 112, D19305, doi:10.1029/2005JD005828, 2007.
Russo, R. S., Talbot, R. W., Dibb, J. E., Scheuer, E., Seid, G., Jordan, C. E., Fuelberg, H. E., Sachse, G. W., Avery, M. A., Vay, S. A., Blake, D. R., Blake, N. J., Atlas, E., Fried, A.,
Sand-20
holm, S. T., Tan, D., Singh, H. B., Snow, J., and Heikes, B. G.: Chemical composition of Asian continental outflow over the western Pacific: Results from Transport and Chemical Evolution over the Pacific (TRACE-P), J. Geophys. Res., 108(D20), 8804, doi:10.1029/2002JD003184, 2003.
Schroeder, W. H. and Munthe, J.: Atmospheric mercury - an overview, Atmos. Environ., 5,
25
809–822, 1998.
Seigneur, C., Vijayaraghavan, K., Lohman, K., Karamchandani, P., and Scott, C.: Global source attribution for mercury deposition in the United States, Environ. Sci. Technol. 38, 555–569, 2004.
Seigneur, C., Vijayaraghavan, K., and Lohman, K.,: Atmospheric mercury chemistry:
Sensi-30
tivity of global model simulations to chemical reactions, J. Geophys. Res., 111, D22306, doi:10.1029/2005JD006780, 2006.
Selin, N. E., Jacob, D. J., Park, R. J., Yantosca, R. M., Strode, S., Jaegl ´e, L., and Jaffe, D.:
ACPD
7, 15533–15563, 2007
Large-scale distribution of Hg◦
over the Pacific R. Talbot et al. Title Page Abstract Introduction Conclusions References Tables Figures ◭ ◮ ◭ ◮ Back Close
Full Screen / Esc
Printer-friendly Version
Interactive Discussion
Chemical cycling and deposition of atmospheric mercury: Global constraints from observa-tions, J. Geophys. Res., 112, D02308, doi:10.1029/2006JD007450, 2007.
Seo, K.-H. and Bowman, K. P.: A climatology of isentropic cross-tropopause exchange, J. Geophys. Res., 106, 28 159–28 172, 2001.
Sigler, J. M. and Lee, X.: Gaseous mercury in background forest soil in the northeastern United
5
States, J. Geophys. Res., 111, G02007, doi:10.1029/2005JG000106, 2006.
Sigler, J. M., Lee, X., and Munger, W.: Emission and long-range transport of gaseous mercury from a large-scale Canadian boreal forest fire, Environ. Sci. Technol., 37, 4343–4347, 2003. Slemr, F., Brunke, E.-G., Ebinghaus, R., Temme, C., Munthe, J., W ¨angberg, I., Schroeder, W.,
Steffen, A., and Berg, T.: Worldwide trend of atmospheric mercury since 1977, Geophys.
10
Res. Lett., 30(10), 1516, doi:10.1029/2003GL016954, 2003.
Slemr, F. and Scheel, H. E.: Trends in atmospheric mercury concentrations at the summit of the Wank Mountain, Southern Germany, Atmos. Environ., 32(5), 845–853, 1998.
Streets, D. G., Hao, J., Wu, Y., Jiang, J., Chan, M., Tian, H., and Feng, X.: Anthropogenic mercury emissions in China, Atmos. Environ., 39, 7789–7806, 2005.
15
Streets, D. G., Tsai, N. Y., Akimoto, H., and Oka, K.: Trends in emissions of acidifying species in Asia, 1985–1997, Water, Air, Soil Pollut., 130, 187–192, doi:10.1023/A:1013883628877, 2001.
Strode, S. A., Jaegle, L. , Selin, N. E., Jacob, D. J., Park, R. J., Yantosca, R. M., Mason, R. P., and Slemr, F.: Air-sea exchange in the global mercury cycle, Global Biogeochem. Cycles,
20
21, GB1017, doi:10.1029/2006GB002766, 2007.
Talbot, R. W., Dibb, J. E., Lefer, B. L., Scheuer, E., Bradshaw, J. D., Sandholm, S. T., Smyth, S., Blake, D. R., Blake, N. J., Sachse, G. W., Collins, Jr., J. E., and Gregory, G. L.: Large scale distributions of tropospheric nitric, formic, and acetic acids over the western Pacific basin during wintertime, J. Geophys. Res., 102, 28 303–28 313, 1997a.
25
Talbot, R. W., et al.: Chemical characteristics of continental outflow from Asia to the troposphere over the western Pacific Ocean during February-March 1994: Results from PEM-West B, J. Geophys. Res., 102, 28 255–28 274, 1997b.
Talbot, R. W., Dibb, J. E., Scheuer, E. M., Kondo, Y., Koike, M., Singh, H. B., Salas, L. B., Fukui, Y., Ballentine, J. O., Meads, R. F., Miller, T. M., Hunton, D. E., Viggiano, A. A., Blake, D.
30
R., Blake, N. J., Atlas, E., Flocke, F., Jacob, D. J., and Jaegle, L.: Reactive nitrogen budget during the NASA SONEX mission, Geophys. Res. Lett., 26, 3057–3060, 1999.
ACPD
7, 15533–15563, 2007
Large-scale distribution of Hg◦
over the Pacific R. Talbot et al. Title Page Abstract Introduction Conclusions References Tables Figures ◭ ◮ ◭ ◮ Back Close
Full Screen / Esc
Printer-friendly Version
Interactive Discussion
EGU
troposphere-lower stratosphere, Geophys. Res. Lett., in press, 2007.
Weiss-Penzias, P., Jaffe, D. A., Swartzendruber, P., Dennison, J. B., Chand, D., Hafner, W., and Prestbo, E.: Observations of Asian air pollution in the free troposphere at Mount Bachelor Observatory during the spring of 2004, J. Geophys. Res., 111, D10304, doi:10.1029/2005JD006522, 2006.
5
Weiss-Penzias, P., Jaffe, D., Swartzendruber, P., Hafner, W., Chand, D., and Prestbo, E.: Quantifying Asian and biomass burning sources of mercury using the Hg/CO ratio in pollu-tion plumes observed at the Mount Bachelor observatory, Atmos. Environ., 41, 4366–4379, 2007.
ACPD
7, 15533–15563, 2007
Large-scale distribution of Hg◦
over the Pacific R. Talbot et al. Title Page Abstract Introduction Conclusions References Tables Figures ◭ ◮ ◭ ◮ Back Close
Full Screen / Esc
Printer-friendly Version
Interactive Discussion
Fig. 1 Schematic representation of custom cold vapor atomic fluorescence spectrometer
629
Fig. 1. Schematic representation of custom cold vapor atomic fluorescence spectrometer
con-figured for operation on the DC-8. Note that significant details have not been included in this conceptual layout.
ACPD
7, 15533–15563, 2007
Large-scale distribution of Hg◦
over the Pacific R. Talbot et al. Title Page Abstract Introduction Conclusions References Tables Figures ◭ ◮ ◭ ◮ Back Close
Full Screen / Esc
Printer-friendly Version
Interactive Discussion
EGU 634
Fig. 2 Response factor of the modified instrument during INTEX-B, including all ambient 635
Peak Area Counts pg-1 Hgo
7100 7150 7200 7250 7300 7350 7400 A lt it u d e , k m 0 2 4 6 8 10 12 14 Channel A Channel B 7170 ± 11 n = 1576 7325 ± 11 n = 1569
Fig. 2. Response factor of the modified instrument during INTEX-B, including all ambient
mea-surements and standard addition calibrations.
ACPD
7, 15533–15563, 2007
Large-scale distribution of Hg◦
over the Pacific R. Talbot et al. Title Page Abstract Introduction Conclusions References Tables Figures ◭ ◮ ◭ ◮ Back Close
Full Screen / Esc
Printer-friendly Version
Interactive Discussion
°
Fig. 3. Large-scale distribution of Hg◦
in the Mexico City area and over the North Pacific. Breaks in the mixing ratio plot are where zeros and standard additions were conducted.
ACPD
7, 15533–15563, 2007
Large-scale distribution of Hg◦
over the Pacific R. Talbot et al. Title Page Abstract Introduction Conclusions References Tables Figures ◭ ◮ ◭ ◮ Back Close
Full Screen / Esc
Printer-friendly Version
Interactive Discussion
EGU
673
Fig. 4 Vertical distribution of Hg°, O , and CO covering the latitude band of 14-62°N. Note
674 ° Hgo, ppqv 0 50 100 150 200 250 0 2 4 6 8 10 12 Honolulu O3, ppbv 0 50 100 150 200 250 0 2 4 6 8 10 12 CO, ppbv 0 50 100 150 200 250 0 2 4 6 8 10 12 Hgo, ppqv 0 50 100 150 200 250 0 2 4 6 8 10 12 14 Anchorage O3, ppbv 0 50 100 150 200 250 0 2 4 6 8 10 12 14 CO, ppbv 0 50 100 150 200 250 0 2 4 6 8 10 12 14 Hgo, ppqv 0 50 100 150 200 250 P re s u re A lt it u d e , k m 0 2 4 6 8 10 12 14 Houston O3, ppbv 0 50 100 150 200 250 P re s s u re A lt it u d e , k m 0 2 4 6 8 10 12 14 CO, ppbv 0 50 100 150 200 250 P re s s u re A lt it u d e , k m 0 2 4 6 8 10 12 14
Fig. 4. Vertical distribution of Hg◦
, O3, and CO covering the latitude band of 14–62◦
N. Note that the high O3and low Hg◦
present at 11.5 km occurred on the transit flight from Houston, TX to Moffett Field, CA (for details, see Talbot et al., 2007).
ACPD
7, 15533–15563, 2007
Large-scale distribution of Hg◦
over the Pacific R. Talbot et al. Title Page Abstract Introduction Conclusions References Tables Figures ◭ ◮ ◭ ◮ Back Close
Full Screen / Esc
Printer-friendly Version
Interactive Discussion
Fig. 5 Kinematic 5-day backward trajectory for the middle troposphere during flight 7. 686
ACPD
7, 15533–15563, 2007
Large-scale distribution of Hg◦
over the Pacific R. Talbot et al. Title Page Abstract Introduction Conclusions References Tables Figures ◭ ◮ ◭ ◮ Back Close
Full Screen / Esc
Printer-friendly Version
Interactive Discussion
EGU Fig. 6. Vertical distribution of O3 determined by the DIAL system during flight 7 in the Mexico
City area. Note the Mexico City urban plume embedded in O3 <40 ppbv background air from the surface to 12 km altitude.
ACPD
7, 15533–15563, 2007
Large-scale distribution of Hg◦
over the Pacific R. Talbot et al. Title Page Abstract Introduction Conclusions References Tables Figures ◭ ◮ ◭ ◮ Back Close
Full Screen / Esc
Printer-friendly Version Interactive Discussion 713 714 ° ± Hgo, ppqv 0 20 40 60 80 100 120 140 160 P re s s u re A lt it u d e , k m 0 2 4 6 8 10 12 Houston Honolulu Anchorage
Fig. 7. Vertical distribution of Hg◦ based on binning the data in 1 km altitude increments. The data are plotted as the mean ± standard deviation.
ACPD
7, 15533–15563, 2007
Large-scale distribution of Hg◦
over the Pacific R. Talbot et al. Title Page Abstract Introduction Conclusions References Tables Figures ◭ ◮ ◭ ◮ Back Close
Full Screen / Esc
Printer-friendly Version Interactive Discussion EGU 733 734 ° C2Cl4, pptv 0.0 0.2 0.4 0.6 0.8 1.0 1.2 H g o, p p q v 0 50 100 150 200 CO2, ppmv 380 382 384 386 388 390 392 394 H g o, p p q v 0 50 100 150 200 CH4, ppbv 1760 1780 1800 1820 1840 1860 1880 1900 H g o, p p q v 0 50 100 150 200 Houston CO, ppbv 0 50 100 150 200 250 300 H g o, p p q v 0 50 100 150 200 C2Cl4, pptv 0.0 0.2 0.4 0.6 0.8 1.0 1.2 H g o, p p q v 0 50 100 150 200 CO2, ppmv 380 382 384 386 388 390 392 394 H g o, p p q v 0 50 100 150 200 CH4, ppbv 1760 1780 1800 1820 1840 1860 1880 1900 H g o, p p q v 0 50 100 150 200 Honolulu CO, ppbv 0 50 100 150 200 250 300 H g o, p p q v 0 50 100 150 200 C2Cl4, pptv 0.0 0.2 0.4 0.6 0.8 1.0 1.2 H g o, p p q v 0 50 100 150 200 CO2, ppmv 380 382 384 386 388 390 392 394 H g o, p p q v 0 50 100 150 200 CH4, ppbv 1760 1780 1800 1820 1840 1860 18801900 H g o, p p q v 0 50 100 150 200 Anchorage CO, ppbv 0 50 100 150 200 250 300 H g o, p p q v 0 50 100 150 200
Fig. 8. Regional correlations between Hg◦and CO2, CO, CH4, and C2Cl4.
ACPD
7, 15533–15563, 2007
Large-scale distribution of Hg◦
over the Pacific R. Talbot et al. Title Page Abstract Introduction Conclusions References Tables Figures ◭ ◮ ◭ ◮ Back Close
Full Screen / Esc
Printer-friendly Version Interactive Discussion 750 751 UT, seconds 80000 80500 81000 81500 82000 82500 83000 H g o , p p q v 0 50 100 150 200 C O , p p b v 0 200 400 600 800 C3 H8 , p p tv a n d SO 2 , p p tv 0 2000 4000 6000 8000 10000 12000 14000 16000 18000 Flight 6 UT, seconds 62000 62500 63000 63500 64000 H g o , p p q v 0 100 200 300 400 500 C O , p p b v 0 200 400 600 800 1000 1200 C3 H8 , p p tv a n d SO 2 , p p tv 0 10000 20000 30000 40000 Flight 7
ACPD
7, 15533–15563, 2007
Large-scale distribution of Hg◦
over the Pacific R. Talbot et al. Title Page Abstract Introduction Conclusions References Tables Figures ◭ ◮ ◭ ◮ Back Close
Full Screen / Esc
Printer-friendly Version Interactive Discussion EGU ° 100 120 140 160 180 200 220 240 260 H g o, p p q v 40 60 80 100 120 140 160 180 CO, ppbv 0 200 400 600 800 1000 1200 H g o, p p q v 0 100 200 300 400 500 100 120 140 160 180 200 H g o, p p q v 40 60 80 100 120 140 160 180 0.66 ppqv / ppbv 0.37 ppqv / ppbv Anchorage Honolulu Houston
Fig. 10. Relationship between Hg◦ and CO in plumes with CO> median value in 2 km altitude bins.
ACPD
7, 15533–15563, 2007
Large-scale distribution of Hg◦
over the Pacific R. Talbot et al. Title Page Abstract Introduction Conclusions References Tables Figures ◭ ◮ ◭ ◮ Back Close
Full Screen / Esc
Printer-friendly Version
Interactive Discussion
° °
Fig. 11. Vertical distribution of O3measured by the DIAL system along the flight track of mission 16. The three regions of Hg◦depletion occurred north of 48◦N at 10 km altitude. These regions were well into the lower stratosphere as indicated by the O3mixing ratios exceeding 100 ppbv