HAL Id: hal-00298678
https://hal.archives-ouvertes.fr/hal-00298678
Submitted on 22 Jul 2005HAL is a multi-disciplinary open access
archive for the deposit and dissemination of sci-entific research documents, whether they are pub-lished or not. The documents may come from teaching and research institutions in France or abroad, or from public or private research centers.
L’archive ouverte pluridisciplinaire HAL, est destinée au dépôt et à la diffusion de documents scientifiques de niveau recherche, publiés ou non, émanant des établissements d’enseignement et de recherche français ou étrangers, des laboratoires publics ou privés.
A daily salt balance model for representing stream
salinity generation process following land use change
M. A. Bari, K. R. J. Smettem
To cite this version:
M. A. Bari, K. R. J. Smettem. A daily salt balance model for representing stream salinity generation process following land use change. Hydrology and Earth System Sciences Discussions, European Geosciences Union, 2005, 2 (4), pp.1147-1183. �hal-00298678�
HESSD
2, 1147–1183, 2005
A daily salt balance model for streamflow
generation M. A. Bari and K. R. J. Smettem Title Page Abstract Introduction Conclusions References Tables Figures J I J I Back Close
Full Screen / Esc
Print Version Interactive Discussion
EGU
Hydrol. Earth Sys. Sci. Discuss., 2, 1147–1183, 2005 www.copernicus.org/EGU/hess/hessd/2/1147/
SRef-ID: 1812-2116/hessd/2005-2-1147 European Geosciences Union
Hydrology and Earth System Sciences Discussions
Papers published in Hydrology and Earth System Sciences Discussions are under open-access review for the journal Hydrology and Earth System Sciences
A daily salt balance model for
representing stream salinity generation
process following land use change
M. A. Bari1,2and K. R. J. Smettem3,4
1
Department of Environment, 3 Plain Street, East Perth, W.A. 6004, Australia
2
School of Earth and Geographical Sciences, Hydroscience Discipline Group, The University of Western Australia, 35 Stirling Highway, Crawley, W.A. 6009, Australia
3
Centre for Water Research, The University of Western Australia 35 Stirling Highway, Crawley, W.A. 6009, Australia
4
Cooperative Research Centre for Plant-Based Management of Dryland Salinity, The University of Western Australia, 35 Stirling Highway, Crawley, W.A. 6009, Australia Received: 13 June 2005 – Accepted: 30 June 2005 – Published: 22 July 2005 Correspondence to: M. A. Bari (mohammed.bari@environment.wa.gov.au) © 2005 Author(s). This work is licensed under a Creative Commons License.
HESSD
2, 1147–1183, 2005
A daily salt balance model for streamflow
generation M. A. Bari and K. R. J. Smettem Title Page Abstract Introduction Conclusions References Tables Figures J I J I Back Close
Full Screen / Esc
Print Version Interactive Discussion
EGU
Abstract
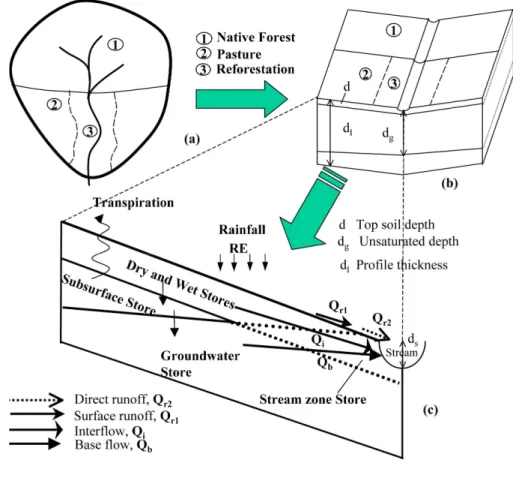
We developed a coupled salt and water balance model to represent the stream salin-ity generation process following land use changes. The conceptual model consists of three main components with five stores: (i) Dry, Wet and Subsurface Stores, (ii) sat-urated Groundwater Store and (iii) a transient Stream zone Store. The Dry and Wet
5
Stores represent the salt and water movement in the unsaturated zone and also the near-stream dynamic saturated areas, responsible for the generation of salt flux asso-ciated with surface runoff and interflow. The unsaturated Subsurface Store represents the salt bulge and the salt fluxes. The Groundwater Store comes into play when the groundwater level is at or above the stream invert and quantifies the salt fluxes to the
10
Stream zone Store. In the stream zone module, we consider a “free mixing” between the salt brought about by surface runoff, interflow and groundwater flow. Salt accu-mulation on the surface due to evaporation and its flushing by initial winter flow is also incorporated in the Stream zone Store. The salt balance model was calibrated sequen-tially following successful application of the water balance model. Initial salt stores were
15
estimated from measured salt profile data. We incorporated two lumped parameters to represent the complex chemical processes like diffusion-dilution-dispersion and salt fluxes due to preferential flow. The model has performed very well in simulating stream salinity generation processes observed at Ernies and Lemon experimental catchments in south west of Western Australia. The simulated and observed stream salinity and
20
salt loads compare very well throughout the study period. The model slightly over pre-dicted annual stream salt load by 6.2% and 6.8%, with R2of 0.95 and 0.96 for Ernies and Lemon catchment, respectively.
1. Introduction
Stream and land salinisation is a major environmental problem occurring in many parts
25
HESSD
2, 1147–1183, 2005
A daily salt balance model for streamflow
generation M. A. Bari and K. R. J. Smettem Title Page Abstract Introduction Conclusions References Tables Figures J I J I Back Close
Full Screen / Esc
Print Version Interactive Discussion
EGU
affects parts of Asia, North America and Australia (Mckell et al., 1986). The salinity problem is reasonably well documented in Australia compared to other parts of the world (Hatton et al., 2002; Peck and Hatton, 2003; Hatton et al., 2003; Halse et al., 2003). In Western Australia most of the salinity problem is associated with dry land, rain fed agriculture (known as dryland salinity) rather than irrigated agriculture.
5
The extent of dryland salinity in Western Australia was estimated in 1994 as 9.4% of the area cleared for agriculture (Ferdowsian et al., 1996). This represents a loss of more than 1.8 million hectares of agricultural land (State Salinity Council, 2000) with up to 8.8 million hectares at risk by 2050 (Anon, 1996). Only 44% of the State’s water resources are fresh and the remaining 56% are brackish or saline (Mayer et
10
al., 2004). Projections show that without any effective land use management, more than 3 million hectares of land will be affected by 2015, and 6 million hectares or 30% of the agricultural area will be saline when a new hydrological equilibrium is reached (Ferdowsian et al., 1996; State Salinity Council, 2000).
The factors causing the land and stream salinity in Western Australia are different
15
from other parts of the world. For example, in Queensland (Australia) salinity is caused by summer dominant rainfall, local aquifer system recharge and discharge areas are separated in space (Thornburn, 1991). Thornburn (1991) found similarity between the causes of salinity in Queensland and the Great Plains of northern United States of America (Miller et al., 1981). Stolte et al. (1997) noted that the factors affecting salinity
20
in Western Australia were “very different from those in the prairies of North America”. Stream and land salinity in Western Australia has developed following the clearing of deep rooted, native vegetation and its replacement by shallow-rooted, annual agri-cultural crops and pastures (Schofield and Ruprecht, 1989; Ruprecht and Schofield, 1991). This land use change has led to an increase in groundwater recharge and
ris-25
ing water tables. This process has mobilised the salt stored in the unsaturated zone of the soil profile and eventually discharged to streams (Wood, 1924). The magnitude of stream salinity increase is dependent on annual rainfall and the extent and location of clearing (Schofield and Ruprecht, 1989; Mayer et al., 2004).
HESSD
2, 1147–1183, 2005
A daily salt balance model for streamflow
generation M. A. Bari and K. R. J. Smettem Title Page Abstract Introduction Conclusions References Tables Figures J I J I Back Close
Full Screen / Esc
Print Version Interactive Discussion
EGU
In the 1970s, a series of experimental catchments were established in the south-west of Western Australia to further understand the stream and land salinisation pro-cess following land use changes (Peck and Williamson, 1987). Catchment models were also developed to represent the hydrological processes and were successfully applied from experimental to large water resources scale. The Darling Range
Catch-5
ment Model (DRCM) and the Large Scale Catchment Model (LASCAM) are the two recent examples (Mauger, 1986; Sivapalan et al., 1996; Viney et al., 2000; Viney and Sivapalan, 2001). An integrated modelling framework for the assessment of salt and water balance of a large dryland salinity affected catchment in the south-eastern part of Australia has been reported (Tuteja et al., 2003). Application of these models show
10
that there are scope for improvement in the mathematical representation of the phys-ical processes, particularly for the dynamic variations of the stream zone saturated areas and the mixing and distribution of salts brought about by rising groundwater to the stream zone. The limitations of the previous models were also highlighted by recent application of a fully distributed catchment model, WEC-C (Water and Environmental
15
Consultants-Catchment) at experimental catchments. Observations show that stream salt load from these catchments has increased more than 100 times following clearing of native forest (Bari and Croton, 2000; Croton and Bari, 2001; Bari and Croton, 2002). We developed a catchment water balance model following the “downward approach” originally suggested by Klemes (1983). The water balance model was successfully
ap-20
plied and tested in two experimental catchments in Western Australia (Bari and Smet-tem, 2005). The principal objective of this paper is to couple a salinity component with the water balance model. The coupled salt and water balance model will be used as an elementary unit in developing a regional-scale (>1000 km2) catchment model.
2. The study catchments
25
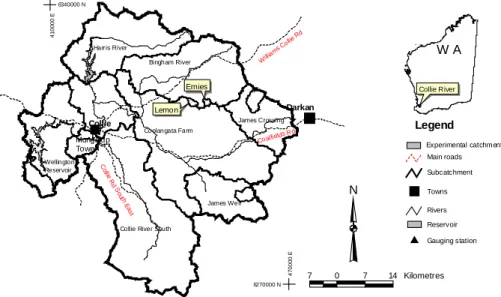
The paired catchments, Ernies and Lemon, are located in the south west of West-ern Australia, some 250 km south of Perth (Fig. 1). Approximately 53% of the native
HESSD
2, 1147–1183, 2005
A daily salt balance model for streamflow
generation M. A. Bari and K. R. J. Smettem Title Page Abstract Introduction Conclusions References Tables Figures J I J I Back Close
Full Screen / Esc
Print Version Interactive Discussion
EGU
vegetation of the Lemon catchment was cleared in 1977 to develop a comprehensive understanding of the streamflow and salinity generation processes following land use change. Ernies catchment was established as forested control. The annual pan evap-oration and annual rainfall are approximately 650 mm and 1600 mm, respectively. The native forest was dominated by jarrah (Eucalyptus marginata). The cleared area of
5
Lemon catchment was used for sheep grazing.
3. Salinity generation process
3.1. Salt fall and distribution
Salt fall on Ernies and Lemon catchments was measured at 7.8 mg L−1 TDS. The salinity recorded in a fully exposed gauge was generally lower than that of an under
10
canopy gauge (Williamson et al., 1987). The principal source of salt in the soil profile is the atmospheric input originating from the ocean (Hingston and Gailitis, 1976) and increases with distance from the coast due to less flushing with lower rainfall (Stokes et al., 1980). In the High Rainfall Zone (>1100 mm yr−1), regional groundwater tables intersect the stream invert and little salt is retained in the unsaturated profile. In the
15
Low Rainfall Zone (<900 mm yr−1), the groundwater table lies far below the stream channel. A substantial part of streamflow is generated by shallow interflow and most of the salt accumulates in the unsaturated zone.
Soil salt profile data was limited to five locations for both catchments. The salt con-tent of the shallow highly conductive top soil is significantly less than that of the less
20
conductive, very deep unsaturated profile, which extends to the groundwater system. Salt content of the groundwater system is generally less than that of the unsaturated zone. The soil salt storage also varies both spatially and vertically within both of the catchments. Johnston et al. (1987) classified the vertical soil salt distribution into two forms: (i) bulge profile and (ii) monotonically increasing profile.
HESSD
2, 1147–1183, 2005
A daily salt balance model for streamflow
generation M. A. Bari and K. R. J. Smettem Title Page Abstract Introduction Conclusions References Tables Figures J I J I Back Close
Full Screen / Esc
Print Version Interactive Discussion
EGU
3.2. Recharge and salt mobilisation
Groundwater level data from the Ernies control catchment show little variation between years and lies approximately 20 m below stream bed. There was a systematic increase in groundwater level observed at Lemon catchment due to clearing and increase in net recharge (Bari and Smettem, 2004). The vertical recharge component mobilises salt
5
stored from the unsaturated zone and the rising groundwater dissolves it. Therefore, the groundwater salinity increases (Croton and Bari, 2001). The rate of groundwater salinity increase depends on recharge rate and salt stored in the soil profile.
3.3. Stream salinity generation
Salt discharge is a function of streamflow components and their respective salinity. The
10
flow components can vary locally and regionally due to partial or total clearing of the vegetation cover along the stream. In the Low Rainfall Zone, when groundwater dis-charges salts to the stream following clearing, the increase in stream salinity reaches a maximum. The rate of increase in salinity with area cleared is greater in the Low Rainfall Zone but takes a longer time to manifest itself.
15
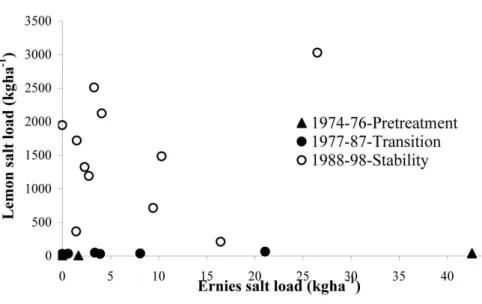
During the pre-treatment period (1974–1976) stream salinity and load of both catch-ments were similar. After treatment there was about 20% increase in both compo-nents from Lemon until 1987, when the groundwater system reached the stream in-vert. The streamflow was composed only of surface runoff and interflow (Bari and Smettem, 2005), and there is very little salt storage in the highly conductive top soil.
20
Stream salinity was in the order of 100–150 mg L−1 TDS. Once a small groundwater discharge area appeared, the annual stream salinity increased from 115 mg L−1 TDS to 2000 mg L−1TDS, when the catchment reached a new equilibrium. There were also dramatic changes in flow generation processes (Bari and Smettem, 2005), and salt discharge increased about 80 fold (Fig. 2). The significant increase in stream salt load
25
is due to the discharge of highly saline (∼5000 mg L−1TDS) groundwater to the stream (Bari and Smettem, 2004). Analyses of daily stream salinity during 1987–1998 show
HESSD
2, 1147–1183, 2005
A daily salt balance model for streamflow
generation M. A. Bari and K. R. J. Smettem Title Page Abstract Introduction Conclusions References Tables Figures J I J I Back Close
Full Screen / Esc
Print Version Interactive Discussion
EGU
a significant increase in salinity during the early winter flow, due to evaporation and flushing of salts accumulated in the stream zone.
4. Model description
We introduced a salinity component into the daily water balance model (Bari and Smet-tem, 2005). The structure of the coupled salt balance model remained unchanged
5
(Fig. 3). The water balance model includes evapotranspiration, surface runoff and in-terflow, percolation and recharge to the deep groundwater. The model also includes the dynamic variation of the stream-zone saturated areas and discharge (if any) from the deep groundwater system. The water balance model has five stores: (i) Dry, Wet and Subsurface Stores, (ii) Groundwater Store and (iii) transient Stream zone Store
10
(Fig. 4).
4.1. Salt interception
Rainfall salt intercepted by the plant canopies is washed off to the ground by the next rainfall event. Salt fall and salt storage (Sr) on the canopy can be calculated as:
Sr(t+ 1) = Cr(t, t+ 1)R(t, t + 1) + Sr(t) (1)
15
Following evaporation of intercepted water, the concentration of effective rainfall in-creases and is calculated as:
Cre= Sr
RE if RE > 0 (2a)
Cre= 0 if RE = 0 (2b)
Sre= CreRE (2c)
HESSD
2, 1147–1183, 2005
A daily salt balance model for streamflow
generation M. A. Bari and K. R. J. Smettem Title Page Abstract Introduction Conclusions References Tables Figures J I J I Back Close
Full Screen / Esc
Print Version Interactive Discussion
EGU
4.2. Unsaturated salt stores 4.2.1. Salt in the Dry Store
The Dry Store is conceived to receive rainfall salt and represents most of the salt contained in the highly conductive, shallow, top soil. We assume complete mixing of salt and water within the store and represent the unsaturated or “immobile” state of
5
solute. When the moisture content of part of the catchment exceeds field capacity (θf), this store releases water and salt to the Wet Store (Bari and Smettem, 2005). Salt concentration of the Dry Store is:
Cd = Sd
Wd (3)
After effective rainfall, part is released from the Dry Store to the Wet Store. The
con-10
centration of the released salt (Crf) depends upon chemical processes like dilution-diffusion-advection-dispersion-convection. We introduce a lumped parameter to repre-sent these processes. Therefore, the concentration (Crf) and the salt released from Dry Store to Wet Store (Srf) can be expressed as:
Crf = CuCd (4a)
15
Srf = CrfRf (4b)
When the groundwater level rises and intersects the stream bed the Stream zone Store comes into play. The Dry Store loses salt to the Stream zone Store when the saturated area expands and gains salt when that contracts. This can be calculated as:
∆Ssg= Cd∆Wsg if ∆dg < 0 (5a)
20
∆Ssg= Csg∆Wsg if ∆dg > 0 (5b) The Dry Store Salt update at any time (t+1):
HESSD
2, 1147–1183, 2005
A daily salt balance model for streamflow
generation M. A. Bari and K. R. J. Smettem Title Page Abstract Introduction Conclusions References Tables Figures J I J I Back Close
Full Screen / Esc
Print Version Interactive Discussion
EGU
4.2.2. Salt in the Wet Store
The Wet Store represents salt in the water that is free to move vertically and laterally. The Wet Store represents the dynamically variable saturated areas, predominantly ob-served in the near-surface stream zone. Salt concentration (Cw) of the Wet Store is dependent on the amount of salt (Sw) and water (Ww) present at a particular time:
5
Cw = Sw
Ww (7)
The surface runoff is generated as saturation excess (Qr1) and from the “impervious” groundwater induced saturated area (Qr2). Surface runoff (Qr2) brings rainfall salt to the Stream zone Store and contributes salt to the stream (Eq. 20). If we assume free mixing, the concentrations of the surface runoff (Qr1) and interflow (Qi) are identical to
10
the Wet Store concentration (Cw). Therefore, salt transported to the stream by surface runoff (Qr1) and interflow are:
Sqr1= CwQr1 (8)
Sqi = CwQi (9)
The percolation (I) from the Wet Store to the Subsurface Store includes preferential
15
flow. The salt concentration of the percolated water is less than that of the Wet Store and is represented by introducing a parameter (C). Therefore, the total salt transported from the top soil to the subsurface unsaturated profile (Si) and its concentration (Ci) are:
Ci = CCw (10a)
20
Si = CiI (10b)
Under a native forest scenario salt content of the Wet Store should remain stable for a long period of simulation. The salt balance of the Wet Store can be expressed as:
HESSD
2, 1147–1183, 2005
A daily salt balance model for streamflow
generation M. A. Bari and K. R. J. Smettem Title Page Abstract Introduction Conclusions References Tables Figures J I J I Back Close
Full Screen / Esc
Print Version Interactive Discussion
EGU
4.2.3. Salt in the Subsurface Store
The Subsurface Store represents the salt bulge naturally present in the unsaturated soil profile. The salt concentration of this store (Cl) can be expressed as:
Cl = Sl
Wl (12)
The Subsurface Store loses salt to the groundwater system by recharge (Rl ), as
pref-5
erential and matrix flow. We assume that the concentration of the recharge salt can be expressed as a function of salt concentration of the Subsurface Store and the param-eter used for the Dry Store. Therefore the salinity (Crl) and salt load of recharge (Srl) can be expressed as:
Crl = CuCl (13a)
10
Srl = CrlRl (13b)
The Subsurface Store exchanges salt to the Groundwater Store due to the fluctuation of the groundwater level and can be quantified as:
∆Sgl = ∆WglCl if ∆dg ≤ 0 (14a)
∆Sgl = ∆WglCg if ∆dg ≥ 0 (14b)
15
The salt balance of the Sub-surface Store at time (t+1) is given as:
Sl(t+ 1) = Sl(t)+ Si(t, t+ 1) − Srl(t, t+ 1) − ∆Sgl(t, t+ 1) (15) 4.3. Salt in the Groundwater Store
The salt present in the Groundwater Store (Sg) is initially estimated from observed salinity or salt storage data and the concentration can be expressed as:
20
Cg = Sg
HESSD
2, 1147–1183, 2005
A daily salt balance model for streamflow
generation M. A. Bari and K. R. J. Smettem Title Page Abstract Introduction Conclusions References Tables Figures J I J I Back Close
Full Screen / Esc
Print Version Interactive Discussion
EGU
The Groundwater Store contributes salt (Sqbl) to the stream when the groundwater system intersects the stream bed. This store can also lose salt (Sql o) to the down stream groundwater system, which is not recorded by the gauging station. Therefore, loss of salt from the Groundwater Store below the gauge and salt contribution to the stream zone can be expressed as:
5
Sqbl = CgQbl (17)
Sql o = CgQl oss (18)
When the groundwater level fluctuates, the Groundwater Store exchanges salt to the Subsurface Store (Eq. 14). The Groundwater Store salt balance can expressed as:
Sg(t+ 1) = Sg(t)+ Srl(t, t+ 1) − Sql o(t, t+ 1) − Sqbl(t, t+ 1) + ∆Sgl(t, t+ 1) (19)
10
4.4. Salt in the Stream zone Store
The Stream zone salt Store is transient and is created by the deep groundwater sys-tem only. When the groundwater level is at or above the stream bed salt storage is controlled by the surface runoff, interflow and baseflow. Soil evaporation also takes place from this store, which eventually increases the salt concentration and in the dry
15
months leaves salt on the surface (surface salt crusting). When the Stream zone Store contracts/expands it exchanges salt with the Dry Store. Salt is brought to this store by rain, interflow (from the Wet Store) and baseflow (from the Groundwater Store) compo-nents. We calculate the salt balance of this store sequentially, firstly for surface runoff and then interflow and baseflow, respectively. Surface runoff (Qr) consists of runoff
20
generated from the transient stream zone saturated areas (Qr1) and from groundwa-ter induced saturated areas (Qr2). Both of these components mix with the salt in the stream zone to some extent and bring it to stream. For simplicity we assume that Qr1 does not mix with the salt in the stream zone while Qr2 is well mixed. Salt contribution
HESSD
2, 1147–1183, 2005
A daily salt balance model for streamflow
generation M. A. Bari and K. R. J. Smettem Title Page Abstract Introduction Conclusions References Tables Figures J I J I Back Close
Full Screen / Esc
Print Version Interactive Discussion
EGU
(Sqr2) by Qr2, its concentration (Cqr2) and salt balance of the store can be calculated as: Cqr2 =Ssg+ CreQr2 Wsg+ Qr2 (20a) Sqr2= Cqr2Qr2 (20b) Ssg(t+ 1) = Ssg(t)+ Cre(t, t+ 1)Qr2(t, t+ 1) − Sqr2(t, t+ 1) (20c) 5
Similar to the surface runoff Qr2, salt storage and concentration are sequentially up-dated due to interflow and baseflow. There is also exchange of salt between the Stream zone Store and the Dry Store, due to contraction/expansion of the stream zone satu-rated area (Eq. 5). Therefore, the salt balance of the Stream zone Store after each time step can be expressed as:
10
Ssg(t+ 1) = Ssg(t)+ ∆Ssg(t, t+ 1) (21)
4.5. Stream salt load
Stream salt load is the sum of surface runoff interflow and baseflow salt components. The total salt flow to stream (Sqt) and salinity (Cqt) can be expressed as:
Sqt = Sqr1+ Sqr2+ Sqi+ Sqb (22a)
15
Cqt = Sqt
Qt (22b)
5. Model calibration and data requirements
The coupled water and salt balance model is calibrated sequentially. At first the param-eters related to water balance are calibrated (Bari and Smettem, 2005), and then the
HESSD
2, 1147–1183, 2005
A daily salt balance model for streamflow
generation M. A. Bari and K. R. J. Smettem Title Page Abstract Introduction Conclusions References Tables Figures J I J I Back Close
Full Screen / Esc
Print Version Interactive Discussion
EGU
other parameters associated with the salt balance. The first five-year’s stream salinity data of Ernies catchment and data up to 1987 of Lemon catchment was used for the coupled model calibration. The rest of the observed data was used for model verifica-tion. The initial conditions of the five connecting Stores are estimated from observed soil salt profile data. Salt concentration of the Groundwater Store was taken as the
5
average salinity of the groundwater observation bores. We took the arithmetic average of the observed salt fall data and it remained constant over time for both catchments. The salt balance model has two parameters. The first one (Cu) is related to salt re-lease from Dry Store to the Wet Store (Fig. 4), and represents the transport and mixing processes. This parameter indirectly controls the concentration of the Wet Store. The
10
indicative salinity of the Wet Store can be estimated from the salinity data observed from the shallow bores. The other parameter (C) controls salt concentration of the per-colation water and represents the vertical advection, probably due to the presence of preferred pathways in the unsaturated soil profile (Johnston et al., 1987). These two parameters were calibrated through trial and error. Under a native forest scenario the
15
calibrated values of these two parameters should be such that the salt storage of the Dry and Wet Stores remains stable under long term simulations, and that the predicted salinity should reasonably match with the observed data.
Soil salt profiles were taken from five boreholes, located in the stream zone, mid slope and up slope at each of the catchments. Salt storage ranged from less than
20
1 kg m−3to 7 kg m−3. Salt content of the Subsurface Store was estimated at 2.5 kg m−3 for both catchments. There was a large variation in the salinity of the permanent groundwater system, ranging from 1000 mg L−1 TDS to less than 6000 mg L−1 TDS. This large variation may partially be due to the presence of localised preferred path-way recharge (Johnston, 1987) and different hydraulic properties of the aquifer. We
25
HESSD
2, 1147–1183, 2005
A daily salt balance model for streamflow
generation M. A. Bari and K. R. J. Smettem Title Page Abstract Introduction Conclusions References Tables Figures J I J I Back Close
Full Screen / Esc
Print Version Interactive Discussion
EGU
6. Model application and testing
6.1. Salinity variations in different stores
In the south west of Western Australia, salinity observed in shallow bores (less than 2.5 m deep) is generally fresh (<500 mg L−1TDS) while the groundwater level remains below the stream bed. Similar results were also obtained from Lemon and Ernies
5
catchments. At Ernies catchment, shallow bores located in the dynamically contributing saturated area exhibit salinity variations ranging from 150 mg L−1 TDS to 400 mg L−1 TDS. The salt content of both the Dry and Wet Stores of Ernies catchment remained stable during the study period (Fig. 5a). The predicted salinity of the stream zone saturated area was very similar to the observed record and remained stable (Fig. 5b).
10
The salt storage of the Dry Store of Lemon started to decrease when it was cleared in 1977. When the groundwater system reached the surface the salt content of the Dry Store started increasing again. The increase in salt content was due to the existence of the Stream zone Store with very high salinity, similar to the Groundwater Store. When the permanent groundwater level was below the stream invert, the shallow
intermit-15
tent saturated area was present only in the wet period of the year when streamflow was generated (Bari and Smettem, 2004; Bari and Smettem, 2005; Bari et al., 2005). Salinity of the stream zone saturated areas was generally fresh, less than 300 mg L−1 TDS. There was dramatic increase in salinity when the groundwater reached the sur-face in 1987. The model represented this process very well. For example, one shallow
20
bore, located in the lower part of the stream zone of Lemon catchment, recorded salin-ity in the order of 250 mg L−1 TDS. Since 1987 the salinity recorded in the same bore was in excess of 4000 mg L−1 TDS, mainly due to the contribution of the groundwater system. The model also successfully predicted similar salinity of the saturated areas of Lemon catchment (Fig. 6).
HESSD
2, 1147–1183, 2005
A daily salt balance model for streamflow
generation M. A. Bari and K. R. J. Smettem Title Page Abstract Introduction Conclusions References Tables Figures J I J I Back Close
Full Screen / Esc
Print Version Interactive Discussion
EGU
6.2. Stream salinity and salt load
The salt model was applied on a daily time step for the whole 27-year simulation period. In most of the years before and after clearing, modelled streamflow, salinity and salt load matched reasonably well for both Ernies and Lemon catchments.
6.2.1. Daily salinity
5
The Ernies catchment exhibited average flow in 1990. The observed and simulated hydrographs were very similar. As the permanent groundwater system was far below the stream, there was no contribution of groundwater salt to the stream. The modelled salinity was slightly lower than observed (Fig. 7a). The observed and predicted stream salt loads were well matched, except during the recession periods, when the predicted
10
load was slightly lower than recorded (Fig. 7b). In 1996, Ernies catchment received a particularly large annual rainfall of 880 mm. It can be seen (Fig. 8a) that streamflow started some time in July, increased during the high-rainfall winter months, and dried out by November. The model successfully represented the flow and salinity generation processes over this period. The observed daily stream salinity was reasonably stable
15
at around 85 mg L−1TDS (Fig. 8a). The modelled salinity was slightly smaller than the observed salinity but the overall trend was very similar. The model accurately estimated the stream salt load, including the peaks and recession (Fig. 8b).
The Lemon catchment produced the lowest flow on record in 1979, just two years after clearing. There was an immediate increase in stream salinity, in the order of
20
20 mg L−1 TDS, following clearing. The observed daily salinity was about 100 mg L−1 TDS when the stream started to flow in July (Fig. 9a). The stream salinity systematically increased, particularly during the recession period, to 180 mg L−1TDS in October, then slightly decreased during the storm events. The model reliably represented this salinity generation process. As the modelled streamflow was slightly higher (particularly the
25
peak flow), the peak salt discharge was also higher than observed (Fig. 9b). In 1984, the Lemon catchment received average-annual rainfall, when the permanent
ground-HESSD
2, 1147–1183, 2005
A daily salt balance model for streamflow
generation M. A. Bari and K. R. J. Smettem Title Page Abstract Introduction Conclusions References Tables Figures J I J I Back Close
Full Screen / Esc
Print Version Interactive Discussion
EGU
water system was a few metres below the stream bed (Bari and Smettem, 2005). A total of 25 mm of streamflow was recorded whereas the control Ernies catchment recorded no flow. The predicted stream salinity was about 20 mg L−1 TDS lower than observed at the onset of winter rainfall, but matched well during the period of July to November. The predicted stream salt load was in excellent agreement with the
ob-5
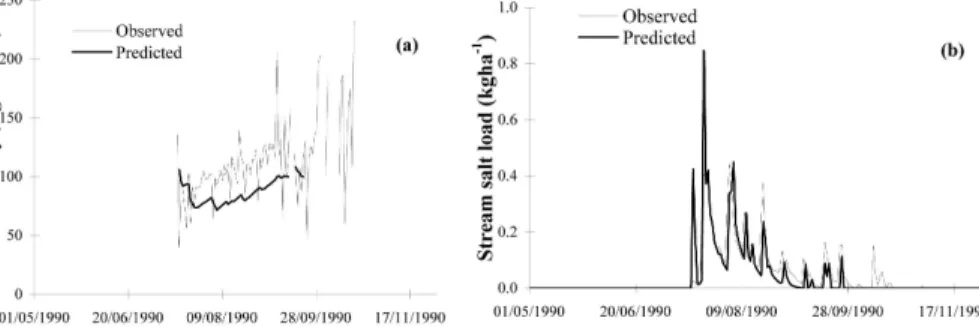
served values. As the groundwater system rose to the surface the stream became perennial in 1990. During dry months (November to May), when only the baseflow was dominant, the observed daily stream salinity was in excess of 2500 mg L−1 TDS. The model was able to predict this reasonably well, though initially the modelled salin-ity was slightly higher (Fig. 10a). During May to October, the predicted daily stream
10
salinity was reasonably well matched, but slightly lower during October to December. The predicted salt load was in close agreement with the observed salt load, with the exception of some peaks (Fig. 10b).
6.2.2. Monthly salinity
At Ernies catchment, the model was able to predict salt loads were well. A satisfactory
15
relationship (R2=0.91) between the observed and predicted monthly salt load was ob-served (Fig. 11a). At Lemon catchment, during the period of 1974–1986, when monthly stream salinity was less than 200 mg L−1 TDS, observed and predicted monthly salt loads were reasonably matched. During the period when the groundwater system was already at the stream invert, the model over predicted the salt load of the dry summer
20
months on a few occasions. Throughout the study period, the predicted and observed monthly stream salt load generally had a good agreement (Fig. 11b).
6.2.3. Annual salinity and load
An excellent agreement between the observed and predicted annual stream salinity and salt load was observed at Ernies catchment. In 1983, the model slightly over
pre-25
HESSD
2, 1147–1183, 2005
A daily salt balance model for streamflow
generation M. A. Bari and K. R. J. Smettem Title Page Abstract Introduction Conclusions References Tables Figures J I J I Back Close
Full Screen / Esc
Print Version Interactive Discussion
EGU
of stream salinity (in excess of 20 mg L−1 TDS). The model also poorly predicted the annual load for 1988, when the catchment experienced two consecutive no-flow years. There is some evidence that the model slightly over predicted the salt load of some of the low flow years, although a very high correlation (R2=0.95) was obtained (Fig. 12b). The observed and predicted salt volumes were 160 kg ha−1and 171 kg ha−1,
respec-5
tively, resulting in an over prediction of 7%. The Ernies catchment was receiving more salt than it was discharging, resulting in a salt output to input ratio of 0.12. Therefore, the catchment salt storage also increased by 700 kg ha−1.
During 1987–1998, when the groundwater system of Lemon catchment was at the surface, the model slightly over predicted the annual load in some of the years. The
10
modelled salinity was reasonable for the whole period of study (Fig. 13a). The rela-tionship between the observed and predicted salt load and salinity were very strong (Fig. 13b). During the study period, total observed and predicted salt discharge from the catchment was 16982 kg ha−1and 18 065 kg ha−1, respectively, representing a 6% over prediction. The salt output to input ratio changed from less than one in the 1980s
15
to in excess of 30 in the 1990s. This is also evident in the catchment salt storage, which started diminishing in the 1990s.
6.3. General discussion
Estimates of Subsurface and Groundwater salt Stores were limited to salt profiles taken from five locations from each of the catchments. The representation of salt content in
20
the regolith could be improved with more data, particularly in the stream zone. The salt content of the subsurface unsaturated zone generally correlates with mean annual rainfall (Stokes et al., 1980). The initial salt content of the Subsurafce Store corre-lated well with the regional estimate. Initially the groundwater salinity varied across the catchments, from less than 1000 mg L−1TDS to in excess of 6000 mg L−1TDS. Most of
25
the bores were slotted over the bottom three metres only. Therefore, it was not possible to accurately monitor the increase in groundwater salinity following mobilisation of the
HESSD
2, 1147–1183, 2005
A daily salt balance model for streamflow
generation M. A. Bari and K. R. J. Smettem Title Page Abstract Introduction Conclusions References Tables Figures J I J I Back Close
Full Screen / Esc
Print Version Interactive Discussion
EGU
salt store by groundwater rise. Most of the groundwater observation bores show some increase in salinity, indicating mobilization and dissolution of salt from the unsaturated profile. The model predicted a systematic increase in salinity of the Groundwater Store of Lemon catchment following the rise in groundwater level. Once the groundwater level has been stabilized, it may contribute more salt to the stream than is received by
5
the recharge component. Therefore the salinity of the Groundwater Store may have a gradual decline over a long period of time. A similar result was also predicted by Hatton et al. (2002).
Since 1987, there has been a dramatic increase in stream salinity at Lemon catch-ment, predominantly due to the onset of groundwater flow to the stream. During the
10
low-flow period of the year, when mainly the baseflow component was active, the mod-elled and observed daily salinity was not well matched, particularly during the period when surface salt was flushed out by storm events. That means the accumulation of salts on the surface due to soil evaporation, and its dilution and flushing by the surface runoff, is not well simulated by the model. However, this has a negligible effect on the
15
overall salt balance of the catchment. Loh and Stokes (1981) noted that the salt accu-mulation and flushing from the stream zone can be attributed to: (a) the magnitude and location of clearing, (b) groundwater table during the previous summer and capillary rise, and (c) summer streamflow and magnitude of early winter flows.
7. Summary and conclusions
20
During the pretreatment period, daily streamflow was generated from saturated excess over land flow and interflow processes only for both catchments. The deep ground-water system did not play any role in flow generation, as it was about 15–20 m below stream surface. Average stream salinity was between 80 to 100 mg L−1 TDS. Follow-ing clearFollow-ing of the Lemon catchment, there was an immediate increase in streamflow.
25
Stream salinity increased to between 100 to 150 mg L−1 TDS. The groundwater sys-tem started to rise, dissolved the salt stored in the unsaturated zone and reached the
HESSD
2, 1147–1183, 2005
A daily salt balance model for streamflow
generation M. A. Bari and K. R. J. Smettem Title Page Abstract Introduction Conclusions References Tables Figures J I J I Back Close
Full Screen / Esc
Print Version Interactive Discussion
EGU
stream invert in 1987. When the groundwater system reached the soil surface the stream became perennial and annual runoff volumes increased 4 to 5 times. Annual stream salinity increased to in excess of 2000 mg L−1 TDS and salt load increased 80 fold.
A coupled salt and water balance model was successfully developed and applied
5
to represent the key hydrological processes associated with land use changes. The structure of the salt balance model remained practically identical to the water balance model. The coupled model has five stores: (i) Dry, Wet and Subsurface Stores, (ii) saturated Groundwater Store, and (iii) a transient Stream zone Store. The Dry and Wet Stores simulate the salt and water movement in the unsaturated zone and near-stream
10
dynamic saturated areas. The Subsurface unsaturated Store represents the salt bulge and the salt fluxes due to percolation and recharge. The Groundwater Store quantifies the salt fluxes to the Stream zone Store. In the transient Stream zone Store a ‘free mixing’ between the inflow salt of surface runoff, interflow and baseflow components is considered.
15
The salt balance model was calibrated sequentially following successful application of the water balance model. We incorporated two parameters to represent di ffusion-dilution-dispersion and salt fluxes due to preferential flow. The model has performed very well in simulating stream salinity generation processes observed at Ernies and Lemon catchments. The simulated and observed daily stream salinity and salt loads
20
compared very well throughout the study period. Over all, the model predicted annual stream salt load by 7% and 6% higher than observed, with R2 of 0.95 and 0.96 for Ernies and Lemon catchment, respectively.
HESSD
2, 1147–1183, 2005
A daily salt balance model for streamflow
generation M. A. Bari and K. R. J. Smettem Title Page Abstract Introduction Conclusions References Tables Figures J I J I Back Close
Full Screen / Esc
Print Version Interactive Discussion
EGU
Appendix A: Symbols and variable names
C Parameter related to the salt release due to percolation (−)
Cd Salinity of the Dry Store (mg L−1)
Cg Salinity of the Groundwater Store (mg L−1)
Ci Percolation salinity (mg L−1)
Cl Salinity of the Subsurface Store (mg L−1)
Cqr2 Salinity of surface runoff Qr2 (mg L−1)
Cqt Streamflow salinity (mg L−1)
Cr Rainfall salinity (mg L−1)
Cre Effective rainfall salinity (mg L−1)
Crf Salinity of the released water from Dry Store (mg L−1)
Crl Recharge salinity (mg L−1)
Csg Salinity of the Stream zone Store (mg L−1)
Cu Parameter related to the salt release from Dry to Wet Store (−)
Cw Salinity of the Wet Store (mg L−1)
d Average depth of top soil (mm)
dg Average depth to groundwater level (mm)
dl Depth of the soil profile (mm)
ds Stream depth (mm)
∆dg Changes in groundwater level (mm)
I Percolation (mm)
Qi Interflow) (mm)
Qr Total surface runoff (mm), (Qr1+ Qr2)
Qr1 Surface runoff (mm)
Qr2 Surface runoff from “impervious area” (mm)
Qb Baseflow to stream (mm)
HESSD
2, 1147–1183, 2005
A daily salt balance model for streamflow
generation M. A. Bari and K. R. J. Smettem Title Page Abstract Introduction Conclusions References Tables Figures J I J I Back Close
Full Screen / Esc
Print Version Interactive Discussion
EGU
Ql oss Groundwater loss below gauge (mm)
Qt Total streamflow (mm)
R Actual rainfall (mm)
RE Effective Rainfall (mm)
Rf “Excess water” released from Dry Store to Wet Store (mm)
Rl Recharge to Groundwater Store (mm)
Sd Salt in the Dry Store (mg mm−2)
Sg Salt in the Groundwater Store (mg mm−2)
∆Ssg Change in salt between Stream zone and Dry Stores (mg mm
−2
)
Si Salt transported by percolation (mg mm−2)
Sl Salt in the Subsurface Store (mg mm−2)
∆Sgl Change in salt between Subsurface and Groundwater Stores (mg mm
−2
)
Sqbl Baseflow salt to Stream zone Store (mg mm−2)
Sqr1 Salt load of surface runoff from pervious area (mg mm−2)
Sqr2 Salt load of surface runoff from “impervious area” (mg mm−2)
Sqi Salt load of interflow (mg mm−2)
Sqb Salt load of baseflow (mg mm−2)
Sql o Salt loss from Groundwater Store (mg mm−2)
Sr Salt storage on the plant canopy (mg mm−2)
Sre Salt fall on the ground with effective rainfall (mg mm−2)
Srf Salt transported by ‘excess water’ from Dry to Wet Store (mg mm−2)
Srl Salt transported by recharge (mg mm−2)
Ssg Salt in the Stream zone Store (mg mm−2)
Sqt Total salt load to stream (mg mm−2)
Sw Salt in the Wet Store (mg mm−2)
Ww Water content of the Wet Store (mm)
HESSD
2, 1147–1183, 2005
A daily salt balance model for streamflow
generation M. A. Bari and K. R. J. Smettem Title Page Abstract Introduction Conclusions References Tables Figures J I J I Back Close
Full Screen / Esc
Print Version Interactive Discussion
EGU
Wg Water content of the Groundwater Store (mm)
Wl Water content of the Subsurface Store (mm)
∆Wgl Changes in water between Subsurface and Groundwater Stores (mm)
Wsg Water content of the Stream zone Store (mm)
∆Wsg Changes in water content of the Stream zone Store (mm)
θf Average soil moisture content of top soil (mm3mm−3)
References
Abrol, I. P., Yadav, J. S. P., and Massoud, F. I.: Salt affected soils and their management. Food and Agricultural Organisation, Soils Bulletin, 39, 131, 1988.
Anon, A.: Salinity: A situation statement for Western Australia – Report to the minister for
5
primary industries and minister for the environment, Western Australia, Perth, 37, 1996. Bari, M. A. and Smettem, K. R. J.: Modelling monthly runoff generation processes following
land use changes: groundwater-surface runoff interactions, Hydrol. Earth Sys. Sci., 8, 5, 903–922, 2004,SRef-ID: 1607-7938/hess/2004-8-903.
Bari, M. A., Smettem, K. R. J., and Sivapalan, M.: Understanding changes in annual runoff
10
following land use changes: a systematic data-based approach, Hydrol. Processes, in press, 2005.
Bari, M. A. and Smettem, K. R. J.: A daily water balance model for representing streamflow generation process following land use changes, Hydrol. Earth Sys. Sci. Discuss., 2, 821– 861, 2005.
15
Bari, M. A. and Croton, J. T.: Predicting the impacts of land use changes on streamflow and salinity by a fully distributed catchment model, in: Hydro2000, Third International Hydrology and Water resources Symposium, The Institute of Engineers, Australia, 2000.
Bari, M. A. and Croton, J. T.: Assessing the effects of valley reforestation on streamflow and salinity using the WEC-C model, in: Hydrology 2002, 27th Hydrology and Water resources
20
Symposium, The Institute of Engineers, Australia, 176, 2002.
Croton, J. T. and Bari, M. A.: Using WEC-C, a fully distributed, deterministic catchment model, to simulate hydrologic responses to agricultural clearing, Environmental Modelling and Soft-ware, 16, 601–614, 2001.
HESSD
2, 1147–1183, 2005
A daily salt balance model for streamflow
generation M. A. Bari and K. R. J. Smettem Title Page Abstract Introduction Conclusions References Tables Figures J I J I Back Close
Full Screen / Esc
Print Version Interactive Discussion
EGU
Ferdowsian, R., George, R. J., Lewis, M. F., McFarlane, D. J., Short, R., and Speed, R.: The extent of dryland salinity in Western Australia, Proceedings, Productive Use of Saline Lands Conference, Albany, Western Australia, 89–97, 1996.
Ghassemi, F., Jakeman, A. J., and Nix, H. A.: Salinisation of land and water resources – human causes, management and case studies, University of New South Wales Press Ltd. Sydney,
5
526, 1995.
Halse, S. A., Ruprecht, J. K., and Pinder, A. M.: Salinisation and prospects for biodiversity in rivers and wetlands of south-west Western Australia, Aust. J. of Botany, 51, 673–688, 2003. Hatton, T. J., Silberstein, R. P., and Salama, R. B.: Catchment salt balances and the future of river salinisation in Australia, CSIRO Land and Water, in: International Groundwater
Confer-10
ence “Balancing the Groundwater Budget”, Darwin, 12–17 May, 2002.
Hatton, T. J., Ruprecht, J., and George, R. J.: Predicting hydrology of Western Australia wheat belt: Target for future?, Plant and Soil, 257, 341–356, 2003.
Hingston, F. J. and Gailitis, V.: The Geographic Variation of Salt Precipitated over Western Australia. Australian J. of Soil Res., 14, 319–335, 1976.
15
Johnston, C. D.: Distribution of environmental chloride in relation to sub-surface hydrology, J. Hydrol., 94, 67–88, 1987.
Johnson, C. D., McArthur, W. M., and Peck, A. J.: Distribution of Soluble Salts in Soils of the Manjimup Woodchip Licence Area, Western Australia. CSIRO Land Resources Management Technical Paper No. 5, 1980, 29, 1987.
20
Klemes, V.: Conceptualisation and scale in hydrology, J. Hydrol., 65, 1–23, 1983.
Loh, I. C. and Stokes, R. A.: Predicting stream salinity in south-western Australia, Agric. Wat. Manage., 4, 227–254, 1981.
Mauger, G. W.: Darling Range Catchment Model, Vol. 1 – Conceptual model, Water Authority of Western Australia, Rep. No. WP 9, 47, 1986.
25
Mayer, X. M., Ruprecht, J. K., Muirden, P. M., and Bari, M. A.: Stream salinity in the south-west of Western Australia, In: Engineering Salinity Solutions, First Engineering and Salinity Solutions Symposium, The Institute of Engineers, Australia, 2004.
Mckell, C. M., Goodin, J. R., and Jeffries, R. L.: Saline land of the United States and Canada, Reclaim. Reveg. Res., 5, 159–165, 1986.
30
Miller, M. L., Brown, P. L., Donovan, J. J., Bergatino, J. L., Sondergger, J. I., and Schmidt, F. A.: Saline seep development and control in the North American Great Plains – hydrogeological aspects, Agricultural Water Management, 4, 115–141, 1981.
HESSD
2, 1147–1183, 2005
A daily salt balance model for streamflow
generation M. A. Bari and K. R. J. Smettem Title Page Abstract Introduction Conclusions References Tables Figures J I J I Back Close
Full Screen / Esc
Print Version Interactive Discussion
EGU
Peck, A. J. and Williamson, D. R. (eds.): Hydrology and salinity in the Collie River Basin, Western Australia, J. Hydrol., 94, 1–198, 1997.
Peck, A. J. and Hatton, T.: Salinity and the discharge of salts from catchments in Australia, J. Hydrol., 272, 191–202, 2003.
Ruprecht, J. K. and Schofield, N. J.: The effect of partial deforestation on hydrology and salinity
5
in high salt storage landscapes, I. Extensive block clearing, J. Hydrol., 129, 19–38, 1991. Schofield, N. J. and Ruprecht, J. K.: Regional analysis of stream salinisation in southwest
Western Australia, J. Hydrol., 112, 19–39, 1989.
Sivapalan, M., Viney, N. R., and Ruprecht, J. K.: Water and salt balance modelling to predict the effect of land use change in forested catchments, III. The large catchment model, Hydrol.
10
Process., 10, 429–446, 1996.
State Salinity Council: Natural resource management in Western Australia – the salinity strat-egy, Government of Western Australia, 72, 2000.
Stokes, R. A., Stone, R., and Loh, I. C.: Summary of Soil Salt Storage Characteristics in the Northern Darling Range. Water Resources Section, Public Works Department of W.A.
15
Report No. 4, 20, 1980.
Stolte, W. J., McFarlane, D. J., and George, R. J.: Flow systems, tree plantations, and salinisa-tion in a Western Australian catchment, Australian J. Soil Res., 35, 1213–1229, 1997. Thornburn, P. J.: Occurrence and management of dryland salinity on the Darling Downs,
Queensland, Australian J. Soil Water Coserv., 4, 26–32, 1991.
20
Tuteja, N. K., Beale, G., Dawes, W., Vaze, J., Murphy, B., Barnett, P., Rancic, A., Evans, R., Geeves, G., Rassam, D., and Miller, M.: Predicting the effects of landuse change on water and salt balance – a case study of a catchment affected by dryland salinity in NSW, Australia, J. Hydrol., 283, 67–90, 2003.
Viney, N. R. and Sivapalan, M.: Modelling catchment processes in the Swan-Avon River basin,
25
Hydrol. Process., 15, 13, 2671–2685, 2001.
Viney, N. R., Sivapalan M., and Deeley, D.: A conceptual model of the nutrient mobilisation and transport applicable at large catchment scale, J. Hydrol., 240, 23–44, 2000.
Williamson, D. R., Stokes, R. A., and Ruprecht, J. K.: Response of input and output of water and chloride to clearing for Agriculture, J. Hydrol., 94, 1–28, 1987.
30
Wood, W. E.: Increase of salt in soil and streams following the destruction of native vegetation, J. R. Soc. W. A., 10, 35–47, 1924.
HESSD
2, 1147–1183, 2005
A daily salt balance model for streamflow
generation M. A. Bari and K. R. J. Smettem Title Page Abstract Introduction Conclusions References Tables Figures J I J I Back Close
Full Screen / Esc
Print Version Interactive Discussion
EGU
% %
Collie River South Bingham River James Crossing 4 1 0 0 0 0 E 6340000 N 6270000 N James Well Wellington Reservoir 4 7 0 0 0 0 E Harris River Collie % Darkan Lemon Coolangata Farm Ernies Willi ams C ollie Rd C o llie R d S o uth Ea st Coalfield s Rd Mungalup Tower N Rivers % Towns Subcatchment Main roads Reservoir Experimental catchment $ Gauging station Legend 7 0 7 14 Kilometres W A Collie River
Fig. 1. Location of the experimental catchments (after Bari and Smettem, 2005)
Fig. 1. Location of the experimental catchments (after Bari and Smettem, 2005).
HESSD
2, 1147–1183, 2005
A daily salt balance model for streamflow
generation M. A. Bari and K. R. J. Smettem Title Page Abstract Introduction Conclusions References Tables Figures J I J I Back Close
Full Screen / Esc
Print Version Interactive Discussion
EGU
Fig. 2.
Comparison of annual salt load between Ernies and Lemon catchments
Fig. 2. Comparison of annual salt load between Ernies and Lemon catchments.HESSD
2, 1147–1183, 2005
A daily salt balance model for streamflow
generation M. A. Bari and K. R. J. Smettem Title Page Abstract Introduction Conclusions References Tables Figures J I J I Back Close
Full Screen / Esc
Print Version Interactive Discussion
EGU
Fig. 3. Schematic representation of a hill slope by five-store model
Fig. 3. Schematic representation of a hill slope by five-store model.
HESSD
2, 1147–1183, 2005
A daily salt balance model for streamflow
generation M. A. Bari and K. R. J. Smettem Title Page Abstract Introduction Conclusions References Tables Figures J I J I Back Close
Full Screen / Esc
Print Version Interactive Discussion
EGU Fig. 4. Schematic representation of the water and salt balance model
Fig. 4. Schematic representation of the water and salt balance model.
HESSD
2, 1147–1183, 2005
A daily salt balance model for streamflow
generation M. A. Bari and K. R. J. Smettem Title Page Abstract Introduction Conclusions References Tables Figures J I J I Back Close
Full Screen / Esc
Print Version Interactive Discussion
EGU
Fig. 5. Ernies catchment (a) Salt Storage of Dry Store, and (b) Salinity of the Wet Store
Fig. 5. Ernies catchment (a) Salt Storage of Dry Store, and (b) Salinity of the Wet Store.
HESSD
2, 1147–1183, 2005
A daily salt balance model for streamflow
generation M. A. Bari and K. R. J. Smettem Title Page Abstract Introduction Conclusions References Tables Figures J I J I Back Close
Full Screen / Esc
Print Version Interactive Discussion
EGU
27
Fig. 6.
Salinity at the saturated area of Lemon catchment
Fig. 6. Salinity at the saturated area of Lemon catchment.
HESSD
2, 1147–1183, 2005
A daily salt balance model for streamflow
generation M. A. Bari and K. R. J. Smettem Title Page Abstract Introduction Conclusions References Tables Figures J I J I Back Close
Full Screen / Esc
Print Version Interactive Discussion
EGU Fig. 7. Actual and predicted stream (a) salinity and (b) salt load for 1990 – Ernies catchment
Fig. 7. Actual and predicted stream (a) salinity and (b) salt load for 1990 – Ernies catchment.
HESSD
2, 1147–1183, 2005
A daily salt balance model for streamflow
generation M. A. Bari and K. R. J. Smettem Title Page Abstract Introduction Conclusions References Tables Figures J I J I Back Close
Full Screen / Esc
Print Version Interactive Discussion
EGU Fig. 8. Actual and predicted stream (a) salinity and (b) salt load for 1996 – Ernies catchment
Fig. 8. Actual and predicted stream (a) salinity and (b) salt load for 1996 – Ernies catchment.
HESSD
2, 1147–1183, 2005
A daily salt balance model for streamflow
generation M. A. Bari and K. R. J. Smettem Title Page Abstract Introduction Conclusions References Tables Figures J I J I Back Close
Full Screen / Esc
Print Version Interactive Discussion
EGU
Fig. 9. Actual and predicted stream (a) salinity and (b) salt load for 1979 - Lemon catchment
Fig. 9. Actual and predicted stream (a) salinity and (b) salt load for 1979 - Lemon catchment.
HESSD
2, 1147–1183, 2005
A daily salt balance model for streamflow
generation M. A. Bari and K. R. J. Smettem Title Page Abstract Introduction Conclusions References Tables Figures J I J I Back Close
Full Screen / Esc
Print Version Interactive Discussion
EGU Fig. 10. Actual and predicted stream (a) salinity and (b) salt load 1990 – Lemon catchment
Fig. 10. Actual and predicted stream (a) salinity and (b) salt load 1990 – Lemon catchment.
HESSD
2, 1147–1183, 2005
A daily salt balance model for streamflow
generation M. A. Bari and K. R. J. Smettem Title Page Abstract Introduction Conclusions References Tables Figures J I J I Back Close
Full Screen / Esc
Print Version Interactive Discussion
EGU Fig. 11. Monthly stream salt load relationships - (a) Ernies, (b) Lemon catchments
Fig. 11. Monthly stream salt load relationships – (a) Ernies, (b) – Lemon catchments.
HESSD
2, 1147–1183, 2005
A daily salt balance model for streamflow
generation M. A. Bari and K. R. J. Smettem Title Page Abstract Introduction Conclusions References Tables Figures J I J I Back Close
Full Screen / Esc
Print Version Interactive Discussion
EGU
Fig. 12. Actual and predicted annual stream (a) salinity and (b) salt load – Ernies catchment
Fig. 12. Actual and predicted annual stream (a) salinity and (b) salt load – Ernies catchment.
HESSD
2, 1147–1183, 2005
A daily salt balance model for streamflow
generation M. A. Bari and K. R. J. Smettem Title Page Abstract Introduction Conclusions References Tables Figures J I J I Back Close
Full Screen / Esc
Print Version Interactive Discussion
EGU
Fig. 13. Actual and predicted annual stream (a) salinity and (b) salt load – Lemon catchment
Fig. 13. Actual and predicted annual stream (a) salinity and (b) salt load – Lemon catchment.