HAL Id: hal-00296372
https://hal.archives-ouvertes.fr/hal-00296372
Submitted on 12 Nov 2007
HAL is a multi-disciplinary open access
archive for the deposit and dissemination of
sci-entific research documents, whether they are
pub-lished or not. The documents may come from
teaching and research institutions in France or
abroad, or from public or private research centers.
L’archive ouverte pluridisciplinaire HAL, est
destinée au dépôt et à la diffusion de documents
scientifiques de niveau recherche, publiés ou non,
émanant des établissements d’enseignement et de
recherche français ou étrangers, des laboratoires
publics ou privés.
comparison of MIPAS satellite data with the chemistry
climate model ECHAM5/MESSy1
C. Brühl, B. Steil, G. Stiller, B. Funke, P. Jöckel
To cite this version:
C. Brühl, B. Steil, G. Stiller, B. Funke, P. Jöckel. Nitrogen compounds and ozone in the
strato-sphere: comparison of MIPAS satellite data with the chemistry climate model ECHAM5/MESSy1.
Atmospheric Chemistry and Physics, European Geosciences Union, 2007, 7 (21), pp.5585-5598.
�hal-00296372�
www.atmos-chem-phys.net/7/5585/2007/ © Author(s) 2007. This work is licensed under a Creative Commons License.
Chemistry
and Physics
Nitrogen compounds and ozone in the stratosphere: comparison of
MIPAS satellite data with the chemistry climate model
ECHAM5/MESSy1
C. Br ¨uhl1, B. Steil1, G. Stiller2, B. Funke3, and P. J¨ockel1
1Max-Planck-Institute for Chemistry, Mainz, Germany
2Institute for Meteorology and Climate Research, Forschungszentrum Karlsruhe, Germany 3Instituto de Astrof´ısica de Andaluc´ıa, Granada, Spain
Received: 1 June 2007 – Published in Atmos. Chem. Phys. Discuss.: 9 July 2007 Revised: 25 October 2007 – Accepted: 30 October 2007 – Published: 12 November 2007
Abstract. The chemistry climate model ECHAM5/MESSy1
(E5/M1) in a setup extending from the surface to 80 km with a vertical resolution of about 600 m near the tropopause with nudged tropospheric meteorology allows a direct comparison with satellite data of chemical species at the same time and location. Here we present results out of a transient 10 years simulation for the period of the Antarctic vortex split in September 2002, where data of MIPAS on the ENVISAT-satellite are available. For the first time this ENVISAT-satellite instru-ment opens the opportunity, to evaluate all stratospheric ni-trogen containing species simultaneously with a good global coverage, including the source gas N2O and ozone which al-lows an estimate for NOx-production in the stratosphere. We show correlations between simulated and observed species in the altitude region between 10 and 50 hpa for different lat-itude belts, together with the Probability Density Functions (PDFs) of model results and observations. This is supple-mented by global maps on pressure levels showing the com-parison between the satellite and the simulated data sampled at the same time and location. We demonstrate that the model in most cases captures the partitioning in the nitrogen family, the diurnal cycles and the spatial distribution within experi-mental uncertainty. This includes even variations due to tro-pospheric clouds. There appears to be, however, a problem to reproduce the observed nighttime partitioning between N2O5 and NO2in the middle stratosphere using the recommended set of reaction coefficients and photolysis data.
1 Introduction
The nitrogen oxides are produced in the stratosphere by ox-idation of the mostly biogenic source gas N2O involving
ex-Correspondence to: C. Br¨uhl
ited oxygen (O(1D)). They provide the most important cat-alytic sink for ozone in the middle stratosphere and explain most of the seasonal cycle of total ozone in mid-latitudes (Br¨uhl and Crutzen, 2000; Crutzen and Schmailzl, 1983). They are also responsible for the deactivation of chlorine from the CFCs in the lower stratosphere. In polar winter and spring the heterogeneous conversion of N2O5and ClONO2 inside the cold vortices to HNO3 and subsequent denitrifi-cation by sedimentation of HNO3 containing polar strato-spheric cloud particles set the conditions for the ozone hole, the fast ozone destruction by halogens (Solomon, 1999). Here we present as an efficient way of evaluation point-by-point comparisons between satellite data and a Chemistry Climate Model (CCM) simulation for all species of the NOy -family simultaneously, including its source gas and dynami-cal tracer N2O and ozone. The combination of satellite and model data is also used for sensitivity studies on the con-sequences of new findings in the kinetics of nitrogen oxide reactions and on simplifications in photolysis calculations. Such a study might help to resolve problems present in many CCMs to correctly represent ozone in the lower and middle stratosphere compared to observations (Eyring et al., 2006). On the other hand, comparison between observed trace gas fields from a satellite instrument like MIPAS and a nudged CCM is valuable to check the self-consistency of satellite data.
For a detailed analysis of the dynamics of the Antarctic major warming, the so-called vortex split, we refer to a spe-cial issue of Journal of Atmospheric Sciences in March 2005 (e.g. Newman and Nash, 2005).
2 MIPAS satellite data
MIPAS (Michelson Interferometer for Passive Atmospheric Sounding) is a Fourier transform spectrometer sounding the
thermal emission of the earth’s atmosphere between 685 and 2410 cm−1(14.6–4.15 µm) in limb geometry (von Clarmann
et al., 2003). It is operational on the ENVISAT since sum-mer 2002. We use data from the nominal observation mode (6–68 km). The field-of-view of the instrument at the tan-gent points is about 3 km in the vertical (up to 45 km) and 30 km in the horizontal (longitude). There are 14.3 orbits per day with measurements obtained about every 5◦latitude
at day and night at fixed local time (about 10 and 22 h) al-lowing for global coverage in one day. MIPAS was oper-ational from July 2002 to March 2004 with full specifica-tion, in particular 0.035 cm−1 spectral resolution. MIPAS
data used within this comparison are trace gas distributions retrieved with the IMK/IAA scientific processor based on re-processed Level-1b data (versions 4.61/62). Spectra contain-ing cloud signal (mainly PSCs in this context) were identi-fied using a method suggested by Spang et al. (2004) and have been excluded from further analysis. The general strat-egy and formalism of the retrieval is discussed in detail in von Clarmann et al. (2003). Data are available from July 2002 to March 2004 (however, not with complete coverage), except for NO, where only 3 consecutive days during the vor-tex split period in September 2002 and a few individual days in Winter 2003/2004 were processed up to now.
Typical error ranges in the lower stratosphere of midlati-tudes are: O35% (Glatthor et al., 2006), N2O 7% (+7% high bias in tropics, Glatthor et al., 2005), HNO310% (Wang et al., 2007; Mengistu Tsidu et al., 2005), NO2 8% (night) – 18% (day) (Funke et al., 2005), NO 15% (day) (Funke et al., 2005), N2O530% (Mengistu Tsidu et al., 2004), HO2NO2 19% (Stiller et al., 2007), ClONO2 7–13% (H¨opfner et al., 2007). Improved non-LTE (local thermodynamic equilib-rium) retrieval schemes (V8.0) for NO and NO2 are used. These improvements include i) the use of log(VMR) instead of VMR (volume mixing ratio) in the retrieval vector, ii) re-vised non-LTE parameters for NO2, and iii) joint-fitted VMR horizontal gradients at constant longitudes and latitudes. For NO retrievals, a revised set of spectral windows (micro-windows) is applied, which allows to measure NO down to altitudes of about 15 km. Compared to Funke et al. (2005) much more valid profiles for the vortex split period are avail-able and the number of NO outlyers is strongly reduced.
3 The chemical circulation model ECHAM5/MESSy1
The atmospheric chemistry general circulation model ECHAM5/MESSy1 (E5/M1) is based on the 5th generation European Centre Hamburg GCM, a spectral general circula-tion model. The configuracircula-tion applied for this study has a horizontal spectral resolution of T42 (or about 2.8◦for the
corresponding quadratic Gaussian grid) and 90 layers from the surface to about 80 km (1 Pa) (Giorgetta et al., 2006). The vertical resolution in the lower stratosphere is about 600 m. The model is able to calculate the Quasi-Biennial Oscillation
internally, i.e., without assimilation of observational data. In the free mode only the sea surface temperatures and mix-ing ratios or fluxes of chemical species are needed as lower boundary conditions. To allow for a direct and efficient com-parison with observations of chemical species in the simula-tion used for the evaluasimula-tion, tropospheric temperatures, vor-ticity and divergence and surface pressure are weakly nudged to ECMWF operational data (700 to 200 hPa), see J¨ockel et al. (2006). The results presented here are part of a transient simulation from 1996 to 2005. As main part of the Modu-lar Earth Submodel System (MESSy, J¨ockel et al., 2005), the model has fully interactive and flexible chemistry (Sander et al., 2005) with 104 species and about 250 homogeneous and heterogeneous reactions (+6 species and 40 reactions in cloud droplets), including interactive photolysis. The scheme covers the most important reactions and species from the tro-posphere to the mesosphere. The chemical kinetics is mostly based on Sander et al. (2002). As in Stiller et al. (2007), infrared photolysis of HO2NO2(short HNO4) is included.
4 Point-by-point comparisons between model results and satellite data
For the comparison the model data points closest to the ob-servations in space and time are selected. To avoid deviations due to the strong diurnal cycle of some nitrogen species the study is based on hourly output of the CCM for the selected period (instead of the 5 h setting in J¨ockel et al., 2006).
4.1 Zonal averages
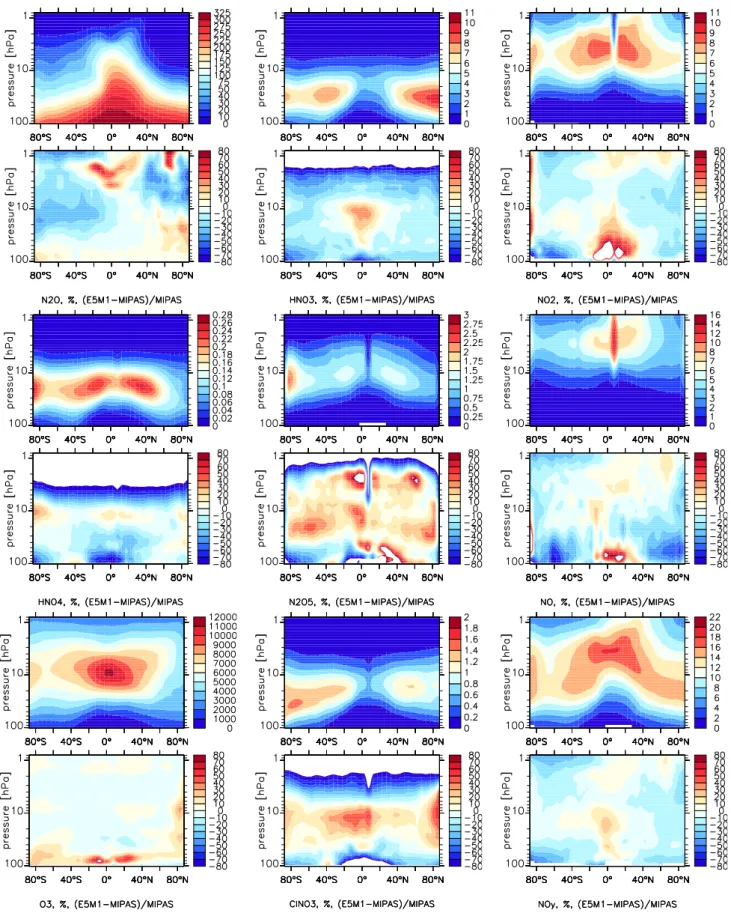
For the first time it is possible, to compare simulated global fields of N2O and all major compounds of reactive nitrogen NOy=HNO3+NO+NO2+2 N2O5+HNO4+ClNO3 simultane-ously with satellite data, using day and night data. First the zonal averages in the stratosphere, based on point-by-point comparisons, for the period from 23 to 25 September 2002 are shown in Fig. 1. Note that due to the peculiar dynamical situation of the split Antarctic vortex only the results north of about 50◦S should be interpreted as typical. The upper
panels in each group show the simulations, the lower panels the relative differences to the MIPAS data. The MIPAS data itself and absolute differences are supplied in the electronic supplement (http://www.atmos-chem-phys.net/7/5585/2007/ acp-7-5585-2007-supplement.pdf). Comparisons for a sub-set of species for other periods are shown in J¨ockel et al. (2006).
From N2O (upper left panels) it can be seen that the south-ern hemispheric subtropical barrier in the model appears to be shifted towards the equator and too strong causing too low N2O in the subtropical and mid-latitude middle strato-sphere. The transport barriers and their tightness or chemical distinctness have been analysed using the methods described in Sparling (2000). We found for the whole period where
Fig. 1. Simulated zonal averages at MIPAS datapoints (ppbv, upper panel) and relative differences to MIPAS (%, lower panel) for 23–25
September 2002: upper two rows N2O, HNO3, NO2, middle two rows HNO4, N2O5, NO, lower two rows O3, ClNO3and NOy. Note that at 8◦N MIPAS has only daytime data.
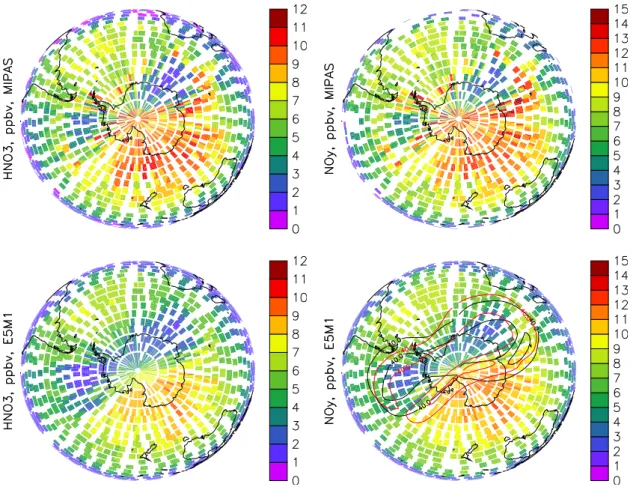
Fig. 2. HNO3and NOyat 50 hPa, showing the split vortex over Antarctica. Upper panels: MIPAS observations, lower panels: simulations with E5/M1 for 23–25 September 2002. The contours show the position of the wind maximum (m/s) on 23 September (red) and 25 September (black) as indicator of the vortex edge.
MIPAS N2O data were available that the model tends to have such a behaviour with maximum differences in tightness in September 2003, where the phase of the QBO is opposite to September 2002. A shifted and too tight barrier is consis-tent with too high NOy(lower right panels) in the southern subtropics, indicating processed air coming from above and separated from the tropics. Here the differences can reach 20%. The anti-correlation to N2O in the middle stratosphere is also visible in the individual nitrogen compounds shown in the other panels of Fig. 1. The largest differences in N2O and NOy are in the lowermost stratosphere near the south-pole indicating a too weak downward motion in the model and maybe too much removal of HNO3by sedimentation of PSC particles. Since here the zonal average covers airmasses from inside and outside the vortices, including regions with strong horizontal gradients, differences can be also due to the different horizontal resolution of the observations and the model (see also next section). On the other hand, the uncer-tainties of the satellite data are also largest there. In the north-ern hemispheric lower stratosphere the model agrees with the observations within their uncertainty range.
The data sets for day and night in the simulation and in the observations are consistent, as can be seen from the fact that the spikes in NO, NO2and N2O5(and weaker in HNO4 and ClNO3) appearing in a latitude belt around 8◦N, where only daytime observations are available, vanish in total NOy. The large differences in the partitioning between N2O5and NOx(=NO+NO2) near the south-pole are due to latitude mis-matches between model data and observations which are crit-ical at the terminator and due to the impact of large horizon-tal gradients on the satellite data retrieval. The day night differences will be discussed in more detail in the next sec-tions. The vertical difference patterns in ozone and HNO4are mostly related to the lower vertical resolution of the satellite data compared to the model. As shown in J¨ockel et al. (2006) and Stiller et al. (2007) these differences would be reduced if the model data would be convolved with averaging kernels of the satellite data.
4.2 The southern vortex split, spatial distribution of nitro-gen species and ozone
The lower stratospheric dynamics and the distribution of ozone is to a large extent controlled by planetary waves prop-agating from the troposphere. Nudging of the tropospheric meteorology enables the model to reproduce the major strato-spheric warming and the remarkable split of the Antarctic vortex in September 2002 consistent with the findings of Newman and Nash (2005). Here we focus on the altitude levels 50 hPa (interesting for polar heterogeneous chemistry) and 10 hPa (interesting for nitrogen summer chemistry and dynamics).
4.2.1 Lower stratosphere
The two remnants of the split vortex can be clearly seen in the quasi-synoptic view of the observations and the simula-tions of HNO3and the total reactive nitrogen NOyat 50 hPa in Fig. 2. In the lower right panel the vortex edges with a wind maximum are indicated by the simulated wind contours for the first and third day of the shown period. The features look rather similar except that in the observations the peaks of HNO3and NOy near the edges of the vortices are more distinct than in the simulation.
Figure 3 shows the global view including also N2O, O3 and all the individual reactive nitrogen species, where the simultaneous observations are available for the first time. Here the upper panels of each group show the model results and the lower panels the absolute devia-tions from the satellite data. The satellite data itself and the relative differences are provided in the electronic supplement (http://www.atmos-chem-phys.net/7/5585/2007/ acp-7-5585-2007-supplement.pdf). Since the footprints of the nighttime and daytime parts of the orbits (ascending and descending nodes) intersect on the maps, for NO, NO2 and N2O5, the species with the largest diurnal variation, day and night are shown separately to avoid noisy maps. As crite-rion for day a solar zenith angle smaller 93◦in the satellite
data is selected in consistency with the photolysis calcula-tion. Nighttime (late evening) NO2 and daytime NO have similar spatial patterns with maxima in the subtropics and minima in the two parts of the Antarctic vortex. For daytime NO in low latitudes the differences are noisy due to the ef-fects of reflected radiation from tropospheric clouds on NO2 photolysis (which cannot be expected to be coherent).
The largest differences occur near the vortex edges due to resolution differences and slight offsets of the wave pat-terns. In general the model reproduces the observed dis-tribution of ozone, N2O, total nitrogen and the partition-ing (see also http://www.atmos-chem-phys.net/7/5585/2007/ acp-7-5585-2007-supplement.pdf) of the nitrogen species, including the diurnal cycle and the denitrification in the Antarctic vortices. The ozone depletion in the vortices by halogens is somewhat underestimated, mostly due to an
un-derestimate of downward transport of chlorine into the lower stratosphere in Antarctic winter (J¨ockel et al., 2006). The underestimate of downward transport is also indicated by too high N2O inside the vortices (see also Fig. 1). On the other hand N2O in southern mid-latitudes and between the vor-tex lobes is too low, which may indicate too much mixing at the vortex edge. For HNO3, NO2 and NOy the eastern and western vortex lobes in the observations are more dif-ferent concerning denitrification than in the model. HNO4is too high in southern mid-latitudes and between the vortices. NO, NO2 and N2O5 show the largest differences near the south pole pointing to effects of the different horizontal res-olution (maximum mismatch about 2◦latitude) and not well
defined longitude of the observations, or possibly, artifacts in the retrieval of the satellite data due to the large horizon-tal gradients near the terminator, where the satellite moves from day to night and the backward view of the sunlit limb is impacted by N2O5rich air in the dark part of the optical path.
For chlorine nitrate the relatively large differences in the vortices are related to the coarser vertical resolution of the MIPAS data compared to the model and to the fact that the underestimated ozone depletion favours the formation of chlorine nitrate instead of HCl when there are no more polar stratospheric clouds, i.e. in the chlorine deactivation phase. In both, observations and simulations there is still a ClNO3 -collar at the edges of the vortex lobes (H¨opfner et al., 2004). Here ClNO3can contribute up to about 35% to NOy.
4.2.2 Middle stratosphere
In the results for 10 hPa shown in Fig. 4 the differences are largest near the southern subtropical barrier which appears to be shifted towards the equator in the model in this altitude region as can be seen from too low N2O and too high NOy (including HNO3) at about 15◦S (compare Fig. 1). In the model N2O in the southern mid-latitudes is low biased and NOyhigh biased because of a too tight subtropical barrier.
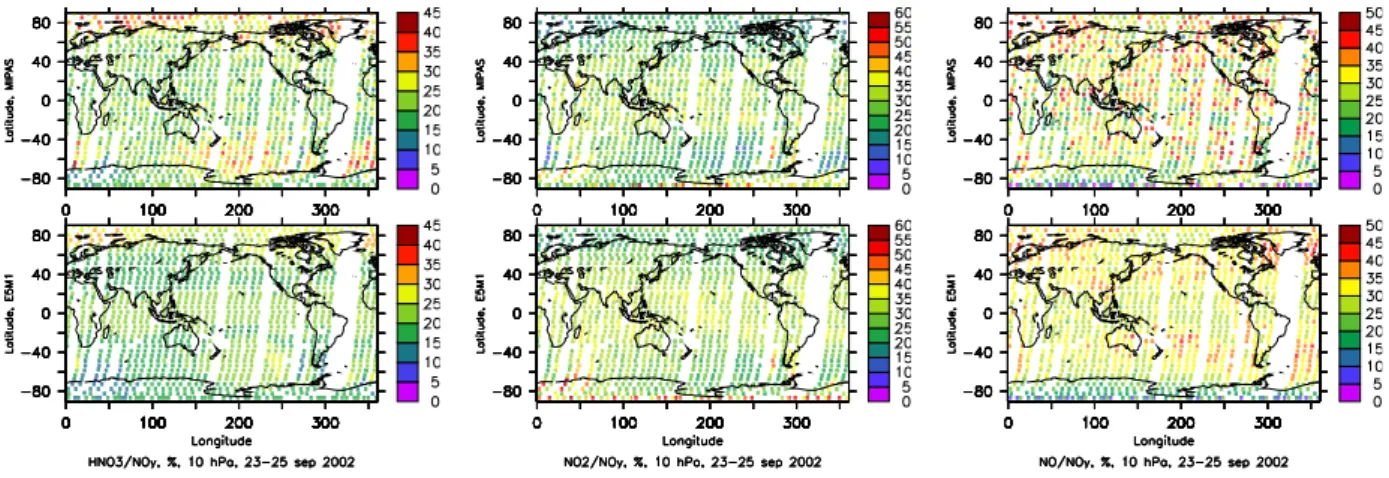
Despite the differences due to the dynamics the parti-tioning of NOy is well represented in the simulation as shown for the major species in Fig. 5 and for the full set for daytime and nighttime conditions in the electronic supplement (http://www.atmos-chem-phys.net/7/5585/2007/ acp-7-5585-2007-supplement.pdf). In both, the observations and the simulations, the anticorrelation between NO and NO2 due to cloud effects on NO2photolysis is visible. At the south-pole the partitioning between N2O5and NO+NO2 is shifted towards NO+NO2in the model because of perma-nent N2O5photolysis, while the observations might be arti-ficially effected by high nighttime N2O5(see above). There are also large differences near the western vortex lobe near the south pole in NOy probably due to differences in the wave patterns. The simulated reservoir species ClONO2is high in the Arctic, while HNO3is low there as already seen in Fig. 1. In the Antarctic the observed split vortex is well
Fig. 3. N2O, NOy, O3(first 2 rows), HNO3, NO2day and night (second 2 rows), HNO4, NO day and night (third 2 rows), ClONO2(ClNO3), N2O5day and night (fourth 2 rows) at 50 hPa for 23–25 September 2002 as simulated by ECHAM5/MESSy1 (upper panels) and absolute deviations of the model to MIPAS observations (point-by-point in space and time, lower panels of each group).
Fig. 5. NOypartitioning at 10 hPa in the observations (top) and the simulations (bottom) at daytime. HNO3(left), NO2(middle), NO (right).
Fig. 6. HNO3and day and night NO2at 10 hPa in the sensitivity simulation including the reaction pathway of Butkovskaya et al. (2005). Upper panels: simulation, lower panels: difference to MIPAS.
represented in the simulations, except for a maybe slightly overestimated denitrification from overestimated PSCs there (see NOy, HNO3, NO2 and ClNO3 in Fig. 4). The rea-son for the low model HNO3 in the vortices can also be the neglect of a new reaction leading from NOxto HNO3: NO+HO2→HNO3(Butkovskaya et al., 2005). Inclusion of this reaction in a sensitivity simulation leads to better agree-ment for HNO3(see Fig. 6 compared to Fig. 4) because this provides a significant source for HNO3(and a sink for NOx) in the middle and upper stratosphere where the vortex air originates from. HNO3 at the vortex lobes increases with the additional reaction pathway by about 0.5 ppbv. As can be seen from Fig. 6, also NO2in the midlatitudes gets closer to the observations.
4.3 Comparison based on correlations and probability den-sity functions
Instead of comparing patterns as in the previous section, here we analyse point-by-point correlations and probability den-sity functions (PDFs) for mixing ratios in latitude bins. For the correlations day and night are analysed separately. As examples we show in Fig. 7 the lower stratosphere at high southern latitudes and in Fig. 8 the middle stratosphere in northern mid-latitudes, corresponding to Figs. 3 and 4, re-spectively. The first example is selected to illustrate the ef-fects of dynamics and heterogeneous chemistry, the second for typical late summer gas-phase chemistry.
In high southern latitudes at 50 hPa (Fig. 7) the PDFs for the observations and the simulation are rather similar, except for the low bias of N2O outside the vortex lobes in the model (as discussed before) and more high HNO3and NOyvalues in the observations. The vortex peaks in the PDFs for N2O and NOyin the model data and the observations (low values)
Fig. 7. Point-by-point correlations of MIPAS data to ECHAM5/MESSy1 results and probability density functions (PDF) for 50 to 90◦S at
50 hPa, 23–25 September 2002. Scatterplots: day red, night black; PDFs: MIPAS red, model blue. Upper rows: N2O, total nitrogen NOy, HNO3, and HNO4; lower rows: N2O5, NO, NO2, and ClONO2. R is the correlation coefficient, N the number of data points in the latitude bin (separate for day and night). For the PDFs the bins for the observations are shifted by 10% of the binsize for better visibility.
are close together, while the peaks for non-vortex air (high values) are different. For NO the zero nighttime values have a probability of about 50% in the model data and the ob-servations which is consistent with equinox conditions. For NO2, N2O5and HNO4very low values are more likely in the simulations than in the observations. Comparison with Fig. 3 reveals that these low values occur in vortex air pointing to slight differences in heterogeneous chemistry.
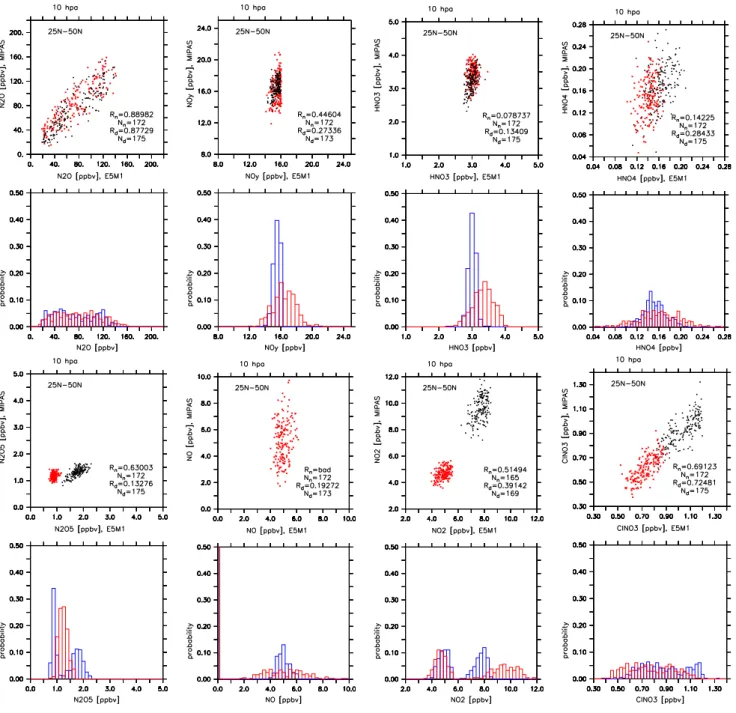
In the middle stratosphere of the northern mid-latitudes (10 hPa, Fig. 8) the variability of HNO3, NO and NOy, which is dominated by NO in this altitude, is larger in the obser-vations than in the simulation. As a consequence, for NOy the width of the PDF of the observations is much larger than the one for the model, however, the PDFs peak around about the same value with 16 ppbv in the observations and 15.4 ppbv in the simulation. This behaviour implies
rela-Fig. 8. As rela-Fig. 7 but for 25 to 50◦N at 10 hPa, 23–25 September 2002. Note the zero values for nighttime NO. MIPAS red, model blue.
tively low correlations. In contrast to the high latitude lower stratosphere shown in Fig. 7, HNO4and ClNO3have a clear diurnal variation. In NO2and NO in observations and sim-ulations the clusters related to the diurnal cycle are visible, however, the nighttime peak for NO2in the model is low bi-ased. For N2O5the model tends to overestimate the diurnal cycle in the middle stratosphere which was already indicated at 50 hPa. The high bias at nighttime (22 h local time) is consistent with the diurnal behaviour of NO2. It can nei-ther be explained by more NO3formation due to about 3% too high ozone in this region (Fig. 1), nor by a temperature
bias. The diurnal sampling of the simulation data should give only a small contribution to the differences, since for the se-lected equinox conditions the observations are about 4 hours apart from sunset or sunrise (except for the poles). Inclu-sion of NO+HO2→HNO3and the channel to NO3+NO+O in N2O5photolysis (which was neglected in the setup described in J¨ockel et al., 2006) reduces the discrepancies slightly as shown in Fig. 9. We have performed several sensitivity stud-ies using additional pathways in the photolysis calculations or changes in reaction coefficients given in the most recent recommendation (Sander et al., 2006), without achieving a
Fig. 9. Sensitivity simulation with the reaction of Butkovskaya et al. (2005) and a more detailed photolysis of N2O5for N2O5, NO and NO2 at 10 hPa, colors and symbols as in Fig. 7.
significantly better agreement with the observations for the late evening values of NO2and N2O5. The discrepancy is also not sensitive to the twilight parameterization in the cal-culation of photolysis rates. It is still unresolved, if the repre-sentation of the homogeneous and heterogeneous chemistry in the model is incomplete, or a problem with absorption cross sections or quantum yields of N2O5photolysis is the reason, or a problem with the satellite observations causes the discrepancies in the diurnal cycle in northern midlatitude autumn.
5 Production of reactive nitrogen from N2O
MIPAS N2O, O3 and temperature together with the O(1D)/O3ratio from E5/M1 are used to derive the chemical production of NOy. Fig. 10 shows the production at about 10 h local time at the satellite points at 2 altitudes. The val-ues are about 3 times the diurnal average which is consistent with the diurnal cycle of O(1D). The individual data-points show a variability due to the dynamics in N2O and due to cloud effects on the photolysis of O3leading to O(1D). Using the model data only at the satellite data points leads to some-what less NOyproduction in the middle stratosphere reflect-ing the bias of MIPAS N2O and differences in the dynamics of the southern hemisphere already identified in Fig. 4. This is consistent with the slightly lower NOyshown in Fig. 8. At 50 hPa the effects of the differences in O3and N2O shown in Fig. 3 almost compensate with respect to production of re-active nitrogen. The main patterns are similar to the average production calculated purely from the model in the
lower-most panels, supporting the consistency between N2O and NOyalready seen from the previous figures. Clearly visible are again the two lobes of the Antarctic vortex where NOy -production is low due to low N2O and O3.
6 Conclusions
ECHAM5/MESSy1 with nudged tropospheric meteorology captures most of the features of nitrogen species observed by MIPAS on ENVISAT in the lower stratosphere, including the 2002 Antarctic vortex split and the diurnal variation of NO and NO2. MIPAS allows a complete evaluation of the NOy -family and the nitrogen budget. The partitioning of nitrogen species in the model especially in mid-latitudes and tropics agrees well with observations (if NIR-photolysis of HO2NO2 is included). There are, however, differences in the diurnal behaviour of N2O5and NO2in the middle stratosphere. As shown by sensitivity studies they cannot be explained by the model dynamics, resolution differences or given uncertain-ties in the chemistry used in the calculations. There might be the need for more laboratory work.
The model underestimates the downward transport in the lowermost parts of the vortices with the consequence of un-derestimated ozone depletion by reactive halogens, and a shift to chlorine-nitrate in the chlorine partitioning. Another model feature is the too tight southern subtropical barrier causing too low N2O and too high NOyin the middle strato-sphere of southern mid-latitudes. Here appears to be a need to improve the model dynamics, particularly the forcing by gravity waves.
Fig. 10. Upper panels: NOy-production at 10 h local time (about 3 times the diurnal average) and 22 h local time (only polar day near the south-pole) based on MIPAS N2O, O3, T and the O(1D)/O3ratio from the model at the data points. 10 hPa left, 50 hPa right. Middle panels: NOy-production at the satellite points using model data only. Lower panels: Diurnal average from the simulation only for the same period
(23–25 September 2002).
Acknowledgements. Parts of this study were supported by the European Union Integrated Project SCOUT-O3.
Edited by: M. Dameris
References
Br¨uhl, C. and Crutzen, P. J.: NOx-catalyzed ozone destruction and NOxactivation at midlatitudes to high latitudes as a main cause of the spring to fall ozone decline in the Northern Hemisphere, J. Geophys. Res., 105, 12 163–12 168, 2000.
Butkovskaya, N. I., Kukui, A., Pouvesle, N., and Le Bras, G.: For-mation of nitric acid in the gas-phase HO2+NO reaction: Effects of temperature and water vapor, J. Phys. Chem. A, 109, 6509– 6520, 2005.
Crutzen, P. J. and Schmailzl, U.: Chemical budgets of the strato-sphere, Planet. Space Sci., 31, 1009–1032, 1983.
Eyring, V., Butchart, N., Waugh, D. W., Akiyoshi, H., Austin, J., Bekki, S., Bodeker, G. E., Boville, B. A., Br¨uhl, C., Dameris, M., Deushi, M., Fioletov, V. E., Frith, S. M., Garcia, R. R., Get-telman, A., Giorgetta, M. A., Grewe, V., Jourdain, L., Kinnison, D. E., Mancini, E., Manzini, E., Marchand, M., Marsh, D. R., Nagashima, T., Newman, P. A., Nielsen, J. E., Pawson, S., Pitari, G., Plummer, D. A., Rozanov, E., Schraner, M., Shepherd, T. G., Shibata, K., Stolarski, R. S., Struthers, H., Tian, W., and Yoshiki, M.: Assessment of temperature, trace species, and ozone in chemistry-climate model simulations of the recent past, J. Geo-phys. Res., 111, D22308, doi:10.1029/2006JD007327, 2006. Funke, B., L´opez-Puertas, M., von Clarmann, T., Stiller, G. P.,
Fischer, H., Glatthor, N., Grabowski, U., H¨opfner, M., Kell-mann, S., Kiefer, M., Linden, A., Mengistu Tsidu, G., Milz, M., Steck, T., and Wang, D. Y.: Retrieval of stratospheric NOxfrom 5.3 and 6.2 µm nonlocal thermodynamic equilibrium emissions measured by Michelson Interferometer for Passive Atmospheric Sounding (MIPAS) on Envisat, J. Geophys. Res., 110, D09302, doi:10.1029/2004JD005225, 2005.
Giorgetta, M. A., Manzini, E., Roeckner, E., Esch, M., and Bengts-son, L.: Climatology and forcing of the quasi-biennial oscillation in the MAECHAM5 model, J. Climate, 19, 3882–3901, 2006. Glatthor, N., von Clarmann, T., Fischer, H., Funke, B., Grabowski,
U., H¨opfner, M., Kellmann, S., Kiefer, M., Linden, A., Milz, M., Steck, T., Stiller, G. P., Mengistu Tsidu, G., and Wang, D. Y.: Mixing processes during the Antarctic vortex split in September/ October 2002 as inferred from source gas and ozone distributions from ENVISAT-MIPAS, J. Atmos. Sci., 62, 787–800, 2005. Glatthor, N., von Clarmann, T., Fischer, H., Funke, B., Gil-L´opez,
S., Grabowski, U., H¨opfner, M., Kellmann, S., Linden, A., L´opez-Puertas, M., Mengistu Tsidu, G., Milz, M., Steck, T., Stiller, G. P., and Wang, D. Y.: Retrieval of stratospheric ozone profiles from MIPAS/ENVISAT limb emission spectra: a sensi-tivity study, Atmos. Chem. Phys., 6, 2767–2781, 2006,
http://www.atmos-chem-phys.net/6/2767/2006/.
H¨opfner, M., von Clarmann, T., Fischer, H., Glatthor, N., Grabowski, U., Kellmann, S., Kiefer, M., Linden, A., Mengistu Tsidu, G., Milz, M., Steck, T., Stiller, G. P., Wang, D.-Y., and Funke, B.: First spaceborne observations of Antarctic strato-spheric ClONO2 recovery: Austral spring 2002, J. Geophys. Res., 109, D11308, doi:10.1029/2004JD004609, 2004.
H¨opfner M., von Clarmann, T., Fischer, H., Funke, B., Glatthor, N., Grabowski, U., Kellmann, S., Kiefer, M., Linden, A., Milz, M., Steck, T., Stiller, G. P., Bernath, P., Blom, C. E., Blumen-stock, Th., Boone, C., Chance, K., Coffey, M. T., Friedl-Vallon, F., Griffith, D., Hannigan, J. W., Hase, F., Jones, N., Jucks, K. W., Keim, C., Kleinert, A., Kouker, W., Liu, G. Y., Mahieu, E., Mellqvist, J., Mikuteit, S., Notholt, J., Oelhaf, H., Piesch, C., Reddmann, T., Ruhnke, R., Schneider, M., Strandberg, A., Toon, G., Walker, K. A., Warneke, T., Wetzel, G., Wood, S., and Zan-der, R.: Validation of MIPAS ClONO2measurements, Atmos. Chem. Phys. 7, 257–281, 2007.
J¨ockel, P., Sander, R., Kerkweg, A., Tost, H., and Lelieveld, J.: Technical Note: The Modular Earth Submodel System (MESSy) – a new approach towards Earth System Modeling, Atmos. Chem. Phys., 5, 433–444, 2005,
http://www.atmos-chem-phys.net/5/433/2005/.
J¨ockel, P., Tost, H., Pozzer, A., Br¨uhl, C., Buchholz, J., Ganzeveld, L., Hoor, P., Kerkweg, A., Lawrence, M. G., Sander, R., Steil, B., Stiller, G., Tanarhte, M., Taraborrelli, D., van Aardenne, J., and Lelieveld, J.: The atmospheric chemistry general circulation model ECHAM5/MESSy1: consistent simulation of ozone from the surface to the mesosphere, Atmos. Chem. Phys., 6, 5067– 5104, 2006,
http://www.atmos-chem-phys.net/6/5067/2006/.
Mengistu Tsidu, G., Stiller, G. P., von Clarmann, T., Funke, B., H¨opfner, M., Fischer, H., Glatthor, N., Grabowski, U., Kell-mann, S., Kiefer, M., Linden, A., L´opez-Puertas, M., Milz, M., Steck, T., and Wang, D. Y.: NOy from Michelson Inter-ferometer for Passive Atmospheric Sounding on Environmen-tal Satellite during the Southern Hemisphere polar vortex split in September/October 2002, J. Geophys. Res., 110, D11301, doi:10.1029/2004JD005322, 2005.
Mengistu Tsidu, G., von Clarmann, T., Stiller, G. P., H¨opfner, M., Fischer, H., Glatthor, N., Grabowski, U., Kellmann, S., Kiefer, M., Linden, A., Milz, M., Steck, T., Wang, D.-Y., and Funke, B.: Stratospheric N2O5in the austral spring 2002 as retrieved from limb emission spectra recorded by the Michelson Interferometer for Passive Atmospheric Sounding (MIPAS), J. Geophys. Res., 109, D18301, doi:10.1029/2004JD004856, 2004.
Newman, P. A. and Nash, E. R.: The unusual southern hemisphere stratosphere winter, J. Atmos. Sci., 62, 614–628, 2005.
Sander, R., Kerkweg, A., J¨ockel, P., and Lelieveld, J.: Technical Note: The new comprehensive atmospheric chemistry module MECCA, Atmos. Chem. Phys., 5, 445–450, 2005,
http://www.atmos-chem-phys.net/5/445/2005/.
Sander, S. P., Finlayson-Pitts, B. J., Friedl, R. R., Golden, D. M., Huie, R. E., Kolb, C. E., Kurylo, M. J., Molina, M. J., Moortgat, G. K., Orkin, V. L., and Ravishankara, A. R.: Chemical Kinetics and Photochemical Data for Use in Atmospheric Studies, Evalu-ation Number 14, JPL PublicEvalu-ation 02-25, Jet Propulsion Labora-tory, Pasadena, 2002.
Sander, S. P., Friedl, R. R., Golden, D. M., Kurylo, M. J., Moort-gat, G. K., Keller-Rudek, H., Wine, P. H., Ravishankara, A. R., Kolb, C. E., Molina, M. J., Finlayson-Pitts, B. J., Huie, R. E., and Orkin, V. L.: Chemical Kinetics and Photochemical Data for Use in Atmospheric Studies, Evaluation Number 15, JPL Publication 06-2, Jet Propulsion Laboratory, Pasadena, 2006.
Solomon, S.: Stratospheric ozone depletion: A review of concepts and history, Rev. Geophys., 37(3), 275–316, 1999.
Spang, R., Remedios, J. J., and Barkley, M. P.: Colour indices for the detection and differentiation of cloud types in infra-red limb emission spectra, Adv. Space Res., 33, 1041–1047, 2004. Sparling, L. C.: Statistical perspectives on stratospheric transport,
Rev. Geophys., 38, 417–436, 2000.
Stiller, G. P., von Clarmann, T., Br¨uhl, Ch., Fischer, H., Funke, B., Glatthor, N., Grabowski, U., H¨opfner, M., J¨ockel, P., Kellmann, S., Kiefer, M., Linden, A., L´opez-Puertas, M., Mengistu Tsidu, G., Milz, M., Steck, T., and Steil, B.: Global distributions of HO2NO2as retrieved from observations of the Michelson Inter-ferometer for Passive Atmospheric Sounding (MIPAS), J. Geo-phys. Res., 112, D09314, doi:10.1029/2006JD007212, 2007. von Clarmann, T., Glatthor, N., Grabowski, U., H¨opfner, M.,
Kell-mann, S., Kiefer, M., Linden, A., Mengistu Tsidu, G., Milz, M., Steck, T., Stiller, G. P., Wang, D. Y., Fischer, H., Funke, B., Gil-L´opez, S., and L´opez-Puertas, M.: Retrieval of temperature and
tangent altitude pointing from limb emission spectra recorded from space by the Michelson Interferometer for Passive Atmo-spheric Sounding (MIPAS), J. Geophys. Res., 108(D23), 4736, doi:10.1029/2003JD003602, 2003.
Wang, D. Y., H¨opfner, M., Mengistu Tsidu, G., Stiller, G. P., von Clarmann, T., Fischer, H., Blumenstock, T., Glatthor, N., Grabowski, U., Hase, F., Kellmann, S., Linden, A., Milz, M., Oelhaf, H., Schneider, M., Steck, T., Wetzel, G., L´opez-Puertas, M., Funke, B., Koukouli, M. E., Nakajima, H., Sugita, T., Irie, H., Urban, J., Murtagh, D., Santee, M. L., Toon, G., Gunson, M. R., Irion, F. W., Boone, C. D., Walker, K., and Bernath, P. F.: Validation of nitric acid retrieved by the IMK-IAA processor from MIPAS/ENVISAT measurements, Atmos. Chem. Phys., 7, 721–738, 2007,