COLLEGAMENTI BULLONATI A TAGLIO DI ELEMENTI
TUBOLARI PER SCAFFALATURE: ANALISI NUMERICA
SHEAR BOLTED CONNECTIONS FOR TUBULAR RACKING
STRUCTURES: NUMERICAL ANALYSIS
Massimo Latour, Gianvittorio Rizzano University of Salerno Department of Civil Engineering
Salerno, Italy
[email protected] , [email protected]
Marina D’Antimo, Jean-François Demonceau, Jean-Pierre Jaspart,
University of Liege
Department of Architecture, Geology, Environ-ment and Costructions Liège, Belgium [email protected], [email protected],
ABSTRACT
The prediction of the shear resistance of connections as presently given in Eurocode 3, Part 1-8, cannot be applied in a straightforward way to the connection for tubular racking structures real-ized by means of long through bolts. In order to verify the possibility to extend the codified ap-proach to such joint configurations, in the present paper a finite element model with three-dimensional solid elements is established investigating the behaviour of the connections under shear load in a wide range of variability of the geometrical parameters. The validation of the nu-merical model has been performed starting from the results of experimental tests already per-formed by the authors at the laboratory on Materials and Structures of the University of Liège. Based on the finite element results, the load displacement curves for all the assemblies were suc-cessfully predicted evidencing the important role played by the hole’s geometry and reduced di-ameter of the bolts on the initial stiffness of the connections. The results of a parametric study by means of a calibrated FE model in Abaqus/CAE allowed to verify the possibility to extend the formulations provided by EC3 for predicting the bearing resistance of plates to these kind of con-nections and to analyze the influence of the main parameters governing the bearing resistance: the
distance e1 between the hole and the edge of the tube, the distance e2 between the hole and the
lateral edge of the plate composing the tube section and the thickness t of the tube.
SOMMARIO
La previsione della resistenza delle unioni a taglio codificata nell'Eurocodice 3, parte 1-8, non può essere applicata in un modo diretto ai collegamenti di strutture tubolari per scaffalatura realizzati
mediante bulloni lunghi passanti. Al fine di verificare la possibilità di estendere l'approccio codi-ficato a tale tipologia di collegamenti, nel presente lavoro viene messo a punto un modello agli elementi finiti con elementi solidi tridimensionali da impiegare per l’analisi del comportamento delle connessioni a taglio al variare dei parametri geometrici. La validazione del modello numerico è stata eseguita a partire dai risultati delle prove sperimentali effettuate dagli stessi autori presso il laboratorio materiali e strutture dell'Università di Liegi. Sulla base dei risultati degli elementi finiti, sono state simulate le curve carico-spostamento per tutti i collegamenti testati evidenziando l'importante ruolo svolto dalla geometria del foro e dal diametro dei bulloni sulla rigidezza iniziale dei collegamenti. I risultati di un’analisi parametrica sviluppata con un modello agli elementi finiti calibrato in Abaqus/CAE ha permesso di verificare la possibilità di estendere le formulazioni fornite dall’EC3 per la previsione della resistenza di unioni a taglio al caso delle connessioni in esame e di analizzare l'influenza dei principali parametri che governano
la resistenza: e1 distanza tra il foro e il bordo del tubo, e2 distanza tra il foro e il bordo laterale del
tubo e t lo spessore del tubo.
1 INTRODUCTION
Steel storage racks have reached nowadays a great diffusion, with applications going from small shelves to high racks for industrial buildings. In last years, design solutions in which the racking structure plays also the role of vertical structural elements of the whole building has been spread in practice, but when the size of the racks becomes significant, the structural analysis and the pre-diction of the overall behavior of the racking construction is not trivial.
The increasing competition in this field has spurred the companies to offer commercial solutions more economical by simplifying the connection details in order to reduce the fabrication and the assembly costs. Therefore, in alternative to the classical tab connection [1,2], in the case of tubu-lar storage racks, a more economical solution can be obtained by adopting shear connections with long through bolts [3].
This typology of connection, for design and check purposes, is not among the cases regulated by Eurocode 3 Part 1.8. In fact, the formulations provided by Eurocode covers the shear resistance of connections between two (or three) plates in direct contact with the bolt head or the nut, which creates a kind of “confinement” in the zone of the plate in direct contact with the bolts. On the contrary, in the case of tubular members, the inner face of the tubular profile is in contact with the long bolt but the nut is not in direct contact with the member face and local instability can occur. Therefore, it is important to understand if the formulations present in the current version of Euro-code 3 devoted to the prediction of the bearing resistance of plates can be applied also to the case of connections of tubular members of racking structures.
Also in the past the bearing resistance of bolted connections has been often investigated with the aim to extend the application of the EC3 rules to cases not covered by the code, such as the case of high strength steel [4,5] or stainless steel [6,7] or the case of the connection of cold formed strips and hot rolled steel plates [8]. The approach followed in this paper is similar to that provid-ed in [6,7], in which the accuracy of the application of the codifiprovid-ed approach to new cases is first-ly investigated by means of a parametric anafirst-lysis based on FE simulations calibrated on the re-sults of experimental tests.
To this scope, preliminary, in order to have an useful tool to describe the behaviour of these joints, a Finite Element Model was developed and validated through comparison with the experi-mental results already performed by the same authors [3]. Afterwards by means of FE model, the behaviour of the joints was investigated by analysing, first of all, the influence of the imperfec-tions on stiffness and resistance and then by carrying out a parametric study by varying the main geometrical parameters, influencing the resistance of the connection.
In this way, a comparison between the experimental values, the ones simulated by means of the FE model and the ones predicted with the Eurocode 3 formulation has been performed evaluating in a wide range of variability of the geometrical parameters the accuracy of the application of the codified approach to shear connections of tubular profiles.
2 EXPERIMENTAL INVESTIGATION
In order to properly calibrate a finite element model, reference has been made in the present paper to the experimental campaign performed by the same Authors [3,9,10].
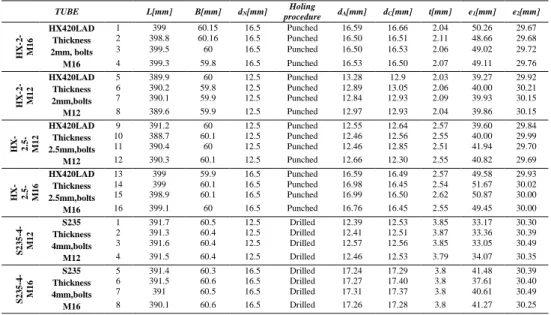
The experimental campaign developed at University of has been performed on 24 specimens with one tubular section fastened to two plates with one bolt (Fig. 1). The specimens are classified into six groups; each one is composed of four specimens nominally equal. The specimens were nu-merated and each side was classified with a letter (A to D). The bolts have not been preloaded. Two different materials were tested HX420LAD and S235. In Table 1 the material grades and the dimensions of all the specimens are given.
Fig. 1. Joint assembly
Table 1. Specimens’ geometrical and mechanical properties
TUBE L[mm] B[mm] dN[mm] Holing procedure dA[mm] dC[mm] t[mm] e1[mm] e2[mm] H X -2 -M 1 6 HX420LAD Thickness 2mm, bolts M16 1 399 60.15 16.5 Punched 16.59 16.66 2.04 50.26 29.67 2 398.8 60.16 16.5 Punched 16.50 16.51 2.11 48.66 29.68 3 399.5 60 16.5 Punched 16.50 16.53 2.06 49.02 29.72 4 399.3 59.8 16.5 Punched 16.53 16.50 2.07 49.11 29.76 H X -2 -M 1 2 HX420LAD Thickness 2mm,bolts M12 5 389.9 60 12.5 Punched 13.28 12.9 2.03 39.27 29.92 6 390.2 59.8 12.5 Punched 12.89 13.05 2.06 40.00 30.21 7 390.1 59.9 12.5 Punched 12.84 12.93 2.09 39.93 30.15 8 389.6 59.9 12.5 Punched 12.97 12.93 2.04 39.86 30.15 H X -2 .5 -M 1 2 HX420LAD Thickness 2.5mm,bolts M12 9 391.2 60 12.5 Punched 12.55 12.64 2.57 39.60 29.84 10 388.7 60.1 12.5 Punched 12.46 12.56 2.55 40.00 29.99 11 390.4 60 12.5 Punched 12.46 12.85 2.51 41.94 29.70 12 390.3 60.1 12.5 Punched 12.66 12.30 2.55 40.82 29.69 H X -2 .5 -M 1 6 HX420LAD Thickness 2.5mm,bolts M16 13 399 59.9 16.5 Punched 16.59 16.49 2.57 49.58 29.93 14 399 60.1 16.5 Punched 16.98 16.45 2.54 51.67 30.02 15 398.9 60.1 16.5 Punched 16.99 16.50 2.62 50.87 30.00 16 399.1 60 16.5 Punched 16.76 16.45 2.55 49.45 30.00 S 2 3 5 -4 -M 1 2 S235 Thickness 4mm,bolts M12 1 391.7 60.5 12.5 Drilled 12.39 12.53 3.85 33.17 30.30 2 391.3 60.4 12.5 Drilled 12.41 12.51 3.87 33.36 30.39 3 391.6 60.4 12.5 Drilled 12.57 12.56 3.85 33.05 30.49 4 391.5 60.4 12.5 Drilled 12.46 12.53 3.79 34.07 30.35 S 2 3 5 -4 -M 1 6 S235 Thickness 4mm,bolts M16 5 391.4 60.3 16.5 Drilled 17.24 17.29 3.8 41.48 30.39 6 391.5 60.6 16.5 Drilled 17.27 17.40 3.8 37.61 30.40 7 391 60.5 16.5 Drilled 17.31 17.37 3.8 40.61 30.49 8 390.1 60.6 16.5 Drilled 17.26 17.28 3.8 41.27 30.25
3 NUMERICAL MODELLING
3.1 Description of the developed FE model
In order to investigate the accuracy of EC3 formulation and to extend the results obtained through the experimental programme described in [3], a Finite element model has been developed in Abaqus software. The FE model, as reported in the following, has been used with two scopes: to analyse some interesting aspects of the bolt/hole interaction and to extend the experimental sam-ple by carrying out a parametric analysis.
Since the behaviour of the analysed connection is strongly affected by in-plane and out-of-plane deformations, by contacts between the bolt shaft and the hole and geometrical and by material non linarites, the FE model has been developed following a three-dimensional approach. The parts to be defined, in order to simulate the experimental tests previously reported, are three: the bolt, the tubular member and the thick plate used during the test to apply the load to the bolt as illustrated in Fig.2.
Fig.2. Parts and symmetry conditions
The geometry of these parts has been generated by adopting the modelling tools available in ABAQUS. In particular, the plate and the tube have been defined by extruding their cross-section, while the bolt has been defined by revolving half vertical section around its axis. In order to sim-plify the number of interactions to be introduced in the model, the bolt has been generated as a unique element together with the washer. The material properties of tubes and plates have been described by means of an elastic-plastic isotropic model by adopting simplified equivalent bi-linear or quadri-bi-linear true stress-true strain laws defined using the results from the coupon tensile tests. Conversely, considering the absence of the experimental data for the bolts, the behaviour of the material composing the bolts has been modelled using a simplified bi-linear model based only on literature data of strength and deformation.
Regarding the element type, eight-node bricks with full integration and first order approximation have been adopted (C3D8). Such elements, as also reported in [11], are particularly accurate for analysis where buckling effects are significant.
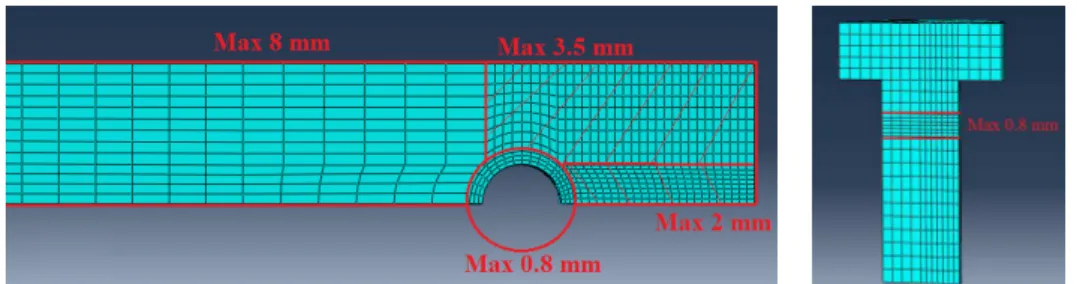
The mesh size of the elements composing the model has been defined after performing several preliminary analysis and by following some of the guidelines already available on the topic [12]. With the aim of reducing the computational effort, the number of elements has been increased only in areas where great stress gradients were expected. Therefore, in order to obtain accurate and stable results the following meshing procedures have been adopted:
the tube has been meshed choosing a maximum element size of 8 mm but, in the zone close to the hole and in the zone of the tube subjected to high stress concentrations a finer mesh has been defined. In particular, in order to improve the convergence of the model related to the complex contact phenomena arising at the bolt/hole interface, the hole has been modelled using elements with a maximum size of 0.8 mm and by defining at least six elements within thickness of the plate (Fig.3). The other zones of the plate have been meshed using elements with a size contained in between 2 and 4 mm;
the bolt has been meshed with a variable size for the elements in order to provide a finer mesh in the zone of interaction with the plate. In particular, in the interaction zone elements with a maximum size of 0.8 mm have been adopted, while in the other parts of the bolt a maximum size of 2 mm has been selected (Fig.3);
the loading plate, remaining essentially elastic, has been modelled with a larger mesh adopt-ing only two elements within the thickness of the plate.
Furthermore, all the parts have been partitioned in order to allow the definition of structured meshing techniques, leading in this way to stable results and good convergence of the model.
Fig. 4. Tube and bolt element size
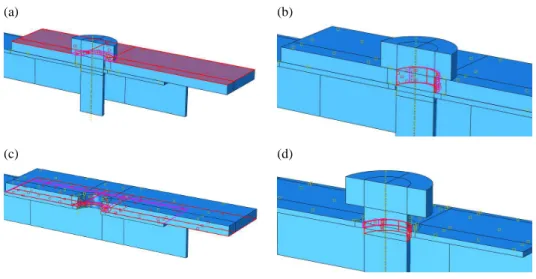
All the interactions between the different parts have been defined using the surface-to-surface contact formulation with finite sliding. In particular, four interactions have been defined (Fig.5): between bolt head and loading-plate (a), between bolt shank and plate hole (b), between upper surface of the tube and lower surface of the plate (c) and between tube hole and bolt shank (d). In the normal direction a “hard contact” has been used, while in the tangential direction a friction coefficient equal to 0.15 has been adopted according to EC3. In addition, as far as the bolt is typi-cally more rigid compared to the tube, in order to improve the convergence, it has been set as master surface, in the definition of the tube-bolt contact.
In order to reduce the computational effort, the model has been defined accounting for the sym-metry by defining appropriate boundary conditions.
(a) (b)
(c) (d)
Fig. 3. Interaction surfaces
Nevertheless, it is important to note that the tested specimens are not exactly symmetrical, be-cause one of the two holes is in contact with the threaded part of the bolt leading to an asymmet-rical loading condition.
The FE model has been analysed by means of a static non-linear analysis considering second or-der effects. In particular, the geometric non linearity has been properly accounted for in oror-der to grasp the typical buckling phenomena of the plate composing tube arising at high displacements.
3.2 Finite element results vs. experimental results
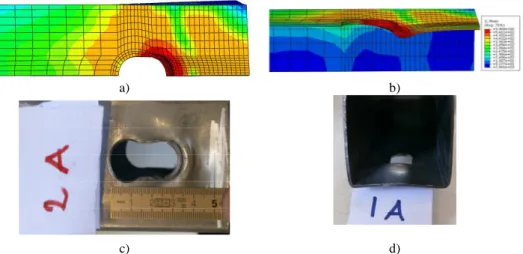
In order to analyse the role played by the geometrical imperfections of the holes on the behaviour of the analysed connections, two FEM models have been developed. The first one, defined ac-cording to the nominal geometry of the specimens and considering the nominal diameter of the bolt (in the following called “ideal”), the second one defined accounting for the geometrical im-perfections of the holes related to the manufacturing process and considering the net diameter of the bolt (in the following called “initial”). In particular, the second model has been realized con-sidering the maximum tolerance allowed by EN1090-2 for punched holes, i.e. +/- 0.5 mm for the average hole diameter calculated adding this maximum clearance to the measured diameter. As shown in Figs. 4 for example, the behaviour of all the tested specimens is accurately repro-duced by the FE models both in terms of deformed shape and in terms of failure mechanisms. In fact, the typical failure modes observed during the tests have been correctly simulated in all the analysed cases. In particular, two failure modes have been observed: the out-of-plane buckling of the plate and the bolt shear failure. In the first case, after a significant ovalization of the hole, the plate of the tube buckles exhibiting a significant out-of-plane deformation in the inner direction due to the constraining action provided by the loading plate (Fig.4c). This failure mode has been observed generally in tubes with a thickness lower than 2.5 mm. In the second case, due to the lower resistance with respect to the plate composing the tube, the bolt fails in shear before that a significant deformation of the hole arises. This failure mode has been observed generally in tubes with a higher value of the thickness. The results of the simulations obtained with the two models are reported in Fig.5.
a) b)
c) d)
Fig.4. Results series 1-4 HX420LAD. (a) Bearing in FE model; (b) Hole elongation at the end of
the test; (c) Local buckling in FE model; (d) Local buckling at the end of the test
Fig. 5. FEM vs Experimental 0 10 20 30 40 50 60 70 80 90 100 0 2 4 6 8 10 12 14 16 18 20 F [k N ] s[mm] HX-2-M16 (1-4) Experimental Tests Fem "initial" Fem "ideal" 0 10 20 30 40 50 60 70 80 0 2 4 6 8 10 12 14 16 18 20 F [k N ] s[mm] HX-2-M12 (5-8) Experimental tests Fem "ideal" Fem "initial" 0 10 20 30 40 50 60 70 80 90 100 0 2 4 6 8 10 12 14 16 18 F [k N ] s[mm] HX-2,5-M12 (9-12) Experimental tests Fem "ideal" Fem "initial" 0 20 40 60 80 100 120 140 0 2 4 6 8 10 12 14 16 18 20 F [k N ] s[mm] HX-2,5-M16 (13-16) Experimental tests Fem "ideal" Fem "initial" 0 20 40 60 80 100 120 0 1 2 3 4 5 6 7 8 9 10 F [k N ] s[mm] S235-4-M12 (1-4) Experimental tests Fem "initial" 0 20 40 60 80 100 120 140 160 180 0 2 4 6 8 10 12 14 16 18 20 F [k N ] s[mm] S235-4-M16 (5-8) Experimental Tests Fem "initial"
Furthermore, from the force-displacement curve reported in Fig.5, it is possible to observe also a difference in terms of stiffness and resistance of the two models. In fact, the “ideal” model pro-vides a significant overestimation of the initial stiffness and a good accuracy in predicting the re-sistance. Conversely, as it is possible to note from the comparisons, the “initial” model provides a very accurate prediction of the initial stiffness and a slight underestimation of the ultimate strength of 13% on average. The higher accuracy of the “initial” simulations in reproducing the stiffness of the experimental tests is mainly due to the ability of the model to account for the ini-tial imperfections of the holes. In fact, such imperfections, which are more significant in the case of specimens with punched holes, lead to stress concentrations providing a progressive plasticiza-tion of the plate in the contact zone, with a consequent loss of stiffness of the whole connecplasticiza-tion. However, from Fig.5 it is possible to observe also that the “ideal” model provides a good accura-cy in predicting the unloading/reloading stiffness of the experimental tests due to the elimination of the initial imperfection after the first loading phase.
In the following, in order to verify the accuracy of the current EC3 formulation for predicting the bearing resistance of such connection, additional simulation have been performed starting from the specimen HX-2,5-M16. As for this specimen both modelling provide the same resistance, the “initial” model, has been selected for developing the parametrical analysis which provided a good accuracy in predicting the overall experimental curve.
4 PARAMETRIC ANALYSIS 4.1 Identification of parameters
The bearing resistance of a bolted connection is mainly influenced by the material properties and
by the geometrical parameters e1, e2, d, d0 and t. In order to provide a further validation of the
EC3 formulation and to widen the ensemble of data obtained in the experimental analysis, in next
sections, the influence of parameters e1, e2 and t on the connection resistance is investigated by
employing the FE model previously calibrated. All the analysis reported in the following have been developed starting from the FE model HX420-2.5-M16, by varying the three considered ge-ometrical parameters one by one.
4.2 Influence of e1
The influence of parameter e1 has been investigated by setting in the FE model the hole size equal
to 16.5 mm, and performing eight simulations by varying e1 between 16.5 and 90 mm(e1= 90 mm
and e1/d0= 5.4; e1= 80 mm and e1/d0= 4.8; e1= 70 mm and e1/d0= 4,2; e1= 50 mm and e1/d0= 3; e1=
40 mm and e1/d0= 2.4; e1= 33 mm and e1/d0= 2; e1= 25 mm and e1/d0= 1.5; e1= 16.5 mm and
e1/d0= 1). The results of the simulation in terms of load-displacement curves for each value of
e1/d0, provided by the FE model are depicted in Fig.6.
From Fig.6, it is possible to observe that, as expected, the distance of the bolt from the free edge of the tube plate provides a significant influence on the joint bearing resistance. In particular, the
connection resistance increases for values of the e1/d0 ratio contained in between 1 and 3, while
for values higher than 3 it becomes constant. In fact, from Fig.6 it can be observed that for the analyses with distances of the bolt from the free edge equal to 90, 80, 70 and 50 mm the maxi-mum resistance achieved by the connection is approximately the same, while for lower values it rapidly decreases. This result appears in line with the EC3 formulation. In fact, according to EC3, the connection resistance is provided by the minimum value between the bolt shear resistance and the plate bearing resistance. For bolt shear resistance, EC3 provides the following formulation:
Fig. 6. Influence of e1: Force displacement curves.
where, fub is the bolt ultimate strength and A is the bolt shear area. Regarding the bearing
re-sistance, according to EC3, the following relationships have to be applied:
, = (2)
= 3 ; ;1 (3)
where, fu is the plate ultimate strength, d and d0 are the bolt and hole diameter, e1 is the distance of
the hole from the plate free edge and k is equal to 2,5 provided that the distance of the hole from
the lateral edge of the plate e2 is greater than 1,5d. These last equations, account for all the basic
failure modes normally arising in a simple bolted connection and, in particular, include tear-out failure, bearing failure and shear failure.
Therefore, in the range of values of e1 in which the resistance is governed by the bolt failure in
shear or by the plate shear failure, any dependence of the resistance by the parameter e1 is
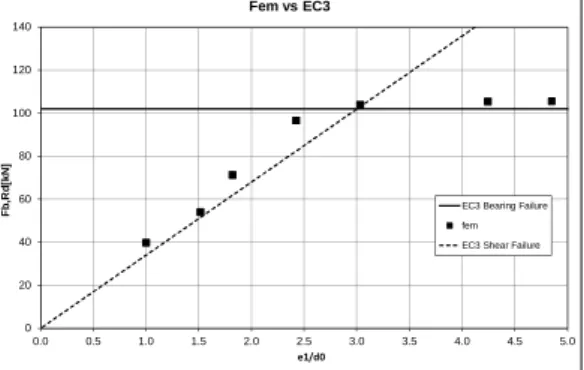
ex-pected. On the contrary, a linear dependence is expected when the collapse is governed by the bearing of the plate. In Fig.7 the application of the the design formulation provided by EC3 to the cases simulated in this section is represented. It is also possible to observe that the code is slightly conservative in the shear failure mode range, while it is very accurate in the bearing range.
Fig. 7. Influence of e1/d0 on the bearing resistance, accuracy of EC3 formulation 0 20 40 60 80 100 0 5 10 15 20 25 F [k N ] s[mm] Influence of e1 e1= 16.5 mm e1= 25 mm e1= 33 mm e1= 40 mm e1= 50 mm e1= 70 mm e1= 80 mm e1= 90 mm e1/d0=1 e1/d0=2 e1/d0= 3 e1/d0=2,4 e1/d0=1,5 e1/d0=4,2-4,8 e1/d0=5,4 0 20 40 60 80 100 120 140 0.0 0.5 1.0 1.5 2.0 2.5 3.0 3.5 4.0 4.5 5.0 Fb ,R d [k N ] e1/d0 Fem vs EC3
EC3 Bearing Failure fem EC3 Shear Failure
In addition, it can be also recognised that the boundary value separating the two failure mode ranges appears well predicted by EC3 formulation.
4.3 Influence of e2
The lateral edge distance e2 may be also a significant parameter affecting the joint failure.
Never-theless, in the case analysed in this work, a significant difference with respect to the classical case of a single plate is expected due to the presence of the lateral plates of the tube that work as
stiff-eners. Starting always from model HX420LAD-2.5-M16, the following three values of e2 have
been simulated: e2= 30 mm; e2= 20 mm; e2= 15 mm.
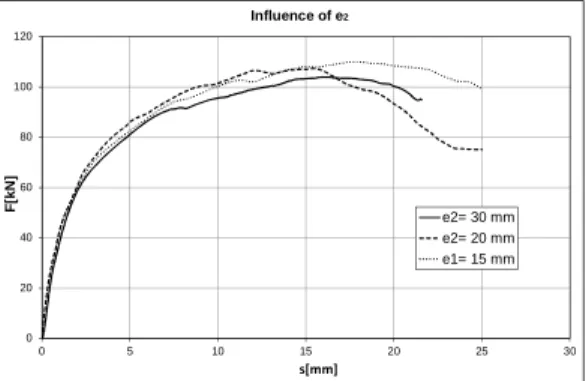
The force-displacement curves provided by the simulation of the above cases are delivered in Fig.8. From such a graph it is possible to observe that in all the three analysed cases the value of the ultimate resistance of the simulation is practically the same and also the failure mode is al-ways due to the bearing of the plate in a localized area.
Fig. 8. Influence of e2:Force-displacement curves
4.4 Influence of the thickness
Clearly, the thickness of the plate also plays a significant role on the resistance of the analysed connections. In fact, it is obvious that the increase of the thickness of the plate, leads to a progres-sive increase of the connection resistance up to the limit value provided by the resistance of the bolt in shear. Conversely, the decrease of the thickness of the tube leads to a decrease of the con-nection resistance with failure modes that are expected to progressively shift from the bearing failure of the plate due to the achievement of the ultimate resistance of the plate material, to the out-of-plane buckling failure mode. In the performed analysis, eight values of the thickness vary-ing in the range from 0.5 mm to 6 mm have been considered.
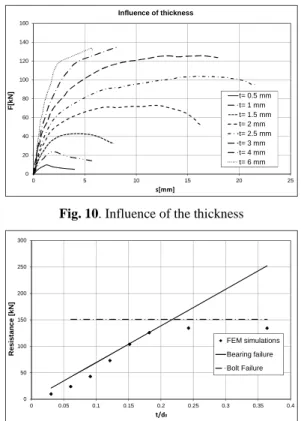
The results are represented in Fig. 9 in terms of stress distribution at failure for the two possible behaviour, i.e. low (Fig. 9a) or high thickness (Fig. 9b), and in Fig.10 in terms of force-displacement curves. The FEM simulations show that, for tube thickness higher than 3 mm the bolt failure arises. In fact, the ultimate resistance achieved in the simulations with plate thickness equal or greater than 3 mm is equal to about 135 kN which is slightly lower than the theoretical value provided by Eq. (1) which is equal to 150 kN.
This theoretical/simulation scatter is probably due to the bending moment arising in the bolt which is not taken into account by EC3 formulation. Conversely, for plate thickness smaller than 3 mm bearing failure arises.
0 20 40 60 80 100 120 0 5 10 15 20 25 30 F [k N ] s[mm] Influence of e2 e2= 30 mm e2= 20 mm e1= 15 mm
(a) t=1.5 mm (b) t=3 mm
Fig. 9. Influence of thickness, evolution from buckling to bearing behaviour
Fig. 10. Influence of the thickness
Fig. 11. Influence of thickness, accuracy of EC3 formulation
In Fig. 11 the resistance provided by the model is compared with that predicted according to EC3. In particular, in such a graph the FEM and EC3 resistance values have been charted versus the
t/d0 ratio. As expected, Fig. 11 highlights that the connection resistance is predicted with
suffi-cient accuracy by the code formulation only when the buckling phenomena are not significant.
In fact, for values of the t/d0 ratio higher than 0.15 the EC3 formulation provides an estimate of
the resistance quite accurate. In addition, in this range, EC3 code provisions are able to simulate with sufficient accuracy the failure mechanisms, which shifts from the bearing collapse (for
t/d0<0.18) to the bolt collapse (for t/d0>0.18). On the contrary, for values of t/d0<0.15, EC3
for-mulation provides an overestimation of the resistance due to the fact that, it does not account for 0 20 40 60 80 100 120 140 160 0 5 10 15 20 25 F [k N ] s[mm] Influence of thickness t= 0.5 mm t= 1 mm t= 1.5 mm t= 2 mm t= 2.5 mm t= 3 mm t= 4 mm t= 6 mm 0 50 100 150 200 250 300 0 0.05 0.1 0.15 0.2 0.25 0.3 0.35 0.4 R e s is ta n c e [ k N ] t/d0 FEM simulations Bearing failure Bolt Failure
the possibility of local buckling. As it is possible to note from Fig.11, such an overestimation can
reach more than the 50% for low values of t/d0. For this reason, as an advance of the present work,
the investigation of the buckling resistance of the tube could be performed in order to calibrate an appropriate coefficient able to account for the buckling phenomena when estimating the
connec-tion resistance of tubes with low values of the t/d0 ratio.
5 CONCLUSIONS
With reference to shear joints with long bolts passing through thin-walled tubular columns be-longing to racking structure in this paper the possibility to extend the EC3 rules to this kind of connections has been investigated by means of FEM analyses. The numerical analyses conducted with ABAQUS, have evidenced that the numerical model can accurately predict the ultimate re-sistance obtained through the conducted experimental test campaign if an appropriate mesh is used, while the prediction of the initial stiffness of the connection is strongly influenced by the hole’s imperfection and the actual bolt’s diameter.
The parametric study performed by means of the so-validated Abaqus FE model allowed to
rec-ognize that the distance e1 between the hole and the edge of the tube and the thickness t of the
tube are influent on the prediction of the connection resistance while the distance e2 between the
hole and the lateral edge of the plate composing the tube section is not significant in the examined case of tubular connections. In particular, the developed parametric analyses evidenced that in case of low value of tube thickness and hole’s diameter ratio a more accurate formulation for pre-dicting bearing resistance is advisable, by properly accounting the influence of the local buckling of the tube plate in contact with the bolt’s shank.
REFERENCES
[1] Bajoria K.M. and Sangle K.K., 2008. “Capacity based design of cold formed storage rack structures under
seismic load for rigid and semi rigid connections”, The 14th World Conference on Earthquake Engineering October 12-17, Beijing, China.
[2] Lewis GM, 1991. “Stability of Rack Structures”. Thin-Walled Structures 12 (1991) 163-174.
[3] D’Antimo M., Demonceau J.F., Jaspart J.P., Latour M. and Rizzano G., 2015. “Experimental investigation of shear bolted connections for tubular racking structures”, XXV CTA, Italian
Confer-ence on Steel Constructions, October 1-3, Salerno.
[4] Može, P. and Beg, D., 2011. “Investigation of high strength steel connections with several
bolts in double shear”. Journal of Constructional Steel Research, 67(3), 333-347.
[5] Puthli R., Fleischer O., 2001. “Investigations on bolted connections for high strength steel members”, Journal of Constructional Steel research 57 (2001), 313-326.
[6] Kiymaz G., 2009, “Bearing strength of stainless steel bolted plates in tension”, Nordic Steel Construction Conference, Marmo, 2-4 September.
[7] Salih E.L., Gardner L. and Nethercot D.A., 2011. “Bearing failure in stainless steel bolted connections”, Engineering Structures, Vol 33, 549-562.
[8] Chung K.F., Ip K.H., 2000. “Finite element modelling of bolted connections between cold-formed steel
strip and hot rolled steel plates under static shear loading”, Engineering Structures, Vol 22 (2000),
1271-1284.
[9] D’antimo M., 2015. “Numerical Investigation of innovative joints in storage racking structures”, Master Thesis, University of Salerno, 2015.
[10] Armenante V., 2015. “Analytical investigation of innovative joints on storage racking structures”, Master Thesis, University of Salerno, 2015.
[11] Bursi O. S., Jaspart J. P., “Calibration of a finite Element model for isolated bolted end-plate steel
connections”, Journal of Constructional Steel Research 44, 1997, 224-262.
[12] Selamenr S., Garlock M., “Guidelines for modeling three dimensional structural connection models
us-ing finite element methods”, International Symposium “Steel Structures: Culture & Sustainability, Paper No: