HAL Id: hal-02527311
https://hal-amu.archives-ouvertes.fr/hal-02527311
Submitted on 3 Apr 2020HAL is a multi-disciplinary open access archive for the deposit and dissemination of sci-entific research documents, whether they are pub-lished or not. The documents may come from teaching and research institutions in France or abroad, or from public or private research centers.
L’archive ouverte pluridisciplinaire HAL, est destinée au dépôt et à la diffusion de documents scientifiques de niveau recherche, publiés ou non, émanant des établissements d’enseignement et de recherche français ou étrangers, des laboratoires publics ou privés.
Techniques for characterizing the mechanical properties
of aerogels
Thierry Woignier, Juan Primera, Adil Alaoui, Florence Despetis, Sylvie
Etienne-Calas, Annelise Faivre, Laurent Duffours, Claire Levelut, Pascal
Etienne
To cite this version:
Thierry Woignier, Juan Primera, Adil Alaoui, Florence Despetis, Sylvie Etienne-Calas, et al.. niques for characterizing the mechanical properties of aerogels. Journal of Sol-Gel Science and Tech-nology, Springer Verlag, 2020, 93 (1), pp.6-27. �10.1007/s10971-019-05173-2�. �hal-02527311�
Techniques for characterizing the mechanical properties of aerogels
Thierry Woignier 1,2,* Juan Primera 3,4, Adil Alaoui 5, Florence Despetis 6 , Sylvie Calas-Etienne 6, Annelise Faivre 6 , Laurent Duffours 7, Claire Levelut 6, Pascal Etienne 6.
1 Aix Marseille Université, CNRS, IRD, Avignon Université, Institut Méditerranéen de Biodiversité et d’Ecologie marine et continentale (IMBE), UMR CNRS 7263, 13397 Marseille, France
2 IRD UMR 237-Campus Agro Environnemental Caraïbes-B.P. 214 Petit Morne, 97232 Le Lamentin, Martinique, France
3 Departamento de Fisica, FEC, LUZ, 4011 Maracaibo, Venezuela;
4 Escuela Superior Politécnica del Litoral (ESPOL) Facultad de Ciencias Naturales y Matemáticas, Departamento de Física, Campus Gustavo Galindo Km 30.5 Vía Perimetral, P.O. Box 09-01-5863, 090150 Guayaquil, Ecuador
5 Faculté des Sciences et Techniques de Tanger, B.P. 416, 90000 Tanger, Marroco;
6 Laboratoire Charles Coulomb, Université Montpellier , Place E. Bataillon, 34095 Montpellier Cedex 5, France
7 PrimeVerre , 34090, Montpellier
* Author to whom correspondence should be addressed; E-Mail: [email protected] Tel.: +33-596-42-30-34.
Abstract:
In this paper, we present the different characterization techniques used to measure the mechanical properties of silica aerogels. The mechanical behaviour of aerogels is generally described in terms of elastic and fragile materials (such as glasses or ceramics) but also in terms of plastic media in compression testing. Because of these very different mechanical behaviors, several types of characterization techniques are proposed in the literature. We first describe the dynamic characterization techniques such as ultrasounds, Brillouin scattering, dynamic mechanical analysis (DMA) to measure the elastic properties: Young’s modulus (E) , shear modulus (G), poisson ratio (υ) but also attenuation and internal friction.
Thanks to "static" techniques such as three-point bending, uniaxial compression, compression we also access to the elastic modulus (E) and to the rupture strength (σ). The experimental results show that the value of the elastic and fracture moduli measured is several orders of magnitude lower than that of a material without porosity.
With regard to the brittleness characteristics, Weibull's analysis is used to show the statistical nature of the fracture resistance. We also present the SENB (single edge notched beam technique) technique to characterize toughness (K1C) and the stress corrosion mechanisms, which are studied in ambient conditions and temperature by the double-cleavage drilled compression experiment (DCDC).
In the last part of the paper, we show how, during the isostatic compression test, aerogels behave like plastic materials.The data allow calculating the bulk modulus (K), the amplitude of the plastic deformation and the yield strength (σel), which is the boundary between the elastic and plastic domains.
These different techniques allow understanding which parameters influence the overall mechanical behavior of aerogels, such as pore volume, but also pore size, internal connectivity and silanol bounds content. It is shown that pore size plays a very important role; pores can be considered as flaws in the terms of fracture mechanics.
Keywords: aerogels; mechanical properties; elastic properties; toughness; Weibull statistic; stress corrosion effect, plasticity.
1. Introduction
In the last 50 years, silica aerogels have grown in interest in different areas ranging from applications as specific materials to the fundamental research [1-23].
Silica aerogels have peculiar physical properties: a large specific area, a very low sound velocity, a low thermal and electrical conductivity and a fractal microstructure [1-5]. These characteristics are mainly due to the very large pore volume and its structural complexity. This porous volume and porous features can be controlled during the synthesis of the alcogel [6, 7].
Aerogels can be utilized in numerous applications and they have first been used as catalysts or insulating materials (sound and temperature) [2, 8, 9, 10]. More recently aerogels are employed in the field of the environment [11-13], green haouse gazes captors [14, 15], pharmaceuticals [16, 17] but also in exotic applications such as cosmic dust and space debris sensors [21-23] or nuclear wastes containment materials [18-20]. Like any type of material for a defined application, knowledge of their mechanical properties is necessary.
However, in the literature, the authors generally do not measure the mechanical characteristics of synthesized aerogels, probably because of their low mechanical properties and their prominent fragility. Moreover, the determination of these low mechanical properties is not easy and requires specific experimental techniques and skills.
Generally, the microstructure of the aerogel is described as a highly porous network with a hierarchy (fractal) in the scale of length 5 to 100 nm. This structure is the result of an aggregation mechanism. Silica beads (≈ 1nm) built aggregates whose compactness is characterized by the fractal dimension Df [24-25]. In the case of the mechanical behaviour of porous media, a question is recurrent: how are macroscopic parameters such as mechanical properties influenced by the microstructure of the medium? We know that the macroscopic physical properties of porous media depend in particular on the volume fraction of each of the present phases (pores and solid phase) but also on the geometry of the microstructure [26, 27, 28].
In the literature, the elastic properties of aerogels are generally tested either by sound velocity measurements [1, 29, 30]) or by static techniques [31-34]. A consensus is accepted: silica aerogels are "fragile materials”, their mechanical characteristics are low due to the low connectivity and high porosity of the network. In so-called "fragile" materials, the stress-strain relationship evolves into a "catastrophic" fracture under a tension load. The resistance to rupture is strongly dependent on the presence of flaws, which act as stress concentrators [33-37]. The most relevant feature of fragile materials is the toughness [33-39] that characterizes the resistance to the flaw growth. The knowledge of rupture strength and toughness allows the calculation of the size of these flaws, responsible for the fracture. The theory of elastic linear fracture mechanics has been applied to measure
the toughness and flaws sizes in gels and the pores being considered as an integral part of the flaws responsible for the rupture [33, 34, 36].
It has been shown [40-42] that when an aerogel is subjected to a high compressive stress rather than a tension stress, an irreversible deformation is observed, characteristic of a plastic behavior. Mechanical behavior is no longer purely elastic and fragile. The volume contraction of the sample may be greater than 50%. This plastic deformation shows the complexity of the whole mechanical behavior: elastic and fragile in tension but elastic and plastic in compression.
In this review, we present various techniques to characterize the complete mechanical behavior of silica aerogels: elastic, fragile and plastic and different families of silica aerogels are studied (it must be noted that we do not present results on polymer crosslinked aerogels which were already studied in previous papers [43-44]).
In porous materials, the main parameters, controlling the mechanical properties are porosity or, in other words, density. The silica aerogels studied in this study come from four different synthesis methods to control pore characteristics and density.
1) The as received aerogels: alcogel are made from siloxane compounds (TEOS or TMOS ) hydrolyzed under neutral (distilled water) or basic conditions (10−2 M, NH4OH) and are transformed into aerogels by supercritical drying performed at 305 °C and 13 MPa [45]. Just after drying, aerogels are labelled “as prepared”. Depending on the alkoxides compound concentration, the bulk density has been adjusted in the range 0.05-0.35 gcm-3.
2) The composite aerogels: before the complete gelation, silica powder (aerosol soot) is added in the gelling solution in weight percent varying from 5 to 65% [24]. The composite gels are transformed into aerogels by supercritical drying (305 °C and 13 MPa). These composite aerogels samples covered density within the range 0.2 and 0.5 g·cm−3.
3) The sintered aerogels: to increase and control the porosity some aerogels can be sintered [46, 47]. A first thermal treatment at 350 °C for 12 h allows removing their surface organic radicals (labeled “oxidized aerogels”) and the sintering of silica aerogels proceeds by viscous flow carried out at higher temperatures (>1000 °C) [48,49]. Depending on the duration of the heat treatment, the pores collapse and the bulk density increases up to the density of the silica glass 2.2 g·cm−3. These sintered aerogels samples covered density within the range 0.3 and 2.2 g·cm−3 [46].
4) The compressed aerogels: another way to adjust the pore volume and bulk density is by compaction at room temperature, with time. The compaction of aerogel are is obtained by isostatic pressure with mercury [40-42] (see section 3). The compressed aerogels covered density in the range (0.1- 1.4 g·cm−3).
2) Characterization of elastic properties
Before describing the available techniques, it is necessary to specify that there are different elastic moduli: E : the Young’s modulus (related to longitudinal strain), G : the shear modulus (related to shear strain) or K: the bulk modulus (related to hydrostatic strain ). Because aerogels are considered as an isotropic network, these three elastic moduli are related together by the following expressions involving the poisson ratio ν: K= E/3(1-) and G = E/2(1+ νE/3(1-). Consequently, the knowledge of two of these four elastic features (E, G, K orE/3(1-) allows defining their complete elastic response.
The main measured elastic modulus is the young (E) modulus, which characterizes the longitudinal deformation of the material subjected to longitudinal stress. Young's modulus is a measure of the rigidity of a bar on its axis. In this case, it is equal to the stress applied divided by the resultant elastic deformation. To measure Young's modulus, we will describe the dynamic methods: ultrasound, Brillouin scattering and
mechanical spectroscopy. We also present static techniques such as three-point bending, uniaxial compression and indentation [19 – 21].
2,1) Dynamic techniques to determine elastic moduli
Apart from allowing the determination of elastic modulus, when a solid is submitted to vibration, a dissipation of energy can happen, often referred to as damping capacity or internal friction. Internal friction is defined as the mechanical energy dissipation of materials, measured by the energy dissipation, divided by the maximum elastic energy, during one cycle loading. Depending on the vibration frequencies, different techniques can be used as ultrasonic propagation, Brillouin scattering or low frequency mechanical spectroscopy.
2.1.1 ) Ultrasound
In the literature, the elastic behaviour is generally tested by ultrasounds measurements [1, 9, 29, 30, 50, 51-56]. The method often used to determine the velocity of sound in a material is to determine the delay of propagation between the faces of a sample in which a pulse wave propagates. An impulse is generated by an ultrasonic transducer and sent to a material plate sample. The time of flight within the sample is measured. Two methods are proposed in the literature. 1) The ultrasonic transducer serves as both transmitter and receiver; the impulse moves through the sample and is reflected on the opposite side. The sound velocity is given by the thickness multiplied by two and divided by the time of flight.
2) The configuration consists of two identical transducers (transmitter and receiver).
From the sound velocity of longitudinal waves (V), the density (ρ) and the Poisson’s ratio (ν), one calculates Young’s modulus E using the relation: E = ρV2 (1−2ν)(1+ν)/(1−ν). Generally, ν is considered to be close to 0.2 in silica aerogels [57]. In some specific set up, the transverse sound velocity (Vt) is also measured. In that case, the Young’s elastic modulus is determined from the bulk density (ρ) of the sample , the longitudinal (V) and transverse wave (Vt) velocities by E = (3ρV2 - 4ρVt2)/ ((V/Vt) 2- 1).
The shear modulus (G) is determined from the density of the samples and Vt by G = ρVt2 and the bulk modulus (K) was determined via K = ρ(V2 - 4/3Vt2), without any assumption on the υ value .
Moreover the knowledge of V and Vt allows to calculate υ: υ = (1- 2(Vt/V)2)/ (2-2(Vt/V)2)
Thus, in the following experiment, V and Vt measurements are made with a set of transducers (Panasonic V101, 500 kHz, Kadoma-Shi, Japan). Aerogels with a density of 0.1- 0.4 g.cm-3 were investigated in the frequency range 20 – 200 kHz using longitudinal and transverse resonance frequency transducers 500 kHz. The measurement configuration is shown in Figure 1. The distance between the transducers is about 30 mm .
Figure 2: Aerogels sound velocity (V) versus density
Figure 2 shows the evolution of V versus the bulk density. The data show the large increase in the sound velocity with the density of the aerogel. We note that for low-density aerogels, 0.1- 0.2 gcm-3, the longitudinal velocity (V) is lower than V in the air (≈ 300 ms-1).
From the sound velocity and assuming υ value close to 0.2 [57], we calculated the evolution of E versus the bulk density.
Figure 3 : Aerogels Young modulus (E) versus density
The figure shows that Young's modulus increases strongly with density and this evolution follows a power law such as E α ρ 3.6. This evolution in power law was observed by several authors and discussed in terms of cell models [58], percolation analysis [59], fractal approach [60] or blobs and links model [61].
2.1.2 ) Brillouin Scattering
The Brillouin scattering is well adapted to measure the sound velocity and attenuation in transparent materials like aerogels. Brillouin scattering is defined as inelastic scattering of light in a medium by thermally excited acoustical phonons. Brillouin scattering measures the frequency shift between the peak position of the laser excitation light and the position of the scattered Brillouin line. The position and width of the Brillouin line give access to the longitudinal sound velocity V and to the attenuation of sound α.
If the brillouin peak width (2 Γ) is small compared to the frequency shift B of the Brillouin peak, the attenuation α is given by α= 4π Γ/V where Γ is the half width at half maximum and the sound velocity is determined by a Lorentzian fit (as the position and width of the peak respectively), using V = λ B /2n, where n is the refractive index. For aerogels, n is deduced from the empirical formula [62], n = 1+0.21 ρ, ρ being the density in gcm-3. Fricke and co-workers [63] observed a linear relationship between refractive index and density. The slope is 0.221 and 0.193 before and after thermal treatment at 500 C°.These n values are in a good agreement with the previous empirical formula [62].
Brillouin spectrometry requires setups with high resolution, contrast, and luminosity, since Brillouin peaks are very close to the laser excitation, with typical shifts of 10–30 GHz, and very weak, about 10-10 times weaker than the laser line. On the other hand, a spectral range limited to a few GHz is required. Therefore, Brillouin spectrometers are usually multipass Fabry–Pérot (FP) interferometers. Multipass tandem interferometers, based on two-plane FP [64, 65] or a plane and a confocal FP [66, 67] in sequence, are used to fulfill the request of high contrast and resolution together with a sufficient spectral range.
In the following experience, Brillouin scattering measurements were performed using a Sandercock’s interferometer using two plane Fabry-Pérot in tandem used in 2x3 passes. The set-up is shown in figure 4. The incident light is an argon–ion Spectraphysics 2060 source in monomode use with operating wavelength λ= 514,5 nm. The sample is illuminated with a laser through a backscattering prism, the scattered light is collected around the prism, enters into the Sandercock interferometer and then is measured by a photomultiplier. The plane Fabry Pérot interferometers are used as scanning spectrometer. The contrast which means the ratio of maximum to minimum transmission is improved by the multipass use (6 passes in total improves the contrast of a factor of about 105). The use of the Fabry-Pérot in tandem increase the accessible frequency range by using two FP of unequal spacing, Sandercock’s trick is to use two interferometers whose scanning mirrors are mounted on the same scanning stage, with an angle such as cos is a ratio of integral number , for example cos =19/20. This trick increase the spectral range by a factor of 20 (the spacing of the two interferometers are synchronized and are in the ratio 19/20 so that the interference orders coincide on the 20th order). Thickness of the Fabry–Pérot interferometer was 35 or 20 mm so that the free spectral range is 4.3 or 7.5 GHz, with a resolution of about 80 and 150 MHz, respectively. Measurements were performed in backscattering geometry in order to achieve a good accuracy in the determination of the attenuation.
Figure 5 displays the evolution of the Brillouin spectra of sintered aerogels in the density range 0.31-0.6 gcm-3. The Brillouin line is shifted to higher frequency indicating the increase of sound velocity. The values of V and α were extracted from the spectra by least squares fit (Fig. 6). As expected, the sintering induces a continuous increase of sound velocity associated with a decrease of attenuation.
Sintering is a process by which the surface of a material is reduced by mass transport [12,22-24]. The aerogel network is described as an aggregates assembly (~ 50-200 nm). Aggregates can be fractal (Df =1.8-2.4), constructed by the aggregation of small particles (1-2 nm) [28]. Scattering data suggests that the sintering induced by viscous flow occurred through coalescence of small particles into larger ones. Df tends to 3, indicating an internal densification of the aggregates related to the coalescence of the particles. Local sintering increases connectivity across the material as a whole.
Figure 5 : Brillouin line evolution with the density for sintered aerogels. t=0 mn , ρ= 0.31 g.cm-3 (a); t=45 mn , ρ= 0.39 g.cm-3 (b) ; t=75 mn , ρ= 0.47 g.cm-3 (c) ; t=120 mn , ρ= 0.6 g.cm-3 (d)
Figure 6 : Change in sound velocity and attenuation with sintering time.
The knowledge of longitudinal velocity V and transverse velocity Vt by Brillouin experiments has allowed to calculate the Poisson ratio , = (1- 2(Vt/V)2)/ (2-2(Vt//V)2) for a set of as prepared and sintered aerogels in the density range 0.29-2.1 g.cm-3 . Table 1 shows that the mean value is almost constant close to 0.19±0.03, over this large density range and comfort the value 0.2 usually used for aerogel [32]. This result is important because if we assume that Poisson ratio is almost constant for the silica aerogels (around 0.2), the knowledge of sound velocity will allow to calculate the different elastic moduli E, G and K.
Bulk density (g.cm-3) Poisson ratio 0.29 0.21 0.32 0.17 0.32 0.21 0.33 0.21 0.35 0.17 0.38 0.16 0.41 0.24 0.43 0.17 0.83 0.19 2.1 0.21
Table 1: Poisson ratio for different bulk densities
Brillouin scattering has been also used to study the vibrational properties of fractal systems like silica aerogels [72,73]. The peculiar vibrational dynamics of these systems, with spatially localized vibrational modes is called “fracton”. In the literature, numerous papers [68-71] on Brillouin scattering discuss the aerogels acoustic properties and the “phonon- fracton crossover”, expected in fractal media.
2
.1.3 Mechanical Spectroscopy (Dynamic Mechanical Analysis DMA)The last dynamic method presented here is the mechanical spectroscopy also called Dynamic Mechanical Analysis (DMA). This technique consists in imposing a low frequency cycling stress 𝜎 (𝜔) = 𝜎 𝑠𝑖𝑛 𝜔𝑡 or strain 𝜀 (𝜔) = 𝜀 𝑠𝑖𝑛 𝜔𝑡 to the sample and in measuring the resulting strain 𝜀 (𝜔) or stress 𝜎 (𝜔) , which depend on how much the materials response lags behind the input , i.e. on the phase angle :
𝜀 (𝜔) =𝜎
𝐸 𝑠𝑖𝑛 (𝜔𝑡 − 𝛿) 𝜎 (𝜔) = 𝐸𝜀 𝑠𝑖𝑛 (𝜔𝑡 − 𝛿)
These relationships are used to derive trigonometric equations that allow determining the complex elastic modulus, which is defined as the instantaneous ratio of the stress/strain:
𝐸∗(𝑖𝜔) = ∗( )
∗( )= 𝐸 + 𝑖 𝐸" and 𝑡𝑎𝑛(𝛿) = "
The inphase response corresponds to the elastic modulus (or storage modulus, E’ or G') and the imaginary response to the viscous modulus (or loss modulus, E” or G''). The damping coefficient tan (δ) is obtained by dividing the viscous stiffness by the elastic stiffness and is consequently proportional to the ratio of energy dissipated to energy stored. In addition, all these characteristics can be measured as a function of temperature, frequency or time.
These very sensitive measurements have been used for studying the processes by which structural features such as point defects, dislocations, interfaces and second phases contribute to energy dissipation in pure metals and their alloys, ceramics, glasses or polymers [74]. Different works in literature have also evidenced that cracks generation leads to a decrease of elastic modulus and an increase of internal friction, i.e. an increase in the dissipated energy [75].
As it will be described in section 3, isostatic compression of silica aerogels allows densification of these highly porous materials. Surprisingly, at the onset of compression, an unexpected decrease of the bulk modulus K is measured in ‘as-prepared’ samples, followed by a more classical increase of K with densification [41]. An unusual mechanical behavior has also been observed when aerogels are uniaxially compressed: they become less stiff and the sound velocity is lowered [1,76]. This low density non-linearity was explained by a 'knee model' which makes use of the fact that highly porous aerogels are composed of chain- or bar- like structures that can bent like knees [76-77]. The longer the bars or chains are, the easier they can be bent, which is assumed the cause of the observed density dependence of the elastic non-linearity.
In order to go deeper in the analysis and interpretation of the physical mechanisms involved in the first steps of densification under isostatic compression, measurements of the dynamical mechanical properties of low density aerogel is interesting, especially the measurement of the internal friction.
In order to measure both elastic modulus and internal friction using a dynamic mechanical analyser Perkin Elmer, base catalyzed aerogels cylinders with a 5.8 mm diameter and a 30 mm height were initially prepared and densified under pressures ranging between 0.1 and 14 MPa, in an Hg porosimeter as described in [78]. The dynamic mechanical measurements were performed using a standard three points bending configuration (see figure 7) on compressed aerogel samples (20 mm). A static force (~100 mN) was used to hold the sample in place, while a oscillating load (of maximum amplitude ~80 mN) at a fixed frequency (between 0.1 and 10 Hz) were applied at room temperature. The resulting deflection of the cylinders was usually around 20 µm and always lower than 40 µm.
Figure 7: DMA schematic experimental set up
Young’s modulus E’ as measured by DMA at 1 Hz confirms that the irreversible densification of as received aerogels using isostatic pressure induces first a decrease in the values of elastic properties. E’ is plotted as a function of the densities of the compressed samples in fig 8. The minimum in the elastic modulus is associated with a maximum of the internal friction as also shown in fig 8. This indicates that the first steps of isostatic compression of ‘as-prepared’ aerogels is associated with decrease of the material rigidity probably due to the bending and rupture of the longest chains of the network. The associated increase in the internal friction might indeed be due to the energy dissipated by the damping of dangling bonds created by arms rupture. It has been shown that pressure induces a collapse of the porosity by a buckling phenomenon of tenuous solid parts of the gel located near largest pores [40,79]. Consequently, the longest solid chains of the network, which define the largest pores, break first and become closer increasing internal friction. Therefore, in the first steps of aerogel compression, internal friction increases and elastic and bulk moduli decrease due to damage development in the aerogel. At higher applied pressure, as densification proceeds, enhancement of the network connectivity happens, implying the further increase of elastic constants and decrease of the internal friction.
Figure 8: Change in the Young storage modulus E’ and internal friction tan (δ) with density for isostatically compressed aerogels.
2.2) Static methods to measure elastic moduli
2.2.1. 3-points bending technique For ductile materials (metal, polymers,..) young's modulus is commonly measured by a tensile test. The
samples are stretched on the vertical axis and E is calculated from the ratio of the applied stress to the measured deformation. However, for fragile materials such as glass, ceramics (and aerogels), the technique is not applicable because the fixation system weakens the samples locally and leads to erroneous results. For brittle fracture materials, E is consequently measured by a 3-point bending technique (Figure 9) [32, 80, 81].
Figure 9: experimental implementation of 3 points-bending measurements.
Young's E-modulus is then calculated using the relationships:
E
FL
D y
4
3
3 4
where D is the sample diameter, F the applied load inducing a deformation y, L is the span.
A previous study [32] highlighted the influence of the L/D ratio on the experimental results. If the L/D ratio is too small, the "measured elastic modulus" is a combination of the E and G, the shear modulus. A L/D ratio greater than 10 is necessary to correctly measure E. Therefore, we have prepared samples with a diameter D = 5mm and a span equal to 70 mm. We used an Instron 1196 machine, the traverse speed can vary from 10 μm/min to 100 mm/min. The load is measured using a balance whose platen remains in its original position, when loaded. This sensor records forces up to 4 N with a precision of 10 μN. The sample deformation is measured by a Eddy current sensor.
Figure 10. Evolution of E versus siloxane content for neutral (■) and basic aerogels (♦).
It is obvious that the low mechanical properties of aerogels are due to the large volume of pores that characterizes these materials. Therefore, the increase in density (decrease in pore volume) generally improves the mechanical properties of aerogels. A simple way to decrease pore volume is to increase the monomer concentration in the solution, or to sinter the material after hypercritical drying. Figure 10 shows the evolution
of E as a function of the siloxane content in the case of a neutral or basic catalysis. For the 2 sets of samples studied, E increases by almost an order of magnitude with the siloxane content. The data show that E of neutral aerogels is higher than that of basic samples, likely due to a better cross-linked structure and a higher density in the case of neutral aerogels [5, 6, 32].
Figure 11: E (●) evolution for sintered aerogels versus the bulk density.
As explained above, aerogels can be sintered into dense silica glasses by heat treatment close to 1000 °C [48, 49]. During these treatments, the microstructure of the aerogel is changed and the connectivity increases. Figure 11 collects the evolution of E as a function of the density increase induced by sintering. The main characteristic of these curves is the very strong E increase (104 – 105) in the density range explored.
With the decrease in porosity, the aerogel stiffens and the Young modulus of the material without porosity reaches the value of conventional silica glass (74 GPa). The reinforcement of the material is directly related to the decrease in pore volume, but also, at a given density, to structural changes. For example, the E-values of the sintered aerogels are higher than for neutral (or basic) aerogels with the same density [32]. We concluded that the heat treatment induced an increase in the connectivity or in the size of the necks between particles. New siloxane bonds increasing the connectivity and thus the stifness, replace organic species and silanol groups. Sintering reduces the entire volume of the sample by eliminating porosity [44, 47, 82] and increasing network connectivity
2.2.2 Uniaxial compression test
In this test, the samples are compressed on a vertical axis and the young modulus (EC), measured by this test, is calculated in the linear part of the curve using the following expression [83, 84].
Ec= 4F/ (πD2Δl/l o)
where F is the applied force, D the sample diameter, l the sample contraction and l0 the sample length. The uniaxial compression test obviously depends on the flatness and parallelism of the contact area. A micrometric sensor ( 0.1 μm) controls the flatness and parallelism of the two metal discs that compress the samples. The geometric conditions of the test are important. The ratio of the length l to the diameter D of the sample is a relevant parameter. In the literature, the elastic modulus of silica, resorcinolformaldehyde, and carbon aerogels were studied with an l/D ratio close to two [85]. In a first experiment in agreement with the experimental conditions described in the literature [85], the ratio l/D is close to two. Data show that the curve is linear, which proves the good proportionality between stress and deformation and the sample behaves reversibly (if the applied stress is not too high). [86].
We then measured the Ec values for diffrent aerogels under the conditions defined in the reference [85] and we show that Ec is lower than the E-value measured by the 3-point bending or ultrasound (Eac) test when measured on the same samples (table 2).
(g/cm3) E (MPa) EC (MPa) Eac (MPa) Ecor (MPa) 0.09 0.01 0.13 0.01 0.18 0.02 0.22 0.02 0.25 0.02 0.35 0.04 1.30 0.1 3.2 0.3 8.9 0.8 24 2 0.36 0.04 1.15 0.1 2.1 0.2 4.5 0.4 7.2 0.7 0.44 0.05 1.4 0.15 - 9 1 - 1.4 0.15 3.77 0.3 8.15 0.8
Table 2 : Comparison between EC , E ,Eac and Ecor
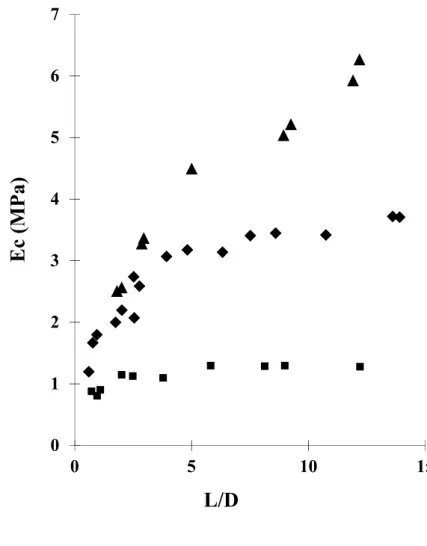
Fig. 12: evolution of the EC compared to the ratio l/D for 3 different aerogels 0.13 g.cm-3 (■), 0.18 g.cm-3 (♦) and 0.22 g.cm-3 (▲).
Moreover, figure 12 shows the strong influence of the l/D ratio on Ec. The different curves show an asymptotic trend, but the l/D corresponding to the constant value of EC is different for the three samples studied. For aerogel with a density of 0.13 g.cm-3, L/D is close to 2-3, 4-6 for aerogel of 0.18 g.cm-3 density and greater than 12 for the material of 0.22 g.cm-3density. This result confirms that the geometrical conditions using l/D equal to 2 leads to wrong Ec measurements. This gauge length dependence has been previously observed [87] and attributed to different factors, such as misalignment under axial compression, machine compliance and interfacing problems. As explained in reference [87], the following equation gives a linear dependence of the reciprocal apparent modulus on the reciprocal gauge length as:
Ec-1 = E
cor-1 + (lm/σ) l-1
Where Ec is the apparent compressive modulus and Ecor is the corrected compressive modulus. lm is the deformation contributed by the machine and is the stress. By extrapolating, the reciprocal apparent compressive modulus to zero reciprocal gauge length a corrected compressive modulus is calculated. We report in the last column in table 2 the corrected compressive modulus. These values are in a satisfactory agreement with E and Eac.The uniaxial compression test is easy to do and could allow measuring the Young's modulus of aerogels. However, this test requires constraining precautions (planarity and parallelism of the contact area). The important point is the choice of the ratio between the sample length and the sample diameter (l/D). Thus, several measurements with different l/D ratio should be performed on the same sample.
2.2.3 Depth-sensing indentation
Historically, indentation experiments were used to characterize hardness and toughness using print size or cracks length measurement after the test. The development of instrumented indentation testing machine, with very accurate load measurement as a function of penetration depth, is now allowing the determination of the different elastic and non elastic mechanical properties (plasticity, viscous effect, toughness) of materials. This technique has several advantages. At low depth, it is non-destructive and it requires only small sample machining prior to measurement (only a small flat and smooth surface). It can be used to investigate coating systems at a micrometric and sub-micrometric scale but it is also very useful to characterize the surface of bulk materials [96]. At higher penetration depth, damages can be monitored and analysed using accidents on the indentation curves to measure toughness and surface energy on bulk materials and interface adhesion too for coatings [97].
However, due to the extremely low stiffness of aerogels and to their brittleness, as well as the large surface roughness inherent to this class of materials, classical depth sensing indentation, also called nano-indentation is difficult and challenging for very low-density aerogels [88]. In this review, we present two specific cases, allowing to overcome these difficulties: one using very low forces less than 1 mN [97] which is possible with the ultra nanoindentation set up , and the second one, using spherical and flat punch indenter geometries resulting in large contact stiffness as well as measurements performed at large penetration depths [88]. 2.2.3.1 Ultra nano-indentation
Ultra-nanoindentation experiments are performed using CSM Instruments Open Platform using a Berkovitch indentor. Indentation sites are selected by optic microscopy (x500). The load range is from 25µN to 50mN with a resolution of 0.1µN. The displacement accuracy is 0.1nm.
In the nanoindentation technique, the force and displacement of a small probe, the indenter tip, are continuously monitored as the probe is loaded onto the surface of interest (Figure 13).
Figure 13: Classical nanoindentation curve, hf is the final indentation depth, hmax is the maximal indentation depth and hc is the contact depth between indentor and material at the beginning of the unload.
Different kinds of probes can be used. The Berkovich one (trigonal pyramid diamond) is commonly used because of its lowest tip radius (<100 nm) to perform high local stress level and to ensure a plastic flow. The loading part involves both elastic and inelastic behaviour. In the peculiar case of elasto-plastic materials, it can be described by the power law∶ 𝑃 = 𝐶ℎ [98, 99]. C is relevant to the indenter geometry and n depends on both geometry and Young’s modulus to hardness ratio during the loading. If there is no mechanical change during the experiment, C and n are constant.
The unloading part only accounts for elastic recovery. At the first stage of unloading, only elastic recovery is observed with a constant contact surface between the sample and the indenter. The Young’s modulus and hardness can then be extracted by the commonly used ISO 14577 standard [100,101]. The hardness (H) is calculated using the maximum force (P) and the following relation 𝐻 = where Ap is the projected surface contact area between the indenter and the sample.
The Young's modulus (E) of the sample can be obtained using the slope (S) at the beginning of the unloading curve according to the following relation 𝐸∗=√
√ where β is a geometrical constant depending
fact that elastic deformation occurs in both the specimen (Young modulus E, Poisson ratio ν) and the indenter (Young modulus Ei, Poisson ratio νi). E* is defined as [89-91]:
∗= +
For the diamond indentor used here Ei=1070 GPa and νi =0.07.
This technique has for example been applied to the characterization of composite silica-PVAc aerogels coatings in order to improve their resistance to impregnation. Silica-PVAc hybrid aerogels were prepared using a mixture of B33 silica sol and Poly Vinyl Acetate polymer at different PVAc ratio. Figure 14 shows the curve force versus indentation depth on a sample containing 20% PVAc and the obtained residuals prints after the experiment (insert).
Figure 14: Indentation curve for SiO2-20 weight % PVAc aerogel. Insert: image of indentation prints.
To obtain an accurate evaluation of the Young’s modulus and hardness, we have to prevent any densification of the aerogel under the indenter during the experiment. To find the maximal eligible load, we plotted the load curve in a log-log scale to calculate the power law coefficient, which should be constant for purely elasto-plastic behaviour. Figure 15 clearly shows that an increase is observed beyond a force of about 200μN.
Figure 15: Logarithm plot of the loading curve SiO2-20 w% PVAc aerogel
Thus, to avoid densification of the material that would distort the mechanical analysis, we made the choice to stop the indentation before this force.
The figure 16 shows the evolutions of the mechanical properties (elastic modulus and hardness) of the composite aerogels as a function of the PVAc amount. Each point is the contribution of 10 experiments. We used a constant value of ν = 0.2 for all the samples of this study [32].
Figure 16: Mechanical properties of SiO2-x w% PVAC aerogels
The elastic modulus and the hardness evolve in the same way: a rapid increase followed by stabilization beyond 5% in mass. The increase of the mechanical properties can be explained by a decrease of the pore volume related to the introduction of the polymer. The stabilization is rather related to a possible migration of a portion of the PVAc to the surface during CO2 supercritical drying.
2.2.3.2 Spherical and flat punch indentation:
To characterize the mechanical properties of low-density aerogels, spherical and flat punch indenters inducing large contact stiffness were used and measurements at large indentation depth were performed to limit the influence of the surface roughness. In order to precisely measure the displacement of the indenter, a dynamic depth sensing indentation technique using a universal testing machine (Instron 5500) was developed to overcome the difficulties associated with the optical detection of the surface of the material. The testing machine allowed controlling the displacement rate from 0.01 mm/min to 1000 mm/min. A loading cell with a maximum load of 2000g and with an accuracy of about 0.1 g, was used to measure the applied load. Both steel spherical and flat punch tips were used with respective radii of 3.1 mm for spherical shape and between 0.7 and 5 mm for flat punch. A video camera was also used to record the cracking and degradation of the sample during the tip penetration. Experiments were performed on transparent monolith cylinders of 35 mm in diameter and 18 mm high, as described in [92].
For the determination of the Young modulus, cycles of loading and unloading were performed on aerogels at room temperature in laboratory air and load-displacement curves were deduced. The elastic moduli were obtained using the following analytical elastic solutions [89-91]:
For a spherical tip [89] and assuming that the deformation under these very low loads is rather purely elastic:
𝐸∗= / ( ) /
with Pmax the maximum load applied on the tip before unloading, hmax the associated maximum penetration depth, hr the residual penetration depth after unloading (see Fig. 17). R is the radius of the spherical tip.
For a flat punch: 𝐸∗=
with P the total load on the punch, h the total depth of penetration of the punch and D the punch diameter. In both cases, the obtained elastic modulus E* is a global effective Young modulus accounting for the fact that elastic deformation occurs in both the specimen as defined in section 2.2.3.1.
The Young modulus values of aerogels being very low compared to the one of the indenter Ei, we assumed here that :
∗=
and we used a value of ν = 0.2 for all the aerogel samples analysed in this study [32].
Loading-unloading curves obtained using the spherical indenter evidence a good repeatability when cycles were performed (see fig13). The Young modulus values deduced from this curves do not change for hmax values up to 0.5mm, but they increase for higher indentation depth as can be seen in the insert on fig 17.
Figure 17 : Load as a function of indentation depth for three cycles of loading and unloading using the spherical tip with a constant tip displacement rate of 500m/min measured for an aerogel with a density of 0.128 g.cm-3. Insert: Young modulus values deduced from indentation measurements using a spherical tip, as a function the maximum penetration depth of the indenter.
For measurements using flat punch tip, in order to increase the reliability of the Young modulus values, cylindrical tips of different diameter D (D=0.7; 1; 3 and 5 mm) were used and the effective modulus E* was obtained as the coefficient of the linear regression of dP/dh versus D. An example is shown in figure 18 for an aerogel density of 0.07 g.cm-3.
Fig. 18 : Flat punch indentation load-displacement data obtained with a constant tip displacement rate of 500m/min for an aerogel with a density of 0.07 g.cm-3. Insert: estimation of the effective modulus E* as the slope of the variation of dP/dh versus the flat punch diameter.
The values of the Young modulus deduced from indentation measurements using spherical and flat punch tips are very similar for silica aerogels of different porosities and are also in good agreement with previous data published in the literature using 3 points bending [32, 93]. Large penetration depth (larger than 100 µm) indentation using large contact area tips is finally a particularly relevant technique for Young Modulus evaluation.
Apart from the characterization of the Young’s modulus, it is also interesting to better characterize the mechanical properties of aerogels under very large deformation and collapse under a tip. Silica aerogels are indeed potentially ideal candidate to capture fast moving particles in their ultraporous compliant structure and aerogel capture cells have been deployed in low earth orbit on a number of occasions [94-95].
In order to better understand the effects of a fast moving particle in an aerogel, some specific mechanical tests using penetration of an indenter at very large depth (several millimeters), were developed [92]. A flat punch with a diameter of 0.7 mm was used for these experiments and the maximum penetration depth was 5 mm. Flat punch penetration rates ranged between 0.5 and to 400 mm.min-1. It was shown that flat punch tip penetrates silica aerogels up to several millimetres and that a track is created in the sample surrounded by a series of pilled Hertzian cone cracks, as shown in the insert of fig 19.
Figure 19. Stress versus indentation depth for large depth indentation tests measured with a constant tip displacement rate of 10mm/min in aerogel of different densities (from 0.071g.cm-3 to 0.15g.cm-3). Insert are
optical images taken at the end of a penetration test with the punch still inside the standard for two aerogels whose density are 0.071g.cm-3 to 0.15g.cm-3.
The stress measured on the flat punch increases as a function of flat punch penetration (Figure19), and with the aerogel density. On can also observe some very clear incident points on the stress-displacement curves related to sudden drops of the stress. These incident points have been associated with the initiation of a Hertzian cone crack [92]. The higher the aerogel density, the larger the numbers of Hertzian cone cracks as a function of penetration depth. Moreover, the higher the aerogel density, the bigger the amplitude of the stress drop and the shorter the penetration depth of the first incident point.
Although all tests were stopped at a penetration depth of 5mm of the flat punch, the lightest aerogel does not break, during the experiment. These results consequently clearly indicate that the lower the density, the more compliant the aerogel to deep flat punch penetration. Very deep flat punch penetration tests can clearly help to understand the behavior of aerogels submitted to localized densification and collapse, like the one happening during the capture of fast moving particles.
2.3 ) Characterisation of brittleness properties
As previously explained in the introduction, aerogels behave like fragile materials. Thus, in addition to characterizing the elastic properties of aerogel, knowledge of rupture properties is important to know the limits of the loads that aerogels can withstand.
2.3.1) rupture or mechanical resistance modulus
The most usual mechanical properties characterizing the material resistance to a load are the rupture modulus also called mechanical fresistance. This characteristic corresponds to the maximum load before rupture.
The mechanical test (Fig. 9) used to measure the young modulus by 3-point bending techniques also allows calculating the mechanical resistance σ of the samples, using the relationships:
σ = 8F*L/ πD3
where D is the diameter of the sample, L, is the span, F * is the maximum load before rupture.
In the following experiment, the span L is 70 mm. We used an Instron 1196 machine because of its precise traverse speed. As in the case of the Young's modulus characterization (Cf. section 2.2.1), we are interested in the influence of the solid phase concentation in the aerogel on σ. It is possible to increase the concentration in solid phase by controlling the concentration in organosiloxane, or by sintering.
Figure 20. Evolution of σ versus the siloxane content for neutral (■) and basic aerogels (♦).
Figure 20 shows the evolution of the failure strength (σ) as a function of the percentage of siloxane in the case of a neutral or basic catalysis. For the 2 sets of samples studied, σ increased by nearly an order of magnitude with the siloxane content. As with the elastic modulus, measurements show that σ of neutral aerogels are higher than those syntetized in basic conditions due to a more cross-linked structure and a higher density [5, 6, 32].
Figure 21 collects the changes in the σ depending on the density produced by the sintering. The main characteristic of this curve is the very large increase of σ on the density range studied. The aerogel is strengthened and the mechanical strength of the fully dense material reaches those of conventional silica glass (95MPa).
The mechanical strength measured by 3 points-bending technique should characterize the average resistance of the aerogel subjected to a load. However, results show a large dispersion of σ values for the same sample. In so-called brittle materials, the σ-value is strongly dependent on the presence of flaws that act as stress concentrators [102-103]. A statistical analysis of σ results is required to explain the dispersion of data.
2.3.2. Weibull modulus and mean rupture strength.
For brittle materials, the broad scattering of the mechanical strength values is attributed to statistical nature of flaws. The sample strength distribution is usually analysed using Weibull’s statistical analysis [104]. For samples of identical dimensions, for which the effective volume is assumed constant, the failure probability is given by the relationship:
P P o m j ( )
exp
1 .The cumulative failure probability, Pj is calculated using the estimator [105]:
P
j
N
j
0 5
.
Where j is the order of the sample and N is the total number of samples. The Weibull's modulus, m, is a shape factor which characterizes the breadth of the strength distribution. o is a scale parameter characterizing the mean rupture strength.
Because of pore size change with the siloxane concentration, ac flaw distribution is suspected to change. Figure 22 shows the large scattering in the data due to the statistical nature of the mechanical strengths. On this figure is reported the experimental and calculated cumulated failure probability distribution function using the Weibull’s statistical analysis of a set of as received neutral aerogels with 18, 26, 33, 40 and 46 weight % of siloxane content.
Figure 22: Experimental and calculated cumulated failure probability distribution function, from left to right : siloxane content = 18 % (■), 33% (♦) and 46% (●).
Samples 18 % siloxane 26% siloxane 33% siloxane 40% siloxane 46% siloxane
m 4 5± 0.5 5.5± 0.5 6 ± 0.5 7± 0.5
0 80 175. 380 500. 720.Weibull modulus (m) and
0 deduced from the calculations for the different aerogels, are plotted in table 3 . The low value of m is characteristic of a large distribution of the measured value of the mechanical resistance. While m increases slightly (4-7), σ0 increases with the siloxane content. These results show that the critical defect sizes are probably less dispersed for aerogels with a high concentration, which corresponds to aerogels with a narrow pore size distribution.To go deeper in the analysis of a potential effect of pore size on the Weibull modulus, we measured the value of m on a set of composite aerogels. The literature [24, 106] shows that the addition of silica particles in the solution prior to gelling strongly affects the pore size and microstructure. Pore size distribution and fractal structure of composite aerogels evolve, with concentration, to a homogeneous, non-fractal porous material with a narrow distribution of pore size.
Table 4 shows the results of Weibull's analysis and as expected, for low concentration (CA0), the value of m is close to 3, which corresponds to a large flaw size distribution. When the particle concentration is greater than 40%, the value m is almost three times higher (8.5).
samples CA0 CA10 CA25 CA40 CA50 CA65 CA70
m 3± 0.5 3± 0.5 3.5± 0.5 8± 0.5 6.5± 0.5 7.5± 0.5 8.5±0.5
0 260 250 280 350 390 510 880Table 4: m and 0 data for the composite set
This result shows the correlation between pore size distribution and flaw size distribution and reinforced the idea that sample rupture would occur by the rupture of pores. [107].
2.3.3 Toughness (K1C)
As explained above the mechanical resistance is highly dependent on the presence of flaws, which act as stress concentrators. One of the most interesting features of brittle materials is their toughness, which characterizes the intrinsic ability of a material to resist to the flaw growth.
The linear elastic fracture mechanics applied to the gels [32-34] assumes that the fracture results from the stress concentration at the end of the flaws. Under uniaxial stress, a brittle material is characterized by a given value of the stress intensity factor KI that is given by:
I a
K
Y a
for an assumed straight crack of length 2a perpendicular to the loading direction, in an finite plane, having a uniform stress field σa.Y is a geometric factor depending on the location and the shape of the sample and of the flaw. The fracture occurs when the KI reaches the specific value, K1C (toughness), which is an intrinsic property of the material. The toughness of brittle materials is usually measured by the the Single Edge Notched Beam (SENB) technique (figure 23) [108-110]. The SENB method insure the introduction of sharp cracks with known dimensions.
Figure 23: Experimental set up SENB measurements.
The saw cut notch was performed using a diamond saw of 50 µm width. The notch depth, “a”, has a length in such a way that the ratio a/W was between 0.25 and 0.3, where W is the height of the sample (10 mm). W/l is chosen very close to 1/4 and l is the span. With this geometry [108], the value of KIC is given by the relation :
K1C = 3PlY√a/2W3
P is the load value at fracture ( the last load value recorded) and Y is a polynomial dimensionlessn function of W/l [108]. In this case :
Y= 1.93- 3.07(a/w) + 14.53 (a/w)2 -25.11(a/w)3 + 25.8 (a/w)4
The load application is carried out by means of an universal testing machine with load cell which measures forces ranging from 10 µN to 5 N. A crosshead speed of 500 µm/min has been chosen to prevent from the subcritical crack growth (see section 2.2.4).
.
Figure 24. Toughness evolution for the neutral (▲) and basic aerogels (■).
Figure 24 shows the evolution of KIC for basic and neutral aerogels, depending on the siloxane content. The increase in the toughness of the two series of materials is directly related to the increased siloxane content. As with E and σ, we note that the toughness of the basic samples is slightly lower than that of the neutral series.
Figure 25. Toughness evolution for sintered aerogels () versus the bulk density.
Figure 25 shows the evolution of KIC for sintered aerogels as a function of the bulk density. The reported values increase by a factor 1000 towards those measured on dense silica glass (0.7–1.5 MPa
m 0.5) [109].From the knowledge of the values of σ and KIC, the size of the critical flaw ac can be calculated [103, 108] from:
We have calculated that the ac values are in the range 80-700 μm and the general tendency is that ac decreases with the siloxane content. As previously suggested, a correlation exists between ac and pore size evolution. It has already been shown that when the siloxane content increases, the average pore size decreases and the pore size distribution curve shrinks. A previous study [25] showed that, for both sets of aerogels (basic and neutral), the macroporous volume decreases sharply when the siloxane content increases. We therefore observe that ac follows the size change of the larger pores (macropores). The critical flaw size data for the sintered aerogels show that ac is in the range 5 – 100 μm and decreases over the density range studied. In the literature, the macroporosity of the sintered aerogel was measured [28] during sintering: the macropoous volume is progressively reduced. We can therefore associate the decrease of ac during sintering to the decrease of the macroporous volume. For the different parameters studied (siloxane content and sintering), ac decreases when the macroporous volume decreases. However, the calculated ac values are much larger than the pore size; so critical flaws, which lead to rupture, are probably created during mechanical tests. The rupture occurs by progressively breaking bonds and thus associating a large number of macropores. Macropores bind to a macroscopic flaw (10-100 μm) and a catastrophic fracture occurs when the defect size becomes critical.
2.2.4. Sub critical propagation and Double Cleavage Drilled Compression experiment ( DCDC) The strength modulus and fatigue lifetime of vitreous silica decrease in humid environments [111,112]. Brittle materials actually can crack under a low tension load, when this load is maintained for a long time. This phenomenon means that the flaw size at the crack front increases with time when exposed to corrosive molecules of the surrounding medium. This slow crack growth, called stress corrosion phenomenon, can then limit their technological applications.
The Double Cleavage Drilled Compression experiment (DCDC) is a powerful technique to study crack propagation in transparent materials. This technique allows to obtain the V= f(KI) curve ( crack velocity versus stress intensity factor K1) which evidences three domains of which the first is relative to stress corrosion phenomenon [111,112,113]. More precisely, over a lower value of the stress intensity factor called KIi, the crack starts to propagate under the action of both stress and chemical species located at the crack tip. Cracks propagate slowly as a function of time and can undergo a complete breaking of the material if the KIC value is reached. This phenomenon induces that it is possible to calculate a lifetime prediction of the materials with a probability threshold [110].
The V=f(KI) curve in region I can be fitted under the form of an empirical relation [113]:
𝑉 = 𝐴𝐾
A and n being constants, n is called the chemical susceptibility factor which is usually used to describe stress corrosion behavior [113].
A model has been established by Wiederhorn, allowing analysing more precisely the humidity or temperature effects, on stress corrosion behaviours [111,116].
[
]
exp m I I I o K b Q p V A p RT VI is the crack velocity in region I, p the water vapor pressure, po the saturated water vapor pressure, KI the stress intensity factor and T the temperature. The parameters A and m are respectively a pre-exponential constant and the order of the reaction with water vapor as the reactant. b is a parameter which can be related to the activation volume and QI is the activation energy of the chemical reaction.
Like dense silica, monolithic silica aerogels can break spontaneously after several days or months because of residual low internal stresses. One can assume that this cracking originates from stress corrosion effects. Moreover, aerogels bring an original approach to the phenomenon because of their very large open porosity which can increase the accessibility of siloxane bonds at the crack front and trap corrosive molecules like water vapour in their porosity. Techniques such as Double Cantilever Beam (DCB) or Double Torsion (DT) commonly used for the KIC determination or stress corrosion studies, cannot be used with aerogels because of their very low densities. DCB requires tension stresses, which are not consistent with very low mechanical strength. DT uses larges plates, which give rise to sizing difficulties of the test samples. DCDC that consists in compression stresses on a parallelepiped sample can consequently overcome these difficulties and is then more efficient for brittle and soft materials as aerogels. It allows calculating the chemical susceptibility factor or parameters of the Wiederhorn equation quoted above.
We can note that n can also be obtained by dynamic fatigue experiments using a 3 points-bending equipment. However, this technique uses a very high numbers of samples and cannot allow a complete analysis of the stress corrosion phenomenon [110].
The DCDC experiment consists in a compression stress applied on the top of a sample containing a hole. Tensile stresses are then created at both the top and the bottom of the hole. The stress is gradually increased and maintained at a constant value p after the initiation of two symmetrical cleavage cracks from the hole (Fig. 1). The crack length c is measured versus time with an optical device and crack rate is then plotted as a function of KI.
The stress intensity factor, KI, may be computed from the crack length, c, thanks to the relationship [117]:
𝐾 = √
.
The chemical susceptibility factor is obtained directly from the slope of the curve V=f(KI) plotted in logarithmic scales. Experimental details have been reported in previous papers [118-120].
Fig. 26 : Double-Cleavage-Drilled-Compression geometry used for slow crack growth measurements.
One can note that the technique has numerous advantages: 1) The tensile stresses is applied in a purely open mode inducing an homogeneous stresses field around the cracks. 2) It leads to a controlled crack propagation whose speed decreases when the crack length increases. 3) Two cracks are easily initiated from a hole and propagate simultaneous in the heart of the material.
DCDC experiments show that silica aerogels exhibit a stress corrosion effect, which depends on their surface properties (hydrophobic for non-oxidized aerogels or hydrophilic for oxidized aerogels) [120].
Figure 27 highlights interesting results. Similar trends are obtained for as received and oxidized aerogels exhibiting two regimes behaviour in the stress corrosion domain. The chemical susceptibility factors are respectively 32 2 for KI for high-speed regime and 13 1 for KI <2.8 kPa m1/2 for the low speed regime. These results indicate that there are two different mechanisms associated with water induced crack growth. For high KI, the results are in good agreement (close n value) with those obtained in dense silica [121] but deviates for lower KI.
Other similarities have also been observed between oxidized aerogels and dense silica. The example of water vapour effect is also shown in fig 27 where KI–V curves shift to lower KI values when the relative humidity level decreases, contrary what is usually observed in dense glasses [122].
Fig. 27: Stress corrosion behaviour for oxidized and as received aerogels under different values of the relative humidity
3) Characterization of the plastic behaviour
The Hg porosimeter is generally used to estimate pore size distribution of porous materials. In the case of highly conpliant materials, such as aerogels, and materials with a very small pore size, mercury cannot penetrate into the porous structure. Previous studies [40-42] have shown that for aerogels, no Hg intrusion occurs because compression leads to a pore-scale below the instrument boundary (3.6 nm). In such experiments, as mercury cannot penetrate the pores, the aerogel is isostatically compressed. Pirard et al [40] showed that when the pressure is increased, the sample has a volume deformation directly related to its compressibility (see Figure 31) and the elastic modulus K (P) can be calculated using:
K (P) = − V (P) (dP/dV)
Where V and P are respectively the volume of the aerogel and the mercury pressure. σel is estimated from the limit of the linear part [41]as shown on figure 28.
Isostatic compression experiments were carried out using the Hg porosimetry (Carlo Erba Porosimeter 2000) on aerogel samples. The pressure of Hg can vary from 0.1 to 100 MPa. The samples were compressed at a given pressure at a rate of 1 MPa/min. If necessary, the irreversible shrinkage of the volume is accurately measured using a cathetometer, after pressure release.
Figure 28: volumetric deformation versus isostatic pressure by Hg porosimetry experiments
Figure 28 shows the typical curve of the relative volume shrinkage
𝛥𝑉/𝑉
versus P . When the applied pressure is lower than σel , the sample recovers its initial volume after the pressure release : the apparent shrinkage is completely reversible.However, figure 28 shows that when the applied pressure is greater than σel, the sample no longer recovers its initial volume after pressurization. The irreversible shrinkage of the volume (∆V/V0) pl characterizes the amplitude of the plastic deformation. The value of σel defines the boundary of the elastic range.
When a specimen undergoes a plastic deformation, its porosity decreases and its mechanical characteristics K and σel are changed. It is then possible to determine the new values K and σel for the compressed material, by performing a new measurement. Thus, from such "porosimetry experiments" the amplitude of the irreversible shrinkage and the associated evolution of the network connectivity K and σel change, are characterized (see fig. 29). Figure 29 shows that stiffening and reinforcement are important (10 times) over the pressure range (0.1-90 MPa). However, we must emphasize that during the first steps of densification K and σel show a slow decrease before starting to increase. This effect was correlated with a loss of network connectivity, confirmed by more precise measurements: sound velocity and acoustic attenuation studied by Brillouin diffusion [71], and internal friction measured by dynamic mechanical analysis [78] (see section 2.3.1 figure 8).
Plastic deformation increases with time at constant pressure. In addition, after releasing the pressure, the sample relaxs and the plastic deformation decreases over time. After one hour, 30 to 35% of the volume shrinkage is recovered. The relaxation effect was assigned to the disentanglement of the clusters constituting the porous structure [14]. This structural evolution takes time and is obviously pressure dependent. Taking into account these phenomena, we can determine the irreversible plastic deformation.
4 .Conclusions
As quoted in the introduction, silica aerogels present unique properties, which make them promising materials, but aerogels are also extremely brittle and friable which limits the applications potential. It is consequently very important to characterize their mechanical properties, although it is often challenging and implies the use of special set-ups. In this review, the main techniques described in the literature to measure the mechanical properties of silica aerogels have been sumed-up.
The mechanical properties of porous materials are obviously highly dependent on the porosity and because of the extremely large volume of pores in aerogels; their mechanical properties are several orders of magnitude lower than those of dense materials are. Aerogels are certainly the lightest solid material that has been produced and consequently the knowledge of their mechanical properties is very interesting from a theoretical point of view.
As described in this review, the porosity of aerogels can be tailored and the mechanical properties in relation with the structure and texture can be investigated experimentally over the entire porosity range (0% – 99%). The relationship between aerogels density or porosity is reviewed both for their elastic and brittle properties and the details of the experimental set-ups allowing to measure these properties is also described. And it is also shown that contrary to usual brittle materials, the porosity of aerogels lead to plastic behaviours. Because of the aerogel peculiar microstructure, it must indeed be noted that experimental techniques like Hg porosimeter (generally used to estimate pore size distribution) can be diverted to measure these plastic properties. In the same way, experimental techniques usually applied to measure the mechanical properties of materials like bending test have been successfully used to measure the alcogels and aerogels permability [123-125].
The techniques and results presented here concern only silica aerogels but they are obviously useful for other types of aerogels, organic, hybrids, composites, Zr02, Ti02, multicomponent aerogels, etc… and more generally for any type of highly porous medium.