A SHEAR STRENGTH MODEL FOR SHORT FRC COUPLING
BEAMS
Boyan Mihaylov
Assistant Professor of Civil Engineering, University of Liege, Belgium
Abstract:
Short coupling beams are susceptible to brittle shear failures that need to be suppressed with dense transverse and diagonal reinforcement. To reduce the amount of shear reinforcement and improve the service behavior, researchers have proposed a solution with steel fiber-reinforced concrete (FRC). However, while this solution is promising, there are no sufficiently simple mechanical models capable of capturing the shear strength of short FRC coupling beams without diagonal reinforcement. This paper proposes such a model based on first principles: kinematics, equilibrium, and constitutive relationships for the mechanism of shear resistance. The model accounts for five mechanisms of shear resistance across the critical shear cracks: diagonal compression in the critical loading zones, aggregate interlock, tension in the stirrups and steel fibres, and dowel action of the longitudinal reinforcement. These mechanisms are predicted and the results are compared to 15 tests from the literature. It is shown that the model captures well the effect of beam aspect ratio, concrete strength and amount of steel fibres. The average shear strength experimental-to-predicted ratio for the tests is 1.09 and the coefficient of variation is 5.0%.
Keywords: coupling beams, fibre-reinforced concrete, shear, kinematics.
1 Introduction
This paper focuses on the modelling of short coupling beams with clear-span-to-depth ratios smaller than about 2.5. Such members do not obey the classical plane-sections-remain-plain hypothesis (disturbed members, D-members) and are typically designed with strut-and-tie models. In addition, due to their large stiffness, they typically work with high shear stresses associated with double-curvature bending, and therefore require large amounts of stirrups and/or diagonal reinforcement. To reduce the shear reinforcement, researchers have proposed the use of fibre-reinforced concrete (FRC) (Canbolat et al. 2005, Yun et al. 2008, Kuang and Baczkowski 2008, Cai et al. 2016). However, while tests have indicated that this is a viable solution, the design of short FRC coupling beams using strut-and-tie models is still a challenging problem. This is mainly because the strut-and-tie approach neglects the tension in the concrete, while the main advantage of FRC is namely its enhanced tension behaviour. In addition, strut-and-tie models are not well suited for evaluation of deformations and displacement capacity which are key in the seismic design of coupled-wall structures. Therefore, there is a need for a displacement-based (or kinematics-based) approach which addresses these issues in a rational and computationally efficient manner.
A kinematics-based framework has already been developed for the modelling of various reinforced concrete (RC) D-members such as deep beams, short coupling beams, short walls (Mihaylov et al. 2013, 2015, 2016, Mihaylov and Franssen 2017a). The same framework is used here to incorporate the effect of steel fibres in short coupling beams and to evaluate the shear strength of such members. This approach consists of a simple kinematic model for coupling beams which describes the complete
deformation patterns of the member with the help of only two independent kinematic parameters (degrees of freedom). The paper discusses the formulation of the kinematics-based approach and compares its predictions with test results from the literature.
2 Kinematics of short coupling beams
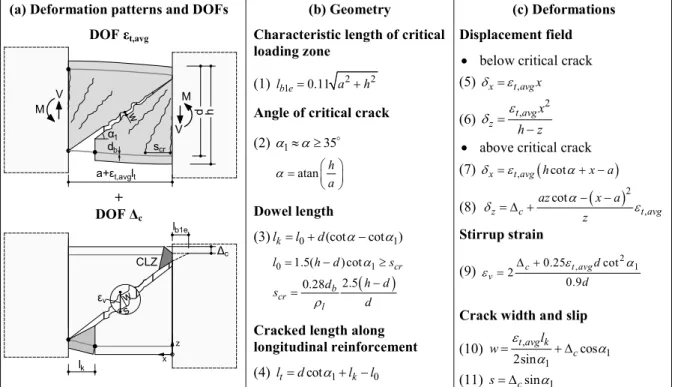
The deformation patterns of short coupling beams failing in diagonal tension are modelled with the kinematic model shown in Fig. 1. This model is adapted from earlier models developed for RC deep beams under double curvature (Mihaylov et al. 2015) and short RC coupling beams (Mihaylov and Franssen 2017a). It consists of two simple deformation patterns, each of which a function of a single degree of freedom (DOF). The failure is assumed to occur along a straight shear crack which extends along the diagonal of the coupling beam. It is also assumed that the load and reinforcement are symmetrical, and therefore the strains in the top and bottom longitudinal reinforcement are equal. The complete deformation pattern of the beam is obtained as a linear combination of the two simple patters.
Fig. 1 Two-parameter kinematic model for short coupling beams.
When the longitudinal reinforcement elongates with an average strain εt,avg, the critical crack opens as demonstrated in the top deformation pattern in Fig. 1a (crack width w). The regions above and below the crack are represented with fans of rigid radial struts which also open with increasing strain. As the struts are assumed rigid, this deformation pattern is controlled only by strain εt,avg which is the first DOF of the kinematic model.
While the deformation pattern controlled by DOF εt,avg can be associated with flexure, the second deformation pattern in Fig. 1a is associated with shear. In this pattern the critical crack undergoes both opening and slip displacements w and s associated with a vertical displacement Δc in the crack. Namely Δc is the second DOF of the kinematic model. In the ends of the critical crack Δc results in shear deformations along length lk and diagonal compressive strains in a critical loading zone (CLZ) where the concrete crushes at failure. The geometry of the CLZ is determined by its characteristic length lb1e
(a) Deformation patterns and DOFs DOF εt,avg
+ DOF Δc
(b) Geometry
Characteristic length of critical loading zone
(1) 2 2
1 0.11 b e
l a h
Angle of critical crack (2) 1 35 (2) atan h a Dowel length (3)lk l0 d(cotcot )1 (3) 0 1.5( )cot 1 2.5 0.28 cr b cr l l h d s h d d s d
Cracked length along longitudinal reinforcement (4) ltdcot1 lk l0
(c) Deformations Displacement field
below critical crack (5) xt avg, x (6) 2 , t avg z x h z
above critical crack (7) xt avg, hcot x a (8) 2 , cot z c t avg az x a z Stirrup strain (9) 2 0.25 , cot2 1 0.9 c t avg v d d
Crack width and slip
(10) , 1 1 cos 2sin t avg k c l w (11) s csin1 M V d h M V w α1 a+εt,avglt db scr w s εv Δc lb1e CLZ x z lk
and the angle of the diagonal of the coupling beam α. The expressions for lk, lb1e and α as well as the remaining geometrical properties of the kinematic model are summarized in Fig. 1b (Mihaylov et al. 2017a).
The assumptions and geometry of the kinematic model are used to derive the complete displacement field of the coupling beam based on small-displacement kinematics (Eqs. 5-8 in Fig. 1c). Therefore, the horizontal and vertical displacements of each point of the coupling beam are expressed as functions of εt,avg and Δc. More importantly, the two DOFs are used to express key deformations along the critical diagonal crack, i.e. stirrup strains εv, crack width w and crack slip s (Eqs. 9-11). These deformations are used to express the mechanisms of shear resistance across the crack, also as functions of DOFs εt,avg and Δc.
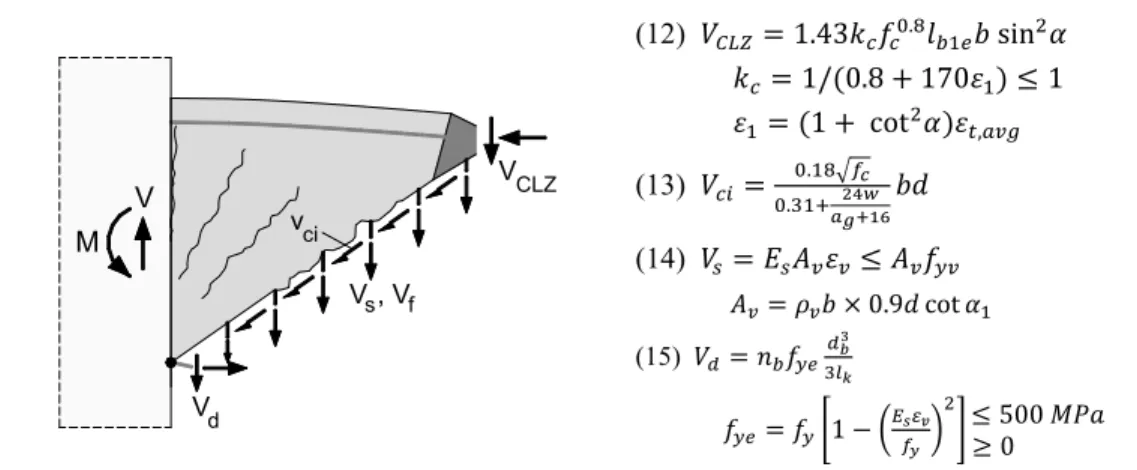
3 Mechanisms of shear resistance
There are at least five mechanisms of shear resistance which develop in short FRC coupling beams (Fig. 2). As characteristic of short members, a significant portion of the shear is carried in the critical loading zone where the concrete is subjected to diagonal compression associated with DOF Δc. In addition to shear component VCLZ, shear is also carried by aggregate interlock, Vci, tension in the stirrups, Vs, dowel action of the longitudinal reinforcement, Vd, and tension in the steel fibres across the critical diagonal crack, Vf. Component Vci depends mainly on the crack width, Vs on the strain in the stirrups, and Vd on strain εt,avg in the bar-dowels of length lk together with the transverse displacement Δc of the dowels. These four mechanisms have been derived elsewhere (Mihaylov et al. 2015) and are summarized in Fig. 2, while component Vf is discussed in more detail below.
(12) 𝑉 = 1.43𝑘 𝑓 . 𝑙 𝑏 sin 𝛼 𝑘 = 1/(0.8 + 170𝜀 ) ≤ 1 𝜀 = (1 + cot 𝛼)𝜀, (13) 𝑉 = . . 𝑏𝑑 (14) 𝑉 = 𝐸 𝐴 𝜀 ≤ 𝐴 𝑓 𝐴 = 𝜌 𝑏 × 0.9𝑑 cot 𝛼 (15) 𝑉 = 𝑛 𝑓 𝑓 = 𝑓 1 − ≤ 500 𝑀𝑃𝑎 ≥ 0
fc=concrete compressive strength; b=section width; kc=compression softening factor; ε1=principal tensile strain in CLZ;
ag=maximum diameter of coarse aggregates; Es=modulus of elasticity of longitudinal reinforcement; Av=area of stirrups;
ρv=stirrup ratio; α1=angle of critical crack; nb=number of top/bottom longitudinal bars; db=diameter of longitudinal bars.
Fig. 2 Mechanisms of shear resistance in short coupling beams.
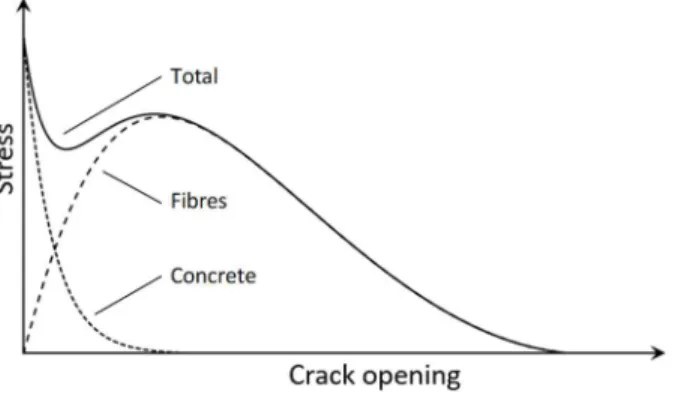
The tension behaviour of steel fibres across cracks has been studied extensively (Voo and Foster 2003, Lee et al. 2011 and 2013), particularly for the case of pure crack opening (Mode I fracture). It is now generally accepted that the relationship between crack opening and normal stress across the crack can be expressed as a superposition of two stresses (Fig. 3): tension transferred directly between the two crack faces (tension softening of concrete), and tension carried by the steel fibres (Voo and Foster 2003). As in the kinematic model the coupling beam is fully cracked, the tension softening is neglected and the tension in the fibres is expressed according to a variable engagement model proposed by Voo and Foster (2003): M V VCLZ vci Vs Vd , Vf
𝜎 = .
tan−1 / .
1 − (16)
where ρf is the volumetric ratio of steel fibres, lf is the length of the fibres and df is the fibre diameter.
Fig. 3 Tension behaviour of FRC (adapted from Voo and Foster 2003).
However, because in coupling beams the critical crack undergoes both opening and slip displacements (mixed Mode I and II fracture), shear component Vf is not governed only by the width of the crack w. Therefore, it is proposed to replace w in Eq. 16 with the vertical displacement in the crack wv which dominates the crack movement near shear failure. Displacement wv is expressed with the two DOFs of the kinematic model as
𝑤 = 0.5𝜀, 𝑙 cot𝛼 + Δ (17)
and the shear contribution of the steel fibres across the critical crack is
𝑉 = 𝜎 (𝑤 )𝑏𝑑/sin𝛼 (18)
As all mechanisms of shear resistance are expressed directly or indirectly with DOFs εt,avg and Δc, these DOFs need to predicted at failure in order to predict the shear strength V.
4 Shear strength predictions
To determine DOF Δc, it will be assumed that the shear failure of short coupling beams is triggered by the crushing of the critical loading zone. This important assumption is confirmed by experimental and analytical studies on deep beams and short coupling beams (Mihaylov 2015, Kwan and Zhao 2002). As the CLZ is at crushing, the strain along its bottom inclined face is assumed equal to -0.0035 if the strain in the longitudinal reinforcement crossing the CLZ is zero (εt,avg=0). Making also appropriate assumptions for the geometry of the CLZ, Δc has been expressed as (Mihaylov et al. 2015):
Δ = 0.0105𝑘 𝑙 cot𝛼 (19)
In this expression, as in Eq. 12 for VCLZ, factor kc accounts for the compression softening effect in the CLZ (Vecchio and Collins 1986). As the longitudinal reinforcement crosses the CLZ, the tensile strain in it damages the surrounding concrete, and therefore Δc decreases with increasing εt,avg.
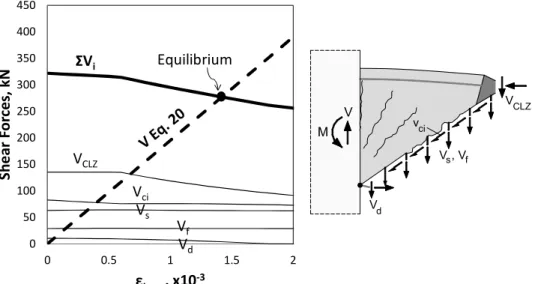
The derivations so far considered two sets of fundamental equations: compatibility of deformations (kinematics) and constitutive relationships for the mechanisms of shear resistance. To predict DOF εt,avg, it is also necessary to account for the equilibrium of the internal and external forces acting on the coupling beam. This is demonstrated graphically in Fig. 4 where on the horizontal axis is strain εt,avg
and on the vertical axis are the shear forces. For a given value of εt,avg, DOF Δc is determined from Eq. 19, and the deformations along the critical diagonal crack are obtained from Eqs. 9-10 and 17. In turn, these deformations are substituted in Eqs. 12-15 and 18 to determine shear components VCLZ, Vci, Vs, Vd, and Vf. The sum of the five components results in the shear capacity curve ΣVi in Fig. 4 (thick continuous line). As evident from the plot, the capacity decreases with increasing strain in the longitudinal reinforcement, and therefore short coupling beams exhibit strain effect in shear similarly to slender beams. This effect is explained mainly with the compression softening of the CLZ, and in some cases with the diminishing of aggregate interlock due to the opening of the critical crack.
Fig. 4 Solution of model equations applied to specimen 40-1-1 (Cai et al. 2016).
To determine εt,avg at failure, the shear capacity must equal the shear expressed from the tension in the longitudinal reinforcement. For simplicity, the reinforcement is assumed linear-elastic and the tension stiffening effect of the concrete around the reinforcement is neglected:
𝑉 = 2𝐸 𝐴 𝜀, (0.9𝑑)/𝑎 (20)
where EsAs is the axial stiffness of the reinforcement and 0.9d is the approximate lever arm of the longitudinal forces in the end sections. This shear force is shown with a thick dashed line in Fig. 4. Graphically, the solution of the equations of the proposed model lines at the intersection of the two thick curves where the shear forces are in equilibrium. The abscissa of the intersection point is the predicted strain at failure and the ordinate is the predicted shear strength. The calculations in Fig. 4 were performed for a FRC coupling beam tested by Cai et al. (2016), see beam 40-1-1 in Table 1. For this beam, the obtained shear strength experimental-to-predicted ratio is Vexp/Vpred=295/277=1.06. Similar calculations were performed for all 15 beams listed in Table 1. These tests allow for a systematic examination of three main variables on the shear strength of short FRP coupling beams: shear-span-to-effective-depth ratio a/d, concrete compressive strength fc, and, most importantly, the volumetric ratio of steel fibres. As evident from Table 1, the beams had an effective depth of 345 mm, a longitudinal reinforcement ratio of 1.21% and a stirrup ratio of 0.56%. The steel fibres were straight with a length of 32 mm, diameter 0.76 mm, and yield strength 380 MPa.
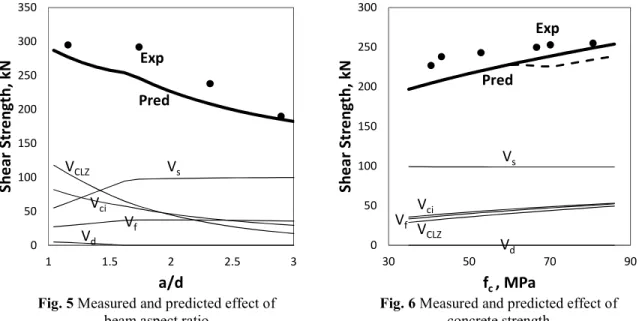
Figure 5 shows the measured and predicted effect of the a/d ratio on the shear strength. As can be expected, the experimental points show that the strength decreases significantly as the test specimens transition from a very short coupling beam with a/d of 1.16 to a slender beam with a/d of 2.90. The kinematics-based approach captures well this trend, even though it produces slightly conservative
0 50 100 150 200 250 300 350 400 450 0 0.5 1 1.5 2 Sh ea r F or ce s, k N εt,avg, x10-3 VCLZ Vci Vs Vf Vd Equilibrium ΣVi M V VCLZ vci Vs Vd , Vf
strength predictions. It can be seen from the predicted components of shear resistance that the strength reduction is due to the diminishing of shear components VCLZ and Vci. As a increases, the flexural strains εt,avg also increase, which results in higher compression softening in the CLZ and wider cracks with less capacity to interlock. In addition, as a increases and the critical crack becomes flatter, the CLZ becomes more slender with a smaller contribution to the shear strength. Flatter cracks are also associated with larger amounts of stirrups and steel fibres crossing the cracks, and therefore larger shear components Vs and Vf. The capacity of these components is limited however by the yield strength of the stirrups and the pull-out resistance of the fibres. According to the calculation presented in Fig. 5, the contribution of the fibres with a volumetric ratio of 1% varies from about 10% of the shear strength at a/d of 1 to about 20% at a/d of 3. It can also be seen that the dowel action contribution Vd is negligible across the entire range of a/d ratios.
The effect of concrete compressive strength is shown in Fig. 6. As in modern design practice of high-rise building it is not uncommon to use concrete strengths of up to 90 MPa, the experimental points are very instructive regarding the increase of shear resistance for high strength concretes. For this test series featuring a/d of 2.32, the shear strength increased by about 12% as the concrete strength was nearly doubled from 40.5 MPa to 80.7 MPa. As evident from the plot, the kinematic-based approach is slightly conservative for the lower concrete strengths and approaches the experimental results as fc approaches 90 MPa. The model predicts that shear components VCLZ, Vci and Vf increase in a very similar manner, while Vs remains constant and equal to the yield force of the stirrups crossing the critical diagonal crack. It should be noted that the model does not account for the fact that the cracks in high strength concretes propagate through the coarse aggregates, and therefore are smoother and with less capacity to interlock. This effect can be modelled by decreasing the maximum aggregate size ag in Eq. 13 from its actual value to 0 as the concrete strength increases from 60 MPa to 70 MPa (AASHTO 2007). The results obtained based on this approach are shown with a dashed line in Fig. 6.
Fig. 5 Measured and predicted effect of
beam aspect ratio Fig. 6 Measured and predicted effect of concrete strength
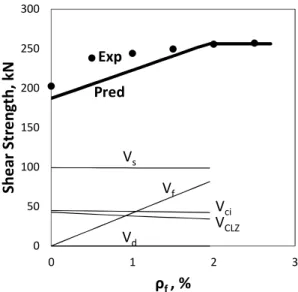
Figure 7 shows how the shear strength of coupling beams increases with increasing amounts of steel fibres. According to the experimental points, as the volumetric fibre ratio was increased from 0 to 2.5%, the shear strength increased by about 27%. The predicted shear strengths agree well with the test results at small and large volumes of fibres, and slightly underestimate the shear strength for intermediate volumes. It has been identified that this slight discrepancy is mainly due to the modelling of the compression softening effect which is based on an expression derived from shear panels without
0 50 100 150 200 250 300 350 1 1.5 2 2.5 3 Sh ea r S tr en gt h, k N a/d VCLZ Vci Vs Vf Vd Pred Exp 0 50 100 150 200 250 300 30 50 70 90 Sh ea r S tr en gt h, k N fc , MPa VCLZ Vci Vs Vf Vd Pred Exp
fibres (factor kc in Eq. 12). As evident from the predicted shear components, all shear contributions remain nearly constant except for the contribution of the fibres which increases linearly with ρf. The plateau of the prediction curve for ρf>2% is due to the yielding of the longitudinal reinforcement in the end sections. The load corresponding to this failure mode is estimated by accounting for the high shear in the end sections according to a model proposed by Mihaylov and Franssen (2017b).
Fig. 7 Measured and predicted effect of steel fibre volumetric ratio
Finally, to evaluate the overall accuracy of the proposed kinematics-based model for short FRC coupling beams, the shear strength experimental-to-predicted ratios for all 15 tests are listed in Table 1. As shown in the bottom of the table, these ratios have an average value of 1.09 with a coefficient of variation of 5.0%. These excellent results need to be confirmed as more test data becomes available.
Table 1. Specimen details and strength predictions (Cai et al. 2016).
Beam a/d mm d, mm b, % ρl, MPa fy, ρ% v, MPa fyv, MPa f c, ρ% f, mm lf, mm df, VkN exp, VkN pred VVexp/ pred 30-2-1* 2.32 345 150 1.21 363 0.56 296 40.5 1.0 32 0.76 227 205 1.11 40-2-1 43.1 238 208 1.14 50-2-1 52.9 243 220 1.10 60-2-1 66.7 250 226 1.10 70-2-1 70.1 253 225 1.12 80-2-1 80.7 255 234 1.09 40-1-1 1.16 345 150 1.21 363 0.56 296 43.1 1.0 32 0.76 295 277 1.06 40-1.5-1 1.74 292 246 1.19 50-2-0 2.32 345 150 1.21 363 0.56 296 55.6 0 32 0.76 203 185 1.02 50-2-0.5 54.5 0.5 238 188 1.08 55-2-1 54.8 1.0 244 204 1.17 50-2-1.5 55.9 1.5 250 222 1.10 50-2-2 55.3 2.0 256 242 1.03
Avg. (Vexp/Vpred.) = 1.09 with COV = 5.0%
* For brevity the name of beam CCB3-30-2-1FS is abbreviated as 30-2-1, similarly for the rest 12 beams from Cai et al. (2016).
a=clear span; d=effective depth; b=width of cross section; ρl=ratio of top/bottom longitudinal reinforcement; fy=yield strength
of longitudinal reinforcement; ρv=stirrup ratio; fyv=yield strength of stirrups; fc=compressive cylinder strength of concrete;
0 50 100 150 200 250 300 0 1 2 3 Sh ea r S tr en gt h, k N ρf , % VCLZ Vci Vs Vf Vd Pred Exp
ρf=volumetric ratio of steel fibres; lf=fibre length; df=fibre diameter; Vexp=measured shear force at failure; Vpred=predicted
strength.
5 Conclusions
This paper presented a rational kinematics-based approach for evaluating the shear strength of short FRP coupling beams. This approach uses only two degrees of freedom to capture the deformations along the critical diagonal cracks and the complete displacement field of the member. As the crack displacements were expressed explicitly, they were used together with an existing model for FRC to evaluate the shear strength contribution of steel fibres. By using 15 tests from the literature, it was shown that the model captures well the effect of beam aspect ratio, concrete compressive strength and amount of fibres on the shear strength of short FRC coupling beams. Additional tests and/or numerical simulations are needed to further validate the proposed model.
References
AASHTO, AASHTO LRFD Bridge Design Specifications, fourth edition, American Association of State Highway Officials, Washington, DC, 2007, 1526 pp.
Cai, G., Zhao, J., Degée, H. & Vandoren, B. (2016), Shear capacity of steel fiber reinforced concrete coupling beams using conventional reinforcements. Engineering Structures, Vol. 128, No. 12, pp. 428-40.
Canbolat, B., Parra-Montesinos, G. & Wight, J. (2005), Experimental study on seismic behavior of high-performance fiber-reinforced cement composite coupling beams. ACI Structural Journal, Vol. 102, No. 1, pp. 159-66.
Kuang, J. S. & Baczkowski, B. J. (2008), Steel-fiber-reinforced concrete coupling beams subjected to monotonic loading. Magazine of Concrete Research, Vol. 61, No. 1, pp. 35-41.
Kwan, A. K. H. & Zhao, Z. Z. (2002), Testing of coupling beams with equal end rotations maintained and local joint deformation allowed. Proceedings of the Institution of Civil Engineers: Structures and Buildings, Vol. 152, No. 1, pp. 67-78.
Lee, S.-C., Cho, J.-Y. & Vecchio, F.J. (2011), Diverse embedment model for steel fiber-reinforced concrete in tension: model development. ACI Materials Journal, Vol. 108, No.5, pp. 516-525.
Lee, S.-C., Cho, J.-Y. & Vecchio, F. J. (2013), Simplified diverse embedment model for steel fiber reinforced concrete elements in tension. ACI Materials Journal, Vol.110, No.4, pp.403-12.
Mihaylov, B. I., Bentz, E. C. & Collins, M. P. (2013), Two-parameter kinematic theory for shear behavior of deep beams. ACI Structural Journal, Vol. 110, No. 3, pp. 447-56. Mihaylov, B. I., Hunt B., Bentz E. C. & Collins, M. P. (2015), Three-parameter kinematic
theory for shear behavior of continuous deep beams. ACI Structural Journal, Vol. 112, No. 1, pp. 47-57.
Mihaylov, B. I. (2015), Five-spring model for complete shear behavior of deep beams. fib Structural Concrete, Vol. 16, No. 1, pp. 71-83.
Mihaylov, B. I., Hannewald, P. & Beyer, K. (2016), Three-parameter kinematic theory for shear-dominated reinforced concrete walls. Journal of Structural Engineering, Vol. 142, No. 7, pp. 04016041 1-14.
Mihaylov, B. I. & Franssen, R. (2017a), Three-parameter kinematic approach for shear behaviour of short coupling beams with conventional reinforcement. fib Bulletin – accepted.
Mihaylov, B. I. & Franssen, I. (2017b), Shear-flexure interaction in the critical sections of short coupling beams. Engineering Structures, Vol. 152, No. 12, pp. 370-380.
Vecchio, F. J. & Collins, M. P. (1986), The modified compression field theory for reinforced concrete elements subjected to shear. ACI Journal, Vol. 83, No. 2, pp. 219-231.
Voo, J. Y. L. & Foster, S. J. (2003), Variable engagement model for fibre-reinforced concrete in tension. Uniciv Report No. R-420, University of New South Wales, School of Civil and Environmental Engineering, pp. 86.
Yun, H.-D., Kim, S.-W., Jeon, E., Park, W.-S. & Lee, Y.-T. (2008), Effects of fiber-reinforced cement composites’ ductility on the seismic performance of short coupling beams. Magazine of Concrete Research, Vol. 60, No. 3, pp. 223-33.