Design and Analysis of a Battery Pack Enclosure for Formula SAE
by
Henry Merrow
Submitted to the Department of Mechanical Engineering in Partial Fulfillment of the Requirements for the Degree of
Bachelor of Science in Mechanical Engineering at the
Massachusetts Institute of Technology
June 2017
C2017 Henry Merrow. All rights reserved.
The author hereby grants to MIT permission to reproduce and to distribute publicly paper and electronic copies of this thesis document
in whole or in part in any medium now known or hereafter created.
Signature redacted
Signature of Author:... . ...
Department of Mechanical Engineering
Signature redacted
Certified by: ...Amos Winter Professor 4i Mchanical Engineering Thesis Supervisor
Signature redacted
C ertified by: ...
Rohit Karnik
MASSACHSETTINSTITUTE Associate Professor of Mechanical Engineering
Design and Analysis of a Battery Pack Enclosure for Formula SAE
by
Henry Merrow
Submitted to the Department of Mechanical Engineering on May 12, 2017 in Partial Fulfillment of the
Requirements for the Degree of
Bachelor of Science in Mechanical Engineering
ABSTRACT
This thesis documents the design and analysis of the enclosure for the high voltage battery pack which powers the Model Year 2017 MIT Formula SAE racecar. The battery pack is custom designed and built with six modules of 144 Samsung INR18650-25R lithium-ion cells each. Each component of the enclosure is analyzed to ensure structural integrity and optimized to reduce mass of the battery pack. The enclosure is able to secure the modules during sudden accelerations or decelerations from crash scenarios, allows for air flow to cool the cells, and allows for convenient serviceability of the modules. The final mass of the enclosure, at 8.5 kg,
results in an overall battery pack mass of 59.5 kg, 76% of the mass of the Model Year 2016 battery pack. All components of the enclosure have been manufactured, and the assembly process with the modules and high voltage electronics has been tested and verified.
Thesis Supervisor: Amos Winter
Acknowledgments
I would first of all like to thank Professor Winter for supervising this work. The FSAE
team is lucky to have him as an advisor, and his passion for cars as a true gear head is an inspiration.
I would next like to thank Elliot Owen and Luis Mora for consistently providing feedback
and guidance throughout the entire design and manufacturing process. Their excellent leadership on the FSAE team helped me to become a better engineer and a better team member. Thank you as well to everybody else on the FSAE team who participated in design reviews and helped out with the manufacturing process.
Finally, I would like to thank all of my friends and family who supported me this year and were always understanding when I devoted my time to this project and my other work instead of to them. Thank you all!
Table of Contents Abstract 2 Acknowledgements 3 Table of Contents 4 List of Figures 5 List of Tables 7
1. Introduction: Formula SAE and MIT Motorsports 8
2. Background: Batteries and Electric Powertrain Technology 8
2.1 Electric Powertrain Technology for High-Performance Vehicles 8
2.2 Battery Packs for High-Performance Electric and Hybrid Vehicles 9
3. Design 9
3.1 Design Overview 9
3.1.1 Functional Requirements 9
3.1.2 Module Design Overview 10
3.1.3 Enclosure Design Overview 11
3.1.4 Materials Considered 12
3.2 Design Details and Analysis 13
3.2.1 20g Downward Load Case 13
3.2.2 20g Upward Load Case 20
3.2.3 40g Longitudinal Load Case 28
3.2.4 40g Lateral Load Case 31
3.2.5 Perimeter Walls and Lid 36
4. Implementation 37
5. Conclusions and Future Work 39
List of Figures
Figure 3-1: Module design overview 11
Figure 3-2: Enclosure design overview 12
Figure 3-3: Base plate bending analysis - fixed ends and uniform load 13
Figure 3-4: Thicknesses of different materials required for uniformly loaded base plate 14 Figure 3-5: Normalized stress in uniform thickness plate vs. normalized length 15
Figure 3-6a: Example of plate with bowtie pocketing with bowtie illustrated 16
Figure 3-6b: Angled view of plate with bowtie pocketing 16
Figure 3-7: FEA model setup for comparison of uniform thickness plate and plate pocketed with
bowtie geometry 17
Figure 3-8a: Resultant stress profile in uniform thickness plate 17
Figure 3-8b: Resultant stress profile in plate pocketed with bowtie geometry 17
Figure 3-9a: Top side of base plate 18
Figure 3-9b: Bottom side of base plate 18
Figure 3-10: FEA model setup for base plate downward loading simulation 19
Figure 3-11: Results from FEA of maximum stress and deflection in the base plate vs.
thickness 19
Figure 3-12a: Stress results from FEA for the final base plate geometry 20 Figure 3-12b: Deflection results from FEA for the final base plate geometry 20
Figure 3-13: Upward loading on top restraining bars 21
Figure 3-14a: Required widths of the top restraining bars for different materials and numbers of
walls 22
Figure 3-14b: Required masses of the top restraining bars for different materials and numbers of
walls 22
Figure 3-15: Calculated maximum stress in walls vs. thickness 23
Figure 3-16a: FEA model setup for wall upward load case 24
Figure 3-16b: Stress results for wall upward load case FEA 24 Figure 3-16c: Close-up of stress results for wall upward load case FEA 24 Figure 3-17: Results from FEA of maximum stress in walls vs. thickness 25
Figure 3-18: CAD of top restraining bars 27
Figure 3-19a: Test piece for FR4 to aluminum bond testing 27
Figure 3-19b: Testing for FR4 to aluminum bond 27
Figure 3-20b: Close-up of polycarbonate bar and modules 28
Figure 3-21: Free body diagram for longitudinal load case 29
Figure 3-22: FEA model setup for longitudinal load case 30
Figure 3-23a: FEA results for longitudinal load case 30
Figure 3-23b: Maximum stress in rear side of polycarbonate bar for longitudinal load case 30
Figure 3-24: Free body diagram for lateral load case 31
Figure 3-25: FEA model setup for lateral load case 32
Figure 3-26a: FEA results for lateral load case 33
Figure 3-26b: Maximum stress from FEA results for lateral load case 33
Figure 3-27: Top view of a top restraining bar 34
Figure 3-28: Forces on top restraining bar for lateral load case 35
Figure 3-29a: FEA model setup for top restraining bar 35
Figure 3-29b: Mesh for top restraining bar FEA 35
Figure 3-30a: FEA results for top restraining bar 36
Figure 3-30b: Close-up of stress concentration from FEA results for top restraining bar 36
Figure 3-31a: CAD model of the walls and lid - front view 37
Figure 3-3 1a: CAD model of the walls and lid - back view 37
Figure 4-1: Assembled enclosure 38
Figure 4-2: Assembled enclosure with modules and HV electronics 38
Figure 4-3a: Lid with gasket installed 39
Figure 4-3b: Lid sealing screws 39
List of Tables
Table 3-1: Materials considered 12
Table 3-2: Summary of results for thicknesses, masses and deflections of uniformly loaded base
plate 14
Table 3-3: Mass of individual walls for 1 mm thickness 26
1. Introduction: Formula SAE and MIT Motorsports
Formula SAE is an international student design competition with numerous competitions held around the world each year. Student teams design and build an open-wheeled formula style racecar each year as if they have been contracted out to design a marketable and potentially profitable vehicle. There are dynamic events at the competition, which include a 22 km endurance race, a race on an autocross course, an acceleration run, and a skid pad event. There are static events as well, which consist of design, cost and business reports.
There are different categories in the competition for internal combustion engine cars, electric cars, and hybrids. The MIT Motorsports team currently competes in the electric category, after switching from internal combustion in 2013. The team embarked upon a challenging journey in switching to electric, and it took two years of learning before being able to successfully produce a running electric car in 2015. Since then, the team has begun to build on successful designs from previous years and steadily improve and optimize different parts of the car. A major focus of the
2017 car is the battery pack, as for the first time, the battery pack has been completely designed,
built and implemented by the team itself, instead of contracting the work out to a company. Starting from a blank sheet of paper, there has been nearly complete freedom with this project, with everything from cell selection to design of the pack enclosure. This work documents the design and analysis of all components of the battery pack enclosure, starting with the initial stages of idea generation through to implementation of the battery pack in the vehicle.
2. Background: Batteries and Electric Powertrain Technology
2.1 Electric Powertrain Technology for High-Performance VehiclesElectric powertrain technology is attractive for racecars and other high performance vehicles for a number of reasons. With an electric drive system, it is possible to achieve instant torque at the wheels when the driver steps on the pedal and maximum torque across a wide range of speeds, allowing for acceleration performance which can surpass that of internal combustion engine technology. There is also great opportunity with control schemes in electric vehicles to maximize performance, for example launch control and torque vectoring with multiple motors [1]. Additionally, flexibility with battery pack design allows for the center of gravity of the vehicle to be lowered, a significant advantage for vehicle dynamics. Vehicles such as the Tesla Model S, the
performance electric or hybrid vehicles which take advantage of these opportunities with electric powertrain technology to create vehicles with unprecedented performance.
2.2 Battery Packs for High-Performance Electric and Hybrid Vehicles
One of the fundamental components of an electric powertrain is the battery pack. The battery pack is the energy source for the vehicle, and for high-performance vehicles, it must supply energy to the vehicle at a very high power. The automotive environment is especially challenging for batteries, as the batteries are subject to a wide range of operating conditions. Thermal considerations are critical to safety and performance of battery packs [2], a challenge which is intensified in racecars because of the increased heat generation in batteries at high charge and discharge rates, which are necessary for high power output. Mechanical robustness is also a critical challenge, the battery pack must not only be able to withstand vibration and loads from normal driving conditions and accelerations and decelerations, but also maintain structural integrity in crash scenarios. This is especially important for safety, because impacting lithium-ion batteries can be extremely dangerous and cause catastrophic failure of the entire battery pack [2].
3. Design
An overview of the functional requirements and the actual design is first presented in this section, followed by detailed analyses of each structural component in the battery pack.
3.1 Design Overview
3.1.1 Functional Requirements
The first step in designing the battery pack enclosure was explicitly determining all of the functional requirements for the design, which are summarized in this section. First and foremost, the enclosure must comply with the competition rules presented by FSAE. There are many rules which affect the enclosure design, but the most significant rule is that the enclosure must be able to secure the modules when subject to the following accelerations: 40g longitudinally, 40g laterally, and 20g vertically. The applied load for these accelerations is equal to a 40g acceleration multiplied by the mass of the modules, and is to be applied at the center of mass of the modules. This requirement is intended to represent a sudden acceleration or deceleration from a crash scenario. Compliance with this rule is the primary requirement which has driven the design of the enclosure structure. Failure under these loading scenarios is defined as any of the structural
components of the enclosure yielding, i.e. when the von Mises stress in the material exceeds the material's yield strength. It is also desired that the maximum deflection under these loads is no more than 5 mm. Another requirement is that the enclosure must allow for air flow to cool the cells while preventing the intrusion of water into the pack. More specifically, the pack must pass a test in which water is sprayed down onto the pack from above for about two minutes. A soft requirement is that it should be possible to install or remove a single module in less than 10 minutes - a significant advantage of a modular design is that in the event of a faulty cell or a faulty module, it is possible to service the modules by removing them and inspecting them, and replacing individual modules if need be, without replacing the entire pack. Convenience of serviceability is important during the competition, in case any problems with the modules themselves need to be addressed. The enclosure must also contain all the necessary electronics for monitoring and control of the battery. Another important requirement is that the entire battery pack weigh no greater than
60 kg. As the modules and the high voltage electronics weigh approximately 51 kg in total, the
weight of the enclosure and structural components should be no greater than about 9 kg. A final critical requirement is that it be possible and feasible to manufacture or purchase all of the components of the enclosure assembly.
3.1.2 Module Design Overview
As the enclosure for the battery pack is built around the individual modules of battery cells, it is useful to provide a brief overview of the structural format and design of the modules. There are six modules in total in the battery pack, each containing 144 cells in a 12 by 12 format, with 12 cells in series and 12 in parallel. The cells are arranged in a triangular grid pattern and are glued to machined sheets of polycarbonate which house the cells. Each module weighs approximately 8
Figure 3-1: CAD showing the module design. The cells are glued to polycarbonate
sheets which form the major structure of the modules. Because the cells are essentially steel cylinders, the module itself is very stiff.
3.1.3 Enclosure Design Overview
The relevant components of the final enclosure design are shown in figure 3-2. An aluminum base plate forms the primary structure of the battery pack and attaches to the frame with twelve bolts. To secure the modules during vertical accelerations, there are six top restraining bars bolted to four inner FR4 walls, which are bonded to the base plate in slots. During longitudinal and lateral accelerations, the modules are secured by polycarbonate restraining bars in front of and behind the modules, and the top restraining bars exert a downward force to secure the modules and avoid rotation. Bent sheet metal forms the perimeter walls and lid of the enclosure. The high voltage electronics for the battery pack are situated in the section of the enclosure in front of the modules, and the high voltage wires attach at the open rectangle in the front left of the enclosure. The design process and detailed analysis of all of the individual components is presented in the following sections.
inner FR4 walls top restraining bars
sheet metal walls
forward polycarbonate restraining bar
Figure 3-2: CAD of the enclosure design, showing the modules installed. The major
components are a machined aluminum 7075 base plate, polycarbonate restraining bars in front and behind the modules, four inner FR4 walls, six aluminum 7075 top restraining
bars, and bent sheet metal walls and lid (the lid is transparent in the figure).
3.1.4 Materials Considered
Five materials were considered for the components of the enclosure: aluminum 7075, A514 steel, impact-resistant polycarbonate, glass-reinforced polycarbonate, and G- 10/FR4, a
fiberglass-reinforced plastic. Aluminum 7075 and A514 steel were selected because they are both machinable
and have relatively high yield strengths for aluminum and steel. Impact resistant polycarbonate was selected because it is machinable and relatively lightweight; glass-reinforced polycarbonate was considered as an alternative for impact-resistant polycarbonate in case a stronger plastic with similar density would be desirable. G- 10/FR4 was selected because it has a high strength-to-weight ratio, and because it provides electrical insulation and fire isolation.
Table 3-1: Summary of material properties for the five materials considered
Al A514 Impact Glass G-10/FR4
7075 Steel Resistant Reinforced
Polycarbonate Polycarbonate
Yield Strength [MPa] 503 690 62 110 241
Density [kg 2810 7860 1250 1330 1800
Strength to Weight Ratio 0.18 0.09 0.05 0.08 0.13
3.2 Design Details and Analysis
3.2.1 20g Downward Load Case
In the 20g downward load case, the modules will exert a total downward force of 9418 N on the plate they sit on. It was initially assumed that the structure would be a plate of some kind which not only can withstand the loads from the 20g downward load case, but can also contain the rest of the components in the battery pack, for example other structural components and the HV electronics. In designing this base plate, it was first determined that the battery pack would attach to the frame via tabs on the base plate on the left and right sides of the battery pack. This allows the battery pack to be installed from below with relative ease, as the tabs will be easily accessible from underneath the car.
The first step in designing the base plate was selecting the material. In comparing materials, it was assumed that the 9418 N load on the plate from the modules was uniformly distributed across the width of the plate, and that the ends of the plate were fixed, as the tabs would be bolted to the frame.
Figure 3-3: For the initial base plate bending analysis, it is assumed that the ends of the
plate are fixed because they will be bolted to the frame, and that a uniform force is applied downward from the acceleration of the modules.
f l
In this configuration, the maximum moment in the plate is Mmax =
n,
at each end, where f is the applied force per unit length [3]. The maximum stress in the material is thus as follows:1 f12 (1)
0-max = 2wh2
where w is the width into the page and h is the thickness of the plate. Because of the tabs for attaching to the frame, the cross-sectional area of the plate at the fixed ends will actually be smaller than the cross-sectional area of the rest of the plate, and thus the stress will be proportionally larger. This area ratio is approximately 1.5, thus the stress calculated from equation (1) was multiplied by
1.5 to account for this. Using this formula for the maximum stress in the material, the minimum
considered. The results of this calculation are shown in figure 3-4. The length used for the calculation was 0.549 m, the distance between the attachment points on the frame. The width used was 0.246 m, which is the length of the module from front to back. While the actual plate will need to have a larger width, it is still sufficient to use this number for comparison of materials.
700 - Max Stress 600 A514 Steel 0Al 7075 2 500- FR4 0 Polycarb a 400 0 Glass-filled Polycarb E 300-E S200- 100-0 5 10 15 20 25 Thickness [mm]
Figure 3-4: The maximum stress is plotted versus thickness f9r a uniformly loaded base
plate assuming fixed ends. For each material considered, the required thickness of the material to achieve a safety factor of 2 is plotted.
The required mass of each material was calculated using the thicknesses calculated in fig 3-4. Additionally, the deflection of the plate for each material was calculated with the following formula [3]:
1
f
14 (2)max =32 wh3E
The results of these calculations are shown in table 3-2.
Table 3-2: Summary of results for thicknesses, masses and deflections of a uniformly
loaded base plate for each material considered
Al 7075 A514 Steel Polycarbonate Glass-filled G-1O/FR4 Polycarbonate
Thickness [mm] 7.92 7.08 22.56 16.93 11.44
Mass [kg] 3.01 7.52 3.81 3.04 2.78
From the table it can be seen that FR4 would produce the lightest plate, followed by aluminum as the second-lightest. Both kinds of polycarbonate would also allow for a relatively light plate, though there would be excessive deflection and the plates would need to be more than twice as thick as with aluminum. Based on this data, aluminum 7075 was chosen, primarily because the required mass is less than twice that of steel, and aluminum is relatively easy to machine. FR4 is appealing because it would allow for a light plate, but it would be very difficult to manufacture and thus was not pursued.
The thickness calculated above is a starting point, but the next step was to determine the actual geometry of the plate. As weight is a critical performance metric for the design, it is desirable to use the least amount of material possible. In determining how to minimize the amount of material necessary, it was first recognized that the stress in the plate is non-uniform along the length. For the uniform loading condition assumed, the maximum stress in the plate as a function of the distance along the length is given by the following formula [3]:
c-(x) = f (61x - 12 - 6x2) (3)
2bhz
This stress profile is visualized in fig. 3-5, where the normalized stress is plotted versus normalized length of the plate. The stress is maximum at each fixed end, equal to zero at 0.22 131, and reaches a local maximum at one half of the length.
1 0.8 U) U) 0,6 N _ff 0.4 0 0.2 0' 0 0.2 0.4 0.6 0.8 1 Normalized Length
Figure 3-5: For a uniformly loaded plate with fixed ends, the normalized stress is plotted versus the normalized length. The significant takeaway is that while the stress is maximum at the ends, it is only half of the maximum at the halfway point along the length, and even lower than that at other points along the length. The ideal plate would
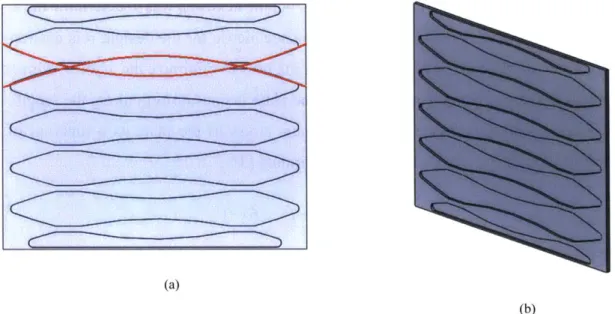
In the ideal scenario where no material is wasted, the stress is constant everywhere. Thus to efficiently minimize weight, material should be removed everywhere that the stress is not at a maximum. As stress is inversely proportional to width of the plate, varying the width to follow the profile in fig 3-5 allows for significant removal of material and results in a much more uniform stress profile. Varying the width to follow this profile was realized with "bowtie" structures, which are visualized in figure 3-6. In these examples, the nominal thickness of the plate is 8 mm, and the thickness in the pockets where material is removed is 2.54 mm.
(a)
(b)
Figure 3-6: (a) Example of a CAD model of a plate with the bowtie pocketing. One of
the bowties is outlined in red to highlight the geometry. (b) An angled view of the same
CAD model to show the pocketing
To validate this method of removing material, two finite element simulations were run - one with a plate of uniform 8 mm thickness, and one with a plate with material removed using the bowtie structures, with nominal thickness of 8 mm and minimum thickness of 2.54 mm in the pockets. The plate was fixed at both ends, and a uniform 9418 N load was applied on the top. The setup and the mesh for the FEA simulation are shown in fig 3-7, and the resultant stress profiles for both simulations are shown in figure 3-8.
Figure 3-7: FEA model setup and mesh for the comparison of a uniform thickness plate and a plate pocketed with the bowtie geometry. The ends of the plate are fixed and a uniform force is applied on the top face of the plate. The model setup is the same for both
the uniform plate as well as the plate with the bowties.
von Mises IN/m42)
L5000e+ 008 L37e+808 L201e+008 L126e+000 L002e+008 8.773e+007 7.527e+ 007 6.282e+007 5.036e+007 3.791e+007 2.546e+ 007 L300e+007 5,467e+005
-- Yield strength: 5.050e+000
von MISes
E
(N/A^2)1.000.+008 1.37e+006 L251e+008 L.126e+008 L002e+008 8.773e+007 7.327e+007 6.282e+007 5.036e+007 3.791e+007 2.546e+007 L300e+007 5,467e+005
-Yleild strength: 5.050e+ 000
(b)
Figure 3-8: (a) Resultant stress profile in the uniform thickness plate from FEA (b)
Resultant stress profile in the plate pocketed with bowtie geometry. In both examples, the stress at the fixed ends of the plate is approximately 80 MPa. However, it is clear that in
the rest of the uniform plate, the stress is much lower than this, while in the plate with bowties, the stress is near constant in the bowties. This is significant as the structural integrity of both of these plates is near identical in terms of stress, but the uniform plate is
4.84 kg, while the plate with bowties is 2.93 kg - only 61% of the original mass.
Fig 3-8(a) shows that with the uniform plate, most of the material is at a stress significantly lower than the maximum stress experienced at the ends. With the bowtie geometries, the stress is nearly constant along the length of the plate as desired. The uniform plate in these simulations was
4.84 kg, and the plate with the bowties was 2.93 kg - this is 61% of the original mass, a significant
and substantial improvement. These results show that this approach is legitimized and well worthwhile.
F
L
In refining and finalizing the geometry of the base plate, there are a number of other considerations which were taken into account. First, in addition to holding and securing the modules, the enclosure must hold all of the HV electronics, which sit in front of the modules. This is why there is a large area in front of the modules and the two additional tabs in the front. There are also holes in the plate for fastening the polycarbonate blocks described in sections 3.2.3 and 3.2.4. Additionally, there are slots on the top side of the plate for attaching the FR4 walls described in section 3.2.2 Finally, there is a ridge around the edge of the plate for attaching the outer walls described in section 3.2.5. The final geometry of the base plate, accounting for all of these necessary features, is shown in figure 3-9.
(a) (b)
Figure 3-9: (a) CAD model showing the final geometry of the top side of base plate. The slots are for the FR4 walls to be inserted and bonded to the plate, and the holes are for the polycarbonate restraining bars to be fastened. (b) Final geometry of the bottom side of
base plate. There are three bowties under the area where the modules sit which have a thickness of 0.44 inches; the other sections of the plate are thinner than this to save mass.
The minimum thickness for the pocketed sections is 2.54 mm, determined as an acceptable lower limit for the thickness of sections which are not load bearing. For the sections of the plate thicker than this, but not equal to the maximum thickness, for example where the twelve holes are, the thickness was limited by the length of the fasteners protruding out from underneath the plate. The rules specify that the entire enclosure, including fasteners, must be above the lowest part of the frame. This resulted in a thickness of 5.6 mm for these sections of the plate. The tabs and the three bowtie structures are the primary load-bearing components of the plate - for these sections, an initial thickness of 8 mm selected based on the results shown in table 3-2. FEA simulations were run for this thickness and iterations which involved changing this thickness to determine the effect on the maximum stress in the material as well as the maximum deflection. The model setup for these simulations is shown in fig 3-10. A total downward force of 9418 N is applied on the
areas where the modules contact the plate, and a 785 N force is applied downward on the area where the HV electronics sit - as the mass of the HV electronics is approximately 4 kg, this force is equivalent to a 20g downward acceleration, just as with the modules. The area on the bottom side of the tabs where there will be a washer is fixed for the simulations.
Figure 3-10: FEA model setup for the base plate downward loading simulation. The
bottom of the tabs are fixed where there will be a washer. The force from the modules is applied at the areas where the polycarbonate sheets on the modules will sit. The force is equivalent to a 20g downward acceleration, and is equal to 9418 N from the modules. An
additional 785 N force is applied on the front area from the 4 kg of HV electronics.
The results for maximum stress and maximum deflection in the plate versus thickness are shown in figure 3-11. U) a) =3 2 500 450 400 350 300 9 E E C 0 E E 8 7 6 5 4 7 8 9 10 11 12 7 8 9 10 11 12 Thickness [mm] Thickness [mm]
Figure 3-11: Results from FEA of maximum stress and deflection in the base plate
versus thickness. These results are for the final geometry of the base plate, and the thickness that is varied is the thickness of the thickest section which includes the bowties.
A final thickness of 11.2 mm was chosen so that the deflection would be less than 5 mm.
0
0
0e
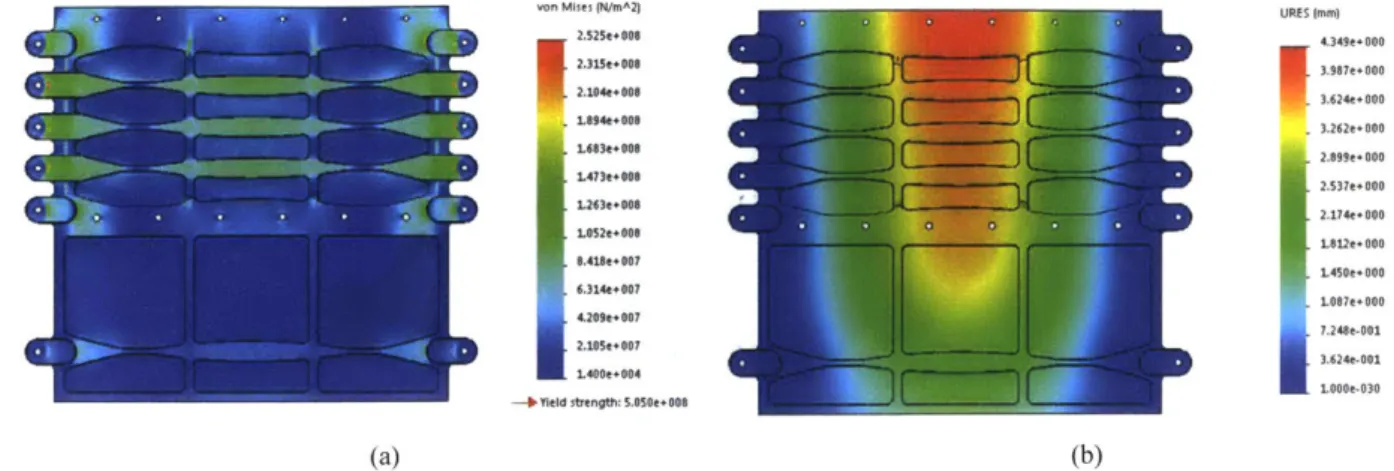
-A final thickness of 11.2 mm was chosen such that the deflection would be less than 5 mm. The resultant stress and deflection from the simulation for this thickness are shown in figure 3-12. The maximum stress is 298 MPa, resulting in a safety factor of 1.7, and the maximum deflection is 4.3 mm.
von Mises (N/mA2 URES (mm)
232e+014.340ev 00 2.315t+000 3.97e+000 2.104t+008 3.624e+000 L894e+008 .3.262e+000 L603e+000 2.899e.000 L4730082.537+000 L263e+008 2.174e+000 1.402e+007 02+0 +L452e+000 4.209e+007 L087e+000 2.185+07- - .240e-000 7.248e-001 L400e+004 3,624e.001
-- YeId strength: S.050e+000
(a) (b)
Figure 3-12: (a) Bottom view of the stress results from FEA for the final base plate geometry. The maximum stress is 298 MPa at the tabs, which provides a safety factor of
1.7. The relatively uniform sress profile in the bowties is visible. (b) Deflection results
from FEA for the final base plate geometry. The final deflection is 4.3 mm, at the back of the plate. This is satisfactory as it is below the 5 mm specified maximum.
3.2.2 20g Upward Load Case
For the upward load case, there is a total force of 9418 N exerted upwards by the modules. It was first determined that the strategy for restraining the modules in this scenario would be to implement a horizontal restraining bars on top of the modules which fasten to vertical walls in the enclosure, which are in turn attached to the base plate. With this configuration, the restraining bars are easily removed by unbolting them, and thus the modules are easily accessible and
serviceable.
The number of vertical walls inside the battery pack was not initially fixed. Thus a critical factor in determining the material and geometry of the top restraining bars was determining the number of vertical walls. For example, if there were only two walls, one on either side of the modules, then the length of the restraining bars would be the entire length from one side of the modules to another. However, if there were a vertical wall in between each module, then the effective length of each individual restraining bar would only be the width of a single module.
maximum stress in the restraining bars is proportional to the square of the length. Thus decreasing the length of the restraining bars by inserting more vertical walls can lead to significant weight savings.
To quantify this, the required dimensions of the restraining bars were calculated for all five materials and for each possibility of number of vertical walls. As there are six modules, there can either be 2, 3, 4 or 7 vertical walls. In each case, the height of the restraining bars was assumed to be fixed at 9.9 mm, as this is the maximum space available. The height of the bars should be maximized because the stress in the bars is inversely proportional to the square of the height. The total length of the bars was fixed and known to be 476 mm. The necessary width of the bars is then solved for with each material such that the stress in the material is equal to one half of the yield strength so that the factor of safety is 2. It was assumed that the force on the bars from the modules is uniformly applied, and that the ends of the bars are fixed. The fixed end assumption was made because in the scenarios with more than two vertical walls, the ends of the bars will not be able to rotate and will remain vertically oriented due to the constraints from the other bars. This is visualized in figure 3-13. The walls are shown in blue and the top bars in gray, with the uniform load from the modules represented with upward arrows. The ends of the bar in the middle will be constrained to remain approximately vertical because of the other bars on either side of it.
Figure 3-13: Upward loading on top restraining bars. A total force equivalent to a 20g
upward acceleration of the modules is applied to the bars. For calculations for the bars in the middle, it is assumed that the ends are fixed, as the ends will be constrained by the
bars on either side of it and will not be able to freely rotate.
In this scenario, the maximum stress in each bar can be solved for using equation (1). Using the known parameters and stresses at a factor of safety of 2, the necessary width of the bars in each
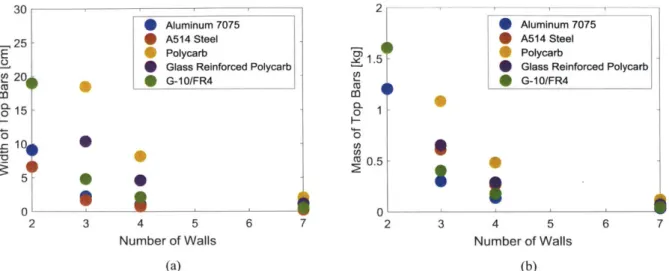
case was calculated. From the width and the other known dimensions, the total mass of the bars was also calculated for each case. The results of these calculations are presented in figure 3-14.
2 - -- 1-- _ _ -. ._ _ ___
30 2lmnm77
I Aluminum 7075
*
Aluminum 70752 A514 Steel 0 A514 Steel
25 Polycarb 0 Polycarb
0 Glass Reinforced Polycarb . Glass Reinforced Polycarb
20 0 G-10/FR4 M G-10/FR4 0C- 15 -0 1 0. (n 100 015.5 l H Ha 0 ' 0 2 3 4 5 6 7 2 3 4 5 6 7
Number of Walls Number of Walls
(a) (b)
Figure 3-14: (a) Summary of calculations for the required widths of the top restraining bars for different materials and number of walls (b) Summary of calculations for the required masses of the top restraining bars for different materials and number of walls. It
is clear from the figure that there is a significant decrease in the mass of the top bars as the number of walls is increased; this is expected because the stress in the top bars is
proportional to the inverse of the square of the length.
From these results, it is clear that increasing the number of walls allows for substantial weight reduction in the top bars, as expected. Using these results, aluminum 7075 was selected for the material, because it allows for the lightest bars as compared to the other materials. FR4 is also an appealing option, but as aluminum is much easier to machine and work with, aluminum 7075 was chosen as the best option.
The next question to be answered was the number of walls. Figure 3-14(b) shows that there is a significant advantage in increasing the number of inner walls, but the additional weight of the walls must also be considered. To determine the mass of the walls, the first step was to determine
the required thickness for each material. As with the restraining bars, the thickness for each considered material was determined using the yield strength criteria with a factor of safety of 2. The maximum stress at the walls occurs at the holes where the restraining bars will be bolted on. Two restraining bars are used, so there will be two holes in the walls. The stress at the holes was first predicted by assuming that the walls were in tension due to the applied force, where the stress due to tension is equal to the applied force divided by the cross-sectional area of the wall. A stress
diameter of the hole [3]. The results of these calculations are summarized in figure 3-15 for 3, 4 and 7 walls. 80 . --- 3 walls 4 walls 60 - 7 walls -S 40 C,, C,, U20 CU 0 1 2 3 4 5 6 Wall Thickness [mm]
Figure 3-15: Calculated maximum stress in the walls versus thickness. For the
calculations, the bulk stress in the material, calculated assuming pure tension, was multiplied by a stress concentration of 3 to account for the stress concentrations at the
holes where the top bars fasten to the walls.
FEA was then performed for this loading scenario to compare with these calculations. The
loads were applied upward at the faces where the restraining bars interface with the walls, as it is the force of friction from the bolted connections which transfers the load from the bars to the walls. For the FEA, the walls were modeled as shell elements, and they were fixed at the bottom to represent the bonded connection with the base plate. This model setup is shown in figure 3-16(a), with an example of the results shown figures 3-16(b) and 3-16(c).
von Mises (N/mA2) 1.338e+008 1.226e+008 1.115e+000 1.003e+000 0.920e+007 7,806e+007 6.691e+007 5.577e+007 4.462e+ 007 3.348e+ 007 2.233e+ 007 1.118e+007 3.922e+004 Yield strength: 2.410e+008
(a) (b)
3 Lf.",
U62..?
I&
M
(c)
Figure 3-16: (a) FEA model setup for the wall upward loading scenario. The force is applied at the faces where the top bars attach to the walls. (b) Stress results for this load
case, showing maximum stresses near the two holes. (c) Close-up of stress results for wall upward loading FEA at one of the holes. The maximum stress is approximately twice as large as the predicted value based on calculations, but this is not completely unexpected, as the calculations did not take into account the close proximity of the holes to the edge of the wall. This causes an increase in the stress around the hole, and explains
why the FEA predicts higher stresses than the calculations.
As expected, there is a stress concentration around the holes, and this is where the maximum stress in the material occurs. Simulations were run for the different loads depending on the number
of walls as well as for thicknesses of 1, 2, 3, 4 and 5 mm. The results of these simulations are
14 - - -3 walls fit ,120 - - - -4 walls fit 0% - - -7 walls fit .100 - X 3 walls data X 4 walls data 380 X 7 walls data C %. >% o 60 -C/) 4A 2~ 20 - X - -0 1 2 3 4 5 Wall Thickness [mm]
Figure 3-17: Summary of results from FEA of maximum stress in the walls versus
thickness. The results are not plotted for 2 walls because the force on the walls in the scenario with 2 walls is equal to the force on the middle wall in the scenario with 3 walls.
Power law fits were performed for all three cases, and for each scenario the stress was determined to be proportional to , where h is thickness, with 0.05 uncertainty on the
0.94 exponent. Theory predicts that the stress is proportional to , so this instills
confidence that the FEA results are physical and legitimate.
From the five data points for each load case, a fit was performed assuming a power law
relationship. For each set of data, the stress was determined to be proportional to h , where h is
the thickness, with 0.05 uncertainty on the 0.94 exponent. This inspires some confidence in the
1
results because it is expected that the stress is proportional to -. However, it is readily apparent that the results from the FEA simulations do not match with the predictions shown in figure 3-15. This is not completely unexpected, because the force is being applied directly at the hole and within 10 mm of the top of the wall. An assumption in the calculations used to produce figure 3-15 is that the hole is not in the proximity of the edge of the wall. Thus it is expected that the actual stress in the material near the holes is larger than the predicted values from the simplified calculations. Because of this, the FEA results are used for the following calculations.
Using the results in figure 3-17, the minimum thickness required for each material and each scenario were calculated. In these considerations, the minimum allowable thickness for any
material was determined to be 1 mm - even though this is greater than the required thickness for
many of the materials and scenarios based solely on the yield criteria, this was used as a lower
limit because walls thinner than this would be prone to bending and deformation during installation and handling, even if they would be acceptably strong under the vertical loading condition.
For aluminum 7075, A514 steel and FR4, 1 mm thick walls would be strong enough for 3, 4 and 7 total walls. Each material would allow for a factor of safety greater than 2, with the exception of FR4, which would have a factor of safety of 1.8 - also deemed to be acceptable. A 1.2 mm FR4 would be necessary for a factor of safety of 2. The mass of each wall for a 1 mm thickness for these three materials is summarized in table 3-3.
Table 3-3: Summary of the masses of individual walls for 1 mm thickness for aluminum 7075, A514 steel, and FR4
Al 7075 A514 Steel FR4
Mass [kg] 0.186 0.520 0.119
With the mass of the walls for each scenario is known, it is possible to take this and the mass of the top bars into account to determine which configuration allows for minimum mass. Table 3-4 summarizes the total mass for each configuration.
Table 3-4: Total mass for each configuration of number of walls, including the mass of the walls and the mass of the restraining bars
Top Bar Total Mass w/ Al 7075 Total Mass w/ A514 Total Mass w/
G-Mass [kg] walls [kg] Steel walls [kg] 10/FR4 walls
2 walls 1.204 1.576 2.245 1.442
3 walls 0.301 0.857 1.862 0.658
4 walls 0.134 0.878 2.215 0,11
7 walls 0.033 1.335 3.675 0.867
From these results, it was determined that the configuration which minimizes the total mass is four internal FR4 walls. In this configuration, the calculated required width for the aluminum
7075 restraining bars is 10.1 mm. Two separate restraining bars were ultimately implemented to
restrain the modules as shown in figure 3-18. Results of final FEA for the restraining bars is presented in section 3.2.4.
top restraining bars
Figure 3-18: CAD showing the top restraining bars and how they connect to the FR4
walls. Threaded steel inserts are installed in the top restraining bars so that they can be fastened together.
To bond the FR4 walls to the base plate, 3M DP125 epoxy was used. This bond was tested to ensure that it would be able to withstand the necessary loads. A test piece was made, shown in figure 3-19(a), which has two slots with the same width and thickness as the actual base plate. The lengths of the test pieces were 39.2 mm and 45.4 mm, compared to the actual wall which has an actual length of 229 mm. A downward load was applied as shown in figure 3-19(b) with 45 kg of weights and a spring scale with a maximum reading of 52 kg.
(a) (b)
Figure 3-19: (a) Test piece for FR4 to aluminum bond testing, with two pieces of FR4
bonded to an aluminum plate with 3M DP 125 epoxy. (b) Actual testing procedure for the FR4 to aluminum bond. The aluminum piece was clamped in a vise, 45 kg of weights were hung from the FR4, and an additional 52 kg was applied with the spring scale. Both test pieces were tested to the maximum force that the spring scale could measure without failure, which ultimately resulted in a safety factor of 1.77 for the 20g upward load case.
For both tests, the maximum reading of the spring scale was achieved without the bonded
results in an applied force of 3139 N for each of the two inner walls. The stress in the bonded joint scales linearly with the inverse of area, so the applied force on the test piece of 951.6 N for the
39.2 mm long piece corresponds to an applied force of 5559 N for the actual length, in terms of
the stress the joint experiences. This results in a safety factor of 1.77 for this bonded joint.
3.2.3 40g Longitudinal Load Case
For the 40g longitudinal load case, the polycarbonate bar in front of the modules holds the modules in compression and prevents the modules from accelerating forwards. The
polycarbonate bar is shown in figure 3-20, with figure 3-20(b) showing a close-up of the interaction with the modules. When installing the polycarbonate bars, the modules are first inserted and then the bars are adjusted such that they properly constrain the modules, and then they are bolted to the base plate.
(a) (b)
Figure 3-20: (a) CAD showing the polycarbonate restraining bar fit with the modules (b)
Close-up of the polycarbonate bar and the modules. The protrusions from the polycarbonate bar secure and constrain the modules in the lateral direction.
The polycarbonate bars were designed to hold the modules in compression during the 40g longitudinal and lateral accelerations. To prevent the 40g load from applying an excessive moment to the polycarbonate bar, the rear top restraining bar exerts a force down on the module to counteract the moment from the applied force. A free body diagram for this load case is shown in figure 3-21 which represents this scenario. It was assumed that if a 40g force is applied to the modules in the forward direction, gaps develop between the components such that only the forward polycarbonate bar and the rear top restraining bar are in contact with the module.
rear top bar
module
forward Fappt ed
polycarb bar T IH2
Figure 3-21: Free body diagram showing the forces for the longitudinal load case. It was
assumed that if the longitudinal force is applied to the center of gravity of the module, it would rotate slightly causing gaps to develop such that only the front polycarbonate restraining bar and the rear top restraining bar would be in contact and exerting force on
the module. In this scenario, the rear top bar exerts a downward force to prevent the module from rotating further or moving up vertically, thereby allowing the components
to constrain the modules with only compression forces. The dimensions are H, =
16.5 mm, H2 = 130 mm, and W = 200 mm.
From the free body diagram, it follows that the horizontal force exerted by the polycarbonate
m
bar is F = Fapplied = 2 * 8 kg * 40 * 9.81 - = 6278 N. Each module weighs 8 kg, and there
are two modules per section. Summing the moments around point A, it can be determined that the
vertical force exerted by the back top restraining bar is Fy2 = Fapplied * H2-H1 = 6278 N*
130mm-16.Smm = 3563 N. As long as the polycarbonate bar and the top bar can withstand these
2 00mm
forces, they are able to restrain the modules in compression. In the lateral load case, the vertical force on the top bars is slightly larger, thus this is not the limiting load case for the top bars.
The polycarbonate bar is bolted to the base plate with six '/4-20" bolts. To analyze the 40g longitudinal load case, it is assumed that the bottom of the polycarbonate is fixed to the base plate because of the bolted connection. For analysis, the bar was considered to be a cantilevered beam fixed at the bottom with a uniform load applied from the module contact areas. The maximum
moment for this scenario is Mmax = F, where F is the applied force [3]. It follows that the
2
maximum stress is Umax = 3FL. For the polycarbonate bar, L = 33.0 mm, W = 482 mm, and
H = 14.6 mm. H, the depth of the bar, is not constant throughout the entire material, but 14.6 mm is an approximation acceptable for initial calculations. With the total applied force of 18835 N
- - - --- I
from the modules, this results in a maximum stress of 18.1 MPa in the material. FEA was performed to validate these results. The FEA model setup is shown in figure 3-22.
Figure 3-22: FEA model setup for the longitudinal load case. The force from the
modules is applied at the faces of the polycarbonate restraining bar which are in contact with the modules. The magnitude of the force is the total module mass multiplied by a
40g acceleration, equal to 18835 N. The entire bottom face of the polycarbonate bar is
assumed to be fixed to model the connection with the base plate, as the base plate is relatively rigid and the polycarbonate bar is fastened with six total bolts.
The maximum stress in the material from the FEA results is 24.5 MPa, on the same order of magnitude as the predictions although 35% greater. On the back edge of the polycarbonate bar, the maximum stress is 20 MPa - this lines up well with the predictions and is only off by 10%. Additionally, this is where maximum stress is expected because of the interference between the polycarbonate and the base plate while the polycarbonate is bending. The FEA predicts the maximum stress of 24.5 MPa on the front edge of the polycarbonate - in reality, this stress may be lower than this value because the polycarbonate is free to separate from the base plate, which would alleviate some of the stresses due to bending. Thus it is expected that the 24.5 MPa value is a conservative estimate for the maximum stress in the polycarbonate, and results in a safety factor of 2.53.
Von Mke "Ah21 2.4500007
42.2.100
O+0000
~Itij : lo sof 2.072a.0%0 1JW" .00 - 3.293e.004
(a) -+ed0000000 62000 00
(b)
Figure 3-23: (a) Stress results from FEA for the longitudinal load case. (b) Maximum
stress in the rear side of polycarbonate bar (relative to the applied force) for the longitudinal load case. This maximum stress is 20 MPa, only 10% off from the prediction
3.2.4 40g Lateral Load Case
In the 40g lateral load case, the protrusions from both the front and back polycarbonate bars restrain the modules horizontally, and as before, the top restraining bars constrain the modules vertically and prevent the modules from exerting an excessive moment on the polycarbonate bars. A free body diagram for this scenario is shown in figure 3-24, assuming that during the lateral acceleration, gaps would develop such that the top right corner of the module as seen in the figure would be in contact with the top restraining bar, and both faces of the polycarbonate bar would be in contact with the respective polycarbonate cell holders on the modules.
top bar module Fapplied HF Polycarb bar Fx1 H x (entire bar A not shown)
Figure 3-24: Free body diagram showing the forces for the lateral load case. The
magnitude of the force applied for each module is a 40g acceleration times the mass of the module, equal to 3139 N. The entire polycarbonate bars are not shown, rather only the
part of the bars which will be in contact with the modules and restrain them in this case. As with the longitudinal load case, it is assumed that gaps will develop if the module rotates slightly from the applied force such that the module is only in contact with the two
shown faces of the polycarbonate and the top restraining bar at the location shown. Thus the polycarbonate bars and the top restraining bars constrain the module using only compression forces and avoid any excessive moments applied to the polycarbonate bars.
The dimensions are H = 16.5 mm, H2 = 130 mm, and W = 74.5 mm.
From the free body diagram, the force on the top bars Fy2 can be solved for as Fy2 = Fapplied *
H2-H1. For each module, Fapplied = 8 kg * 40 * 9.81 = 3139 N, and with H, =
w S2
16.5 mm, H2 = 130 mm, and W = 74.5 mm, Fy2 = 4783 N. Because two top bars span two
modules, the total vertical force on a single top bar is 4783 N, applied in two places, at the top
edge of each module - the right edge, as seen in the free body diagram. The reaction force on each
face of the polycarbonate bar is Fj1 = Fx2= 1570 N, assuming the load is equally distributed
between the two faces.
To analyze the force on the polycarbonate bar, the bottom of the bar was assumed to be fixed to the base plate, for the same reasons as with the lateral load case. The failure mode for the lateral case was expected to be failure of the thin protrusions, each of which must bear one quarter of the load from the module acceleration. Though the protrusion is relatively short at only 4.48 mm long, it can be roughly approximated as a cantilevered beam fixed where it protrudes form the bulk of the polycarbonate bar. The lateral stiffness of the bulk portion of the bar is high enough to allow for the assumption of rigidity when analyzing the protrusion. Assuming a cantilevered beam with a uniform force applied by the modules, the maximum predicted stress in the material is 27.4 MPa.
FEA was performed to check this calculation. The model setup for this load case is shown in figure
3-25.
Figure 3-25: FEA model setup for the lateral load case. The total force is the same as
with the longitudinal case at 18835 N. This force is applied at the faces of the polycarbonate bars on the protrusions which constrain the modules. Again, the bottom of
the polycarbonate is assumed to be fixed to model the bolted connection with the base plate.
Results from this simulation are shown in figure 3-26. The maximum stress is 32.4 MPa in all of the protrusions except for the outermost one. This agrees reasonably well with the prediction of 27.4 MPa with 18% error. The absolute maximum stress in the material is at the outermost protrusion and is predicted to be 47.7 MPa from the FEA, resulting in a safety factor of only 1.3. However, in analyzing these results further, it was revealed that only 0.03% of the material is
that even if a very small portion of the material experiences a high stress close to the yield strength of the material, the structure will not fail.
onMists (N/m 21
p
1977- tssgts~000D7 .3.580e+OO7 3.182e+007 1.989e+007 (b)4 1.591e+007 1.194e+007 .960t+006 3.983,+006 6.421e+003E~
~~~ Nd: 145Vielis strength: 6.200e+007(a)
Figure 3-26: (a) FEA results for lateral load case, shown at one of the protrusions. The
maximum stress in the protrusion is 32.4 MPa, 18% off from the prediction of 27.4 MPa
based on the calculation. (b) Maximum stress in the outermost protrusion; higher than in the other protrusions at 47.7 MPa, but still below the yield strength of the material with a
safety factor of 1.3.
The top bars must also be analyzed to ensure that they can bear the necessary loads as
described above. The forces applied by the modules are not applied uniformly, as they will be applied at the edges of the modules as described above. The locations of the applied forces can be seen in figure 3-28. The width of each bar is limited because of the limited available space on top of the module which is structural and can bear load, and because there must be enough space to install a '/4-20" bolt so that the bars can be fastened to the walls. A top view of the bar geometry is shown in figure 3-27. The thin sections of the bar are each 3.81 mm thick, and the maximum thickness at the ends and at the two sections in the middle is 17.9 mm. This geometry fits within the given space constrains and makes it possible to screw the top bars to the walls with a ball end
hex key. The height of the bar is 9.9 mm and the length is 157 mm.
II
IX=
A
Figure 3-27: Top view of a top restraining bar to show the geometry. To install the top bars, a ball end hex key is used to screw the bars together. Threaded steel inserts are
To predict the expected maximum stress in the material, the bar was analyzed as shown in figure 3-28. The two forces being applied are from the corners of each of the modules. F1 and F2
are each equal to 2392 N.
a,-- - - - - --- ---
-F
1F
2Figure 3-28: Forces on top restraining bar for the lateral load case, with F1 and F2 being
applied by the modules and each equal to 2392 N. The dimensions are a, =
69.7 mm, b1 = 87.7 mm, a2 = 144 mm, and b2 = 13.2 mm.
It is expected that the maximum stress in the bar under this loading scenario will be at the point where F1 is applied. If the bar had a constant width across the entire length of material, then
the maximum stress would be at the right end. However, because the material is more than twice as thick at that section as it is at its thinnest, the moment of inertia is more than twice as large, and thus the stress is less than half of what it would be with if the material did not have the extra thickness. The point where F1 is applied is the thinner section of material, and thus has a smaller
moment of inertia. The moment at this point from both F1 and F2 was calculated using the
following formula, and was then added together via superposition to determine the total moment at that point.
F b2 Fab2 (4)
M = (3a - b)x - 2
With a, = 69.7 mm, b1 = 87.7 mm, a2 = 144 mm, and b2 = 13.2 mm, the moment at
a1 from F1 is 52 Nm, and the moment at a1 from F2 is -5.7 Nm. Summing these moments and
M(-) 1
then calculating the maximum stress as Umax = , where I = - bh12 3, the maximum predicted stress is 372 MPa.
To validate these calculations, FEA was performed on the bar for this load case. Forces were applied at a small area on the bar, as it was not possible to apply a force at a single point in Solidworks. The setup for this FEA is shown in figure 29(a), with the mesh shown in figure
1T
It
(a)
(b)
Figure 3-29: (a) FEA model setup for the top restraining bar. As it is not possible to
apply a force at a point in Solidworks, the forces are applied on areas with the width of the polycarbonate sheets on the modules which hold the cells together. (b) Mesh for the
FEA simulation of the top restraining bars
The results of these simulations are shown in figure 3-30. The maximum stress in the material, 473 MPa, is higher than predicted due to a stress concentration as shown in figure 3-30(b). This is not ideal as it results in a safety factor of only 1.06. However, because the high stress is only at that stress concentration, only 0.06% of the material is above 400 MPa and only
0.2% of the material is above 350 MPa. The maximum where F1 is applied is 342 MPa, only 8%
off from the 373 MPa prediction, resulting in a safety factor of 1.47. These results are deemed satisfactory because even if a tiny portion of the material at the stress concentration plastically yielded during a 40g crash scenario, the material itself would not fail, as the stress would still not be close to the 572 MPa tensile limit for aluminum 7075. Thus the structural integrity of the entire bar would not be compromised.