READ THESE TERMS AND CONDITIONS CAREFULLY BEFORE USING THIS WEBSITE.
https://nrc-publications.canada.ca/eng/copyright
Vous avez des questions? Nous pouvons vous aider. Pour communiquer directement avec un auteur, consultez la première page de la revue dans laquelle son article a été publié afin de trouver ses coordonnées. Si vous n’arrivez pas à les repérer, communiquez avec nous à [email protected].
Questions? Contact the NRC Publications Archive team at
[email protected]. If you wish to email the authors directly, please see the first page of the publication for their contact information.
NRC Publications Archive
Archives des publications du CNRC
This publication could be one of several versions: author’s original, accepted manuscript or the publisher’s version. / La version de cette publication peut être l’une des suivantes : la version prépublication de l’auteur, la version acceptée du manuscrit ou la version de l’éditeur.
Access and use of this website and the material on it are subject to the Terms and Conditions set forth at
Energy efficient ventilation for maintaining indoor air quality in large buildings
Shaw, C. Y.
https://publications-cnrc.canada.ca/fra/droits
L’accès à ce site Web et l’utilisation de son contenu sont assujettis aux conditions présentées dans le site LISEZ CES CONDITIONS ATTENTIVEMENT AVANT D’UTILISER CE SITE WEB.
NRC Publications Record / Notice d'Archives des publications de CNRC: https://nrc-publications.canada.ca/eng/view/object/?id=8737c5d2-a696-4644-9c91-c3783f0729ee https://publications-cnrc.canada.ca/fra/voir/objet/?id=8737c5d2-a696-4644-9c91-c3783f0729ee
A version of this paper was presented at the 3rd International Conference on Cold Climate Heating, Ventilating and Air-conditioning, Sapporo, Japan, November 2000
C. Y. Shaw Résumé
Institute for Research in Construction, National Research Council Canada
Achieving good indoor air quality in large residential and commercial buildings continues to be a top priority for owners, designers, building managers and occupants alike. Large buildings present a greater challenge in this regard than do smaller buildings and houses. The challenge is greater today because there are many new materials, furnishings,
products and processes used in these buildings that are potential sources of air contaminants. There are three strategies for achieving acceptable indoor air quality: ventilation (dilution), source control and air cleaning/filtration. Of the three, the most frequently used strategy, and in most cases the only one available to building operators, is ventilation. Ventilation is the process of supplying outdoor air to an enclosed space and removing stale air from this space. It can control the indoor air quality by both diluting the indoor air with less contaminated outdoor air and removing the indoor contaminants with the exhaust air. Ventilation costs money because the outdoor air needs to be heated in winter and cooled in summer. To conserve energy, care must be taken to maximize the efficiency of the ventilation system. In this regard, a number of factors come into play.
FACTORS AFFECTING VENTILATION AND ENERGY USE
The main factors affecting the performance and energy efficiency of a ventilation system are air distribution, air leakage and contamination sources (1).
Air distribution - Ideally, all occupants should benefit equally from the ventilation
(outdoor) air being circulated to a space: that is, the air should reach all the occupied zones of the building. This is not always the case, however, especially in residential buildings, as evidenced by an IRC study conducted several years ago in a five-storey apartment building (2).
The ventilation air in this building was supplied to the corridors. The design concept relied on the pressurization of the corridors to provide ventilation air to the individual apartment units. Exhaust fans installed in the bathroom and kitchen of each unit facilitated the delivery of the ventilation air by lowering the internal pressures. In addition to mechanical ventilation systems, the pressures in individual units are
NRCC 44501
2
the pressures in the apartment units on the windward side; lowers the pressures in the apartment units on the leeward side. When the inside temperature is higher than that outside, the pressures in the apartment units increase on the lower floors and decrease on the upper floors. Changes in pressure in the apartment units due to wind, temperature, or both, can significantly affect the movement of ventilation air.
The IRC study was conducted during winter to assess the maximum influence of stack effect using the tracer gas method, which requires a small amount of harmless tracer gas, SF6, to be injected into the supply-air duct (3). Air samples were taken at six locations on
each floor (including two apartment units on each side of the corridor, the corridor, and a stairshaft) to measure the tracer gas concentrations. Detection of the tracer gas at any of the six locations provided evidence that air from the ventilation system was reaching them. The results show that immediately after the tracer gas was injected into the ventilation system, high SF6 concentrations were detected at five sampling locations
including all apartment units on one side of the corridor. Little or no tracer gas was detected in an apartment unit on the other side of the corridor. This suggests that the units on one side of the corridor were receiving much more ventilation air than the building design called for. The units on the other side were receiving little or no ventilation air because the pressures in these units were high enough to prevent it from entering via the corridor. These units were likely relying solely on air leakage (see discussion below) for ventilation. As the ventilation air must be preheated in winter, units relying on air leakage require additional energy to heat the air leaking in. The occupants of these units would experience cold drafts and would likely resort to raising the thermostat to increase their comfort, thus further increasing energy use.
Air leakage - Air leakage is the infiltration of air through the building envelope. The
amount of air leakage depends on the airtightness of the building envelope and the pressure difference across it caused mainly by wind and stack effect.
Leaky buildings are more costly to heat and more difficult to ventilate properly than relatively airtight buildings. 25 years ago, IRC measured the overall airtightness values of various types of buildings, including eight office complexes. Five of these office building were re-tested recently to determine whether their airtightness values had changed. One of the re-tested buildings was found to be about 40% more airtight owing to extensive renovations. Based on the recorded energy consumption for the same three winter months before and after the renovations, the 40% improvement in airtightness translates into an energy-saving of 11% (4). These data are strong evidence that designers and owners can profit by knowing how airtight the building really is.
Cold drafts are usually a good indication that air leakage is occurring. When this is the case, sealing cracks and openings in the exterior wall and around windows will improve airtightness.
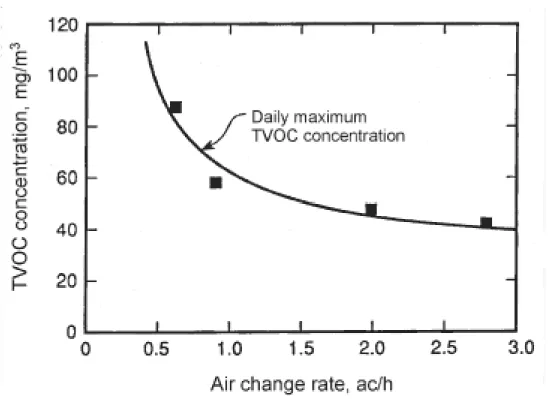
Contamination source/local ventilation - When powerful contamination sources are
inclined to increase the ventilation rate to speed up the dilution process. An IRC study indicated that such a strategy is rarely effective, even when energy use is not a concern. The study took place in an area where a number of photocopiers were located together and staff were complaining of poor air quality (5). In the study, air samples were taken in this area throughout the day to measure the concentrations of volatile organic compounds (VOC’s). To determine whether dilution alone could eliminate this pollution problem, the ventilation rate in the building was increased six-fold from 0.5 to 3 air changes per hour. This action decreased the VOC level by 50% from 90 ppm to 45 ppm (Figure 1). However, this reduced level still significantly exceeds the concentrations of between 0.1 and 5 mg/m3 found in 200 samples taken by IRC researchers in Canadian residential and office buildings (6). The study clearly showed that ventilation alone does not ensure acceptable IAQ where a prominent source of contaminants is present. It is necessary to remove the contaminants at the source by using local exhaust and to rely on ventilation for the rest of the required improvement in air quality. In the case of an identifiable contaminant source such as a photocopier, the exhaust of the photocopier should be directly connected to the outside.
ENERGY-EFFICIENT CONTROL OF VENTILATION
Two strategies have been used to reduce ventilation energy use: shutdown of ventilation systems during non-occupied period and CO2 Demand-Controlled Ventilation. The issue
of CO2 Demand-Controlled Ventilation is discussed in detail below.
CO2 demand-controlled ventilation - The American Society of Heating, Refrigerating,
and Air-Conditioning Engineers (ASHRAE) recommends ventilation rates for buildings based on the maximum (design) number of occupants. For buildings such as office complexes and schools, where the number of occupants varies significantly with time (i.e., the building is typically occupied only during the day), it may be possible to control ventilation rates based on the number of occupants at a given time. One approach is the demand-controlled ventilation system, using occupant-generated CO2 as the control
index.
In order to demonstrate the feasibility of using CO2 concentrations as a method of
controlling the ventilation rate, a building should meet the following two conditions: 1. The CO2 concentration must be proportional to the actual number of occupants, and
2. The CO2 concentration should be the same on all floors so that suitable locations can
be found for placing the CO2 sensors, where the concentrations of CO2 are
representative of those throughout the building.
To verify whether a building is likely to meet these conditions, IRC conducted a study in a 22-storey office tower with an interior volume of approximately 113,700 m3 (7). The building has seven all-air constant-volume supply-air systems and two return-air systems. Four of the supply-air systems provide air to the interior zones of the east and west floors.
NRCC 44501
4
The remaining three systems provide air to the south perimeter, the east and east half of the north perimeter, and the west and west half of the north perimeter.
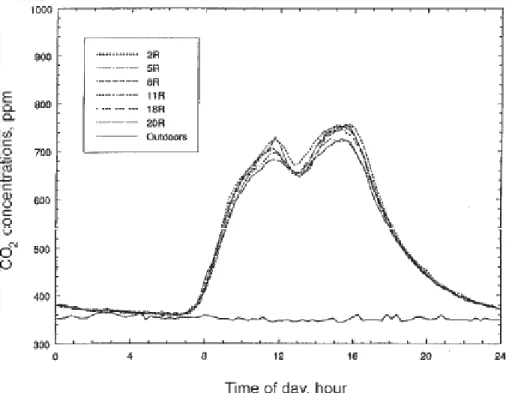
The results shown in Figure 2 confirm that the CO2 concentration varies according to the
number of occupants. The concentration is low during the night, begins to rise as the employees arrive in the morning and peaks around noon. It drops somewhat during the lunch hour, then picks up as the employees return to work and peaks again around 4 p.m. Once the occupants begin to leave, the concentration drops continuously until it reaches the nightly level.
On all test floors, the CO2 concentrations measured at various locations on the occupied
floor agreed closely with the concentration measured at the return-air shaft of that floor, suggesting that the latter measurement provides a good indication of the CO2
concentration for the entire floor.
Then once it was determined that the CO2 concentrations measured at the return-air
intakes of individual floors were the same from one floor to another, measurements were taken at the tops of the two main return-air shafts. Figure 3 shows that the measurements at the tops of the shafts agreed closely (within 2%) with the values at the return-air intakes on individual floors, indicating that they are representative of the CO2
concentrations throughout the building. The finding also indicates that the tops of return-air shafts are suitable locations for CO2 sensors.
SUMMARY
The information in this paper has been presented to help building designers, owners and managers understand how certain key factors affect the performance and energy
efficiency of the ventilation system, and to operate ventilation systems at minimal energy cost.
Improving the airtightness of older buildings will reduce air leakage and cold drafts, and help reduce energy use by improving the performance of ventilation systems.
There are three strategies for achieving acceptable indoor air quality: ventilation, source control and cleaning/filtration. Depending on the building and the specific characteristics of its location, these strategies may be used singly or in combination. When identifiable contamination sources are present in a building, it is necessary to reduce contamination sources as much as possible either by using environmentally friendly furnishings,
materials and products, or by exhausting contaminants at the source, if possible. General ventilation should then be used.
For buildings where the number of occupants varies significantly with time, such as office complexes and schools, it may be possible to further improve energy efficiency by turning off ventilation systems during the non-occupied periods and controlling their ventilation rates during occupied periods based on the actual number of occupants at a given time.
REFERENCES
1. Shaw, C.Y., Construction Technology Update, No. 35, Institute for Research in Construction, National Research Council Canada, 2000.
2. Shaw, C.Y., Reardon, J.T., Said, M.N., and Magee, R.J., Airflow patterns in a five-storey apartment building, Proceedings, 12th AIVC Conference, Ottawa, September 1991.
3. Shaw, C.Y., Application of tracer gas techniques to ventilation and indoor air quality investigations, Indoor Environment, v.2, pp.374-382, 1993.
4. Shaw, C.Y. and Reardon, J.T., Changes in airtightness levels of six office buildings, ASTM STP 1255, pp.47-57, 1995.
5. Shaw, C.Y., Magee, R.J., Shirtliffe, C.J., and Unligil, H., Indoor air quality
assessment in an office-library building: Part 1 - test methods and Part II - test results, ASHRAE Transactions, v.97, Pt.2, pp. 129-145, 1991.
6. Tsuchiya, Y., Volatile organic compounds in indoor air, Chemosphere, v. 17, No.1, pp.79-82, 1988.
7. Reardon, J.T., Shaw, C.Y. and Vaculik, F., Air change rates and carbon dioxide concentrations in a high-rise office building, ASHRAE Transactions, v.100, Pt.2, 1994.
NRCC 44501
6
Figure 2 Typical CO2 concentration profiles in return air intakes
Figure 3 Daily average CO2 concentrations measured at the return air shaft compared with the average of those measured in occupied zones of individual test floors