arXiv:1401.5785v2 [hep-ex] 23 Apr 2015
FERMILAB-PUB-14-012-E
Measurement of differential t¯
t production cross sections in p ¯
p collisions
V.M. Abazov,31B. Abbott,67 B.S. Acharya,25 M. Adams,46 T. Adams,44 J.P. Agnew,41 G.D. Alexeev,31
G. Alkhazov,35 A. Altona,56 A. Askew,44 S. Atkins,54 K. Augsten,7 C. Avila,5 F. Badaud,10 L. Bagby,45
B. Baldin,45 D.V. Bandurin,73S. Banerjee,25 E. Barberis,55 P. Baringer,53J.F. Bartlett,45 U. Bassler,15
V. Bazterra,46 A. Bean,53M. Begalli,2 L. Bellantoni,45 S.B. Beri,23G. Bernardi,14R. Bernhard,19 I. Bertram,39
M. Besan¸con,15 R. Beuselinck,40 P.C. Bhat,45 S. Bhatia,58 V. Bhatnagar,23 G. Blazey,47 S. Blessing,44K. Bloom,59
A. Boehnlein,45 D. Boline,64 E.E. Boos,33 G. Borissov,39M. Borysoval,38 A. Brandt,70 O. Brandt,20 R. Brock,57
A. Bross,45 D. Brown,14 X.B. Bu,45 M. Buehler,45V. Buescher,21V. Bunichev,33 S. Burdinb,39 C.P. Buszello,37
E. Camacho-P´erez,28 B.C.K. Casey,45 H. Castilla-Valdez,28 S. Caughron,57 S. Chakrabarti,64 K.M. Chan,51
A. Chandra,72 E. Chapon,15G. Chen,53 S.W. Cho,27 S. Choi,27 B. Choudhary,24 S. Cihangir,45 D. Claes,59
J. Clutter,53 M. Cookek,45W.E. Cooper,45M. Corcoran,72F. Couderc,15 M.-C. Cousinou,12D. Cutts,69A. Das,42
G. Davies,40S.J. de Jong,29, 30 E. De La Cruz-Burelo,28 F. D´eliot,15R. Demina,63 D. Denisov,45 S.P. Denisov,34
S. Desai,45 C. Deterrec,20K. DeVaughan,59 H.T. Diehl,45M. Diesburg,45 P.F. Ding,41A. Dominguez,59A. Dubey,24
L.V. Dudko,33 A. Duperrin,12 S. Dutt,23 M. Eads,47 D. Edmunds,57J. Ellison,43 V.D. Elvira,45 Y. Enari,14
H. Evans,49 V.N. Evdokimov,34 L. Feng,47T. Ferbel,63 F. Fiedler,21F. Filthaut,29, 30 W. Fisher,57 H.E. Fisk,45
M. Fortner,47H. Fox,39 S. Fuess,45 P.H. Garbincius,45 A. Garcia-Bellido,63 J.A. Garc´ıa-Gonz´alez,28V. Gavrilov,32
W. Geng,12, 57 C.E. Gerber,46 Y. Gershtein,60 G. Ginther,45, 63 G. Golovanov,31 P.D. Grannis,64 S. Greder,16
H. Greenlee,45G. Grenier,17 Ph. Gris,10 J.-F. Grivaz,13 A. Grohsjeanc,15 S. Gr¨unendahl,45M.W. Gr¨unewald,26
T. Guillemin,13 G. Gutierrez,45P. Gutierrez,67 J. Haley,68 L. Han,4 K. Harder,41 A. Harel,63 J.M. Hauptman,52
J. Hays,40 T. Head,41 T. Hebbeker,18 D. Hedin,47 H. Hegab,68 A.P. Heinson,43 U. Heintz,69 C. Hensel,1
I. Heredia-De La Cruzd,28 K. Herner,45G. Heskethf,41 M.D. Hildreth,51 R. Hirosky,73T. Hoang,44 J.D. Hobbs,64
B. Hoeneisen,9 J. Hogan,72 M. Hohlfeld,21J.L. Holzbauer,58 I. Howley,70 Z. Hubacek,7, 15 V. Hynek,7 I. Iashvili,62
Y. Ilchenko,71 R. Illingworth,45 A.S. Ito,45 S. Jabeen,69 M. Jaffr´e,13A. Jayasinghe,67 M.S. Jeong,27 R. Jesik,40
P. Jiang,4 K. Johns,42 E. Johnson,57 M. Johnson,45 A. Jonckheere,45 P. Jonsson,40J. Joshi,43 A.W. Jung,45
A. Juste,36 E. Kajfasz,12D. Karmanov,33 I. Katsanos,59R. Kehoe,71 S. Kermiche,12N. Khalatyan,45A. Khanov,68
A. Kharchilava,62 Y.N. Kharzheev,31 I. Kiselevich,32J.M. Kohli,23 A.V. Kozelov,34 J. Kraus,58 A. Kumar,62
A. Kupco,8 T. Kurˇca,17 V.A. Kuzmin,33S. Lammers,49 P. Lebrun,17 H.S. Lee,27 S.W. Lee,52W.M. Lee,45 X. Lei,42
J. Lellouch,14 D. Li,14H. Li,73L. Li,43 Q.Z. Li,45 J.K. Lim,27 D. Lincoln,45 J. Linnemann,57 V.V. Lipaev,34
R. Lipton,45 H. Liu,71 Y. Liu,4 A. Lobodenko,35 M. Lokajicek,8 R. Lopes de Sa,64 R. Luna-Garciag,28
A.L. Lyon,45A.K.A. Maciel,1 R. Madar,19 R. Maga˜na-Villalba,28S. Malik,59V.L. Malyshev,31 J. Mansour,20
J. Mart´ınez-Ortega,28R. McCarthy,64 C.L. McGivern,41 M.M. Meijer,29, 30 D. Meisterm,46 A. Melnitchouk,45
D. Menezes,47 P.G. Mercadante,3 M. Merkin,33 A. Meyer,18 J. Meyeri,20 F. Miconi,16 N.K. Mondal,25
M. Mulhearn,73 E. Nagy,12M. Narain,69R. Nayyar,42H.A. Neal,56 J.P. Negret,5 P. Neustroev,35H.T. Nguyen,73
T. Nunnemann,22 J. Orduna,72N. Osman,12 J. Osta,51 A. Pal,70 N. Parashar,50 V. Parihar,69S.K. Park,27
R. Partridgee,69 N. Parua,49A. Patwaj,65 B. Penning,45M. Perfilov,33 Y. Peters,41 K. Petridis,41G. Petrillo,63
P. P´etroff,13M.-A. Pleier,65 V.M. Podstavkov,45A.V. Popov,34 M. Prewitt,72 D. Price,41 N. Prokopenko,34
J. Qian,56 A. Quadt,20 B. Quinn,58 P.N. Ratoff,39 I. Razumov,34 I. Ripp-Baudot,16 F. Rizatdinova,68
M. Rominsky,45 A. Ross,39 C. Royon,15 P. Rubinov,45 R. Ruchti,51 G. Sajot,11 A. S´anchez-Hern´andez,28
M.P. Sanders,22 A.S. Santosh,1 G. Savage,45 L. Sawyer,54 T. Scanlon,40R.D. Schamberger,64Y. Scheglov,35
H. Schellman,48 C. Schwanenberger,41R. Schwienhorst,57 J. Sekaric,53 H. Severini,67 E. Shabalina,20 V. Shary,15
S. Shaw,57 A.A. Shchukin,34 V. Simak,7 P. Skubic,67 P. Slattery,63 D. Smirnov,51 G.R. Snow,59 J. Snow,66
S. Snyder,65 S. S¨oldner-Rembold,41L. Sonnenschein,18K. Soustruznik,6 J. Stark,11 D.A. Stoyanova,34M. Strauss,67
L. Suter,41 P. Svoisky,67 M. Titov,15 V.V. Tokmenin,31 Y.-T. Tsai,63D. Tsybychev,64B. Tuchming,15 C. Tully,61
L. Uvarov,35 S. Uvarov,35 S. Uzunyan,47 R. Van Kooten,49 W.M. van Leeuwen,29 N. Varelas,46 E.W. Varnes,42
I.A. Vasilyev,34A.Y. Verkheev,31 L.S. Vertogradov,31M. Verzocchi,45 M. Vesterinen,41 D. Vilanova,15 P. Vokac,7
H.D. Wahl,44 M.H.L.S. Wang,45 J. Warchol,51 G. Watts,74 M. Wayne,51 J. Weichert,21 L. Welty-Rieger,48
M.R.J. Williams,49 G.W. Wilson,53 M. Wobisch,54 D.R. Wood,55 T.R. Wyatt,41 Y. Xie,45 R. Yamada,45
S. Yang,4 T. Yasuda,45 Y.A. Yatsunenko,31 W. Ye,64 Z. Ye,45 H. Yin,45 K. Yip,65 S.W. Youn,45 J.M. Yu,56
J. Zennamo,62 T.G. Zhao,41 B. Zhou,56 J. Zhu,56 M. Zielinski,63 D. Zieminska,49 and L. Zivkovic14
1LAFEX, Centro Brasileiro de Pesquisas F´ısicas, Rio de Janeiro, Brazil 2Universidade do Estado do Rio de Janeiro, Rio de Janeiro, Brazil
3Universidade Federal do ABC, Santo Andr´e, Brazil
4University of Science and Technology of China, Hefei, People’s Republic of China 5Universidad de los Andes, Bogot´a, Colombia
6Charles University, Faculty of Mathematics and Physics, Center for Particle Physics, Prague, Czech Republic 7Czech Technical University in Prague, Prague, Czech Republic
8Institute of Physics, Academy of Sciences of the Czech Republic, Prague, Czech Republic 9Universidad San Francisco de Quito, Quito, Ecuador
10LPC, Universit´e Blaise Pascal, CNRS/IN2P3, Clermont, France 11LPSC, Universit´e Joseph Fourier Grenoble 1, CNRS/IN2P3,
Institut National Polytechnique de Grenoble, Grenoble, France 12CPPM, Aix-Marseille Universit´e, CNRS/IN2P3, Marseille, France
13LAL, Universit´e Paris-Sud, CNRS/IN2P3, Orsay, France 14LPNHE, Universit´es Paris VI and VII, CNRS/IN2P3, Paris, France
15CEA, Irfu, SPP, Saclay, France
16IPHC, Universit´e de Strasbourg, CNRS/IN2P3, Strasbourg, France
17IPNL, Universit´e Lyon 1, CNRS/IN2P3, Villeurbanne, France and Universit´e de Lyon, Lyon, France 18III. Physikalisches Institut A, RWTH Aachen University, Aachen, Germany
19Physikalisches Institut, Universit¨at Freiburg, Freiburg, Germany
20II. Physikalisches Institut, Georg-August-Universit¨at G¨ottingen, G¨ottingen, Germany 21Institut f¨ur Physik, Universit¨at Mainz, Mainz, Germany
22Ludwig-Maximilians-Universit¨at M¨unchen, M¨unchen, Germany 23Panjab University, Chandigarh, India
24Delhi University, Delhi, India
25Tata Institute of Fundamental Research, Mumbai, India 26University College Dublin, Dublin, Ireland
27Korea Detector Laboratory, Korea University, Seoul, Korea 28CINVESTAV, Mexico City, Mexico
29Nikhef, Science Park, Amsterdam, The Netherlands 30Radboud University Nijmegen, Nijmegen, The Netherlands
31Joint Institute for Nuclear Research, Dubna, Russia 32Institute for Theoretical and Experimental Physics, Moscow, Russia
33Moscow State University, Moscow, Russia 34Institute for High Energy Physics, Protvino, Russia 35Petersburg Nuclear Physics Institute, St. Petersburg, Russia
36Instituci´o Catalana de Recerca i Estudis Avan¸cats (ICREA) and Institut de F´ısica d’Altes Energies (IFAE), Barcelona, Spain 37Uppsala University, Uppsala, Sweden
38Taras Shevchenko National University of Kyiv, Kiev, Ukraine 39Lancaster University, Lancaster LA1 4YB, United Kingdom 40Imperial College London, London SW7 2AZ, United Kingdom 41The University of Manchester, Manchester M13 9PL, United Kingdom
42University of Arizona, Tucson, Arizona 85721, USA 43University of California Riverside, Riverside, California 92521, USA
44Florida State University, Tallahassee, Florida 32306, USA 45Fermi National Accelerator Laboratory, Batavia, Illinois 60510, USA
46University of Illinois at Chicago, Chicago, Illinois 60607, USA 47Northern Illinois University, DeKalb, Illinois 60115, USA
48Northwestern University, Evanston, Illinois 60208, USA 49Indiana University, Bloomington, Indiana 47405, USA 50Purdue University Calumet, Hammond, Indiana 46323, USA 51University of Notre Dame, Notre Dame, Indiana 46556, USA
52Iowa State University, Ames, Iowa 50011, USA 53University of Kansas, Lawrence, Kansas 66045, USA 54Louisiana Tech University, Ruston, Louisiana 71272, USA 55Northeastern University, Boston, Massachusetts 02115, USA
56University of Michigan, Ann Arbor, Michigan 48109, USA 57Michigan State University, East Lansing, Michigan 48824, USA
58University of Mississippi, University, Mississippi 38677, USA 59University of Nebraska, Lincoln, Nebraska 68588, USA 60Rutgers University, Piscataway, New Jersey 08855, USA 61Princeton University, Princeton, New Jersey 08544, USA 62State University of New York, Buffalo, New York 14260, USA
63University of Rochester, Rochester, New York 14627, USA 64State University of New York, Stony Brook, New York 11794, USA
65Brookhaven National Laboratory, Upton, New York 11973, USA 66Langston University, Langston, Oklahoma 73050, USA 67University of Oklahoma, Norman, Oklahoma 73019, USA 68Oklahoma State University, Stillwater, Oklahoma 74078, USA
69Brown University, Providence, Rhode Island 02912, USA 70University of Texas, Arlington, Texas 76019, USA 71Southern Methodist University, Dallas, Texas 75275, USA
72Rice University, Houston, Texas 77005, USA 73University of Virginia, Charlottesville, Virginia 22904, USA
74University of Washington, Seattle, Washington 98195, USA (Dated: 01/22/2014)
The production of top quark-antiquark pair events in p¯p collisions at√s = 1.96 TeV is studied as a function of the transverse momentum and absolute value of the rapidity of the top quarks as well as of the invariant mass of the t¯t pair. We select events containing an isolated lepton, a large imbalance in transverse momentum, and four or more jets with at least one jet identified as originating from a b quark. The data sample corresponds to 9.7 fb−1 of integrated luminosity recorded with the D0 detector during Run II of the Fermilab Tevatron Collider. Observed differential cross sections are consistent with standard model predictions.
PACS numbers: 14.65.Ha, 12.38.Qk, 13.85.Qk
I. INTRODUCTION
The top quark, discovered by the CDF and D0 experiments in 1995 [1, 2], is the heaviest of all ele-mentary particles in the standard model (SM), with a mass of 173.2 ± 0.9 GeV [3]. The production of top quark-antiquark pairs (t¯t) at the Fermilab Tevatron Collider is dominated by the quark-antiquark (q ¯q) annihilation process. The measurement of t¯t differential production cross sections provides a direct test of quan-tum chromodynamics (QCD), the theory of the strong interactions. Moreover, a precise modeling of QCD processes is vital in many searches for contributions from new phenomena, where differential top quark cross sections can be used to set constraints on new sources of physics. A detailed understanding of top quark production is also needed for measurements or searches where new particles decay to a t¯t pair, where other particles are produced in association with a t¯t pair, or where t¯t production is among the dominant backgrounds. An example of the importance of accurate modeling of QCD is given by the deviation observed in the charge asymmetry measurement in p¯p → t¯t
∗with visitors from aAugustana College, Sioux Falls, SD, USA, bThe University of Liverpool, Liverpool, UK,cDESY, Hamburg, Germany, dUniversidad Michoacana de San Nicolas de Hidalgo, Morelia, MexicoeSLAC, Menlo Park, CA, USA,fUniversity Col-lege London, London, UK,gCentro de Investigacion en Computa-cion - IPN, Mexico City, Mexico,hUniversidade Estadual Paulista, S˜ao Paulo, Brazil, iKarlsruher Institut f¨ur Technologie (KIT) -Steinbuch Centre for Computing (SCC), D-76128 Karlsrue, Ger-many,jOffice of Science, U.S. Department of Energy, Washington, D.C. 20585, USA,kAmerican Association for the Advancement of Science, Washington, D.C. 20005, USA andlKiev Institute for Nu-clear Research, Kiev, UkrainemETH Z˘rich, Z˘rich, Switzerland
production from SM predictions [4–7]. Such a difference could be due to the exchange of a new heavy mediator, e.g., an axigluon [8, 9] that could also enhance the t¯t cross section. Differential cross sections, most notably the one as a function of the invariant mass of the t¯t pair dσ/dm(t¯t), provide stringent constraints on axigluon models [10]. Differential t¯t production cross sections have been previously measured at both the Tevatron [10, 11] and the LHC [12, 13]. The earlier measurements of differential t¯t production at the Tevatron as a function of the transverse momentum of the t and ¯t quark (ptopT )
[11], and as a function of m(t¯t) [10], showed good agree-ment with perturbative QCD (pQCD) calculations at next-to-leading (NLO), as well as next-to-next-to-leading order (NNLO) [14]. Compared to the previous D0 re-sult [11], the current measurement employs a factor of 10 more data allowing for higher precision tests of pQCD.
Single differential cross sections are measured as a function of m(t¯t), the absolute value of the rapidity1
|ytop|, and ptop
T , using events with a topology
consis-tent with t¯t decays. The index “top” in |ytop| and ptop T
refers to either t or ¯t quarks. The observed t and ¯t differential distributions are consistent with each other, hence they are combined. Events are selected in the lep-ton+jets decay channel, where the lepton (ℓ) refers to ei-ther an electron or a muon. This channel corresponds to t¯t → W+bW−¯b decays, where one of the two W bosons
decays leptonically (W → ℓν), and the other
hadroni-1The rapidity y is defined as y = 1/2 · ln[(E +p
z)/(E −pz)], where E is the energy of a particle and pz is the z component of its momentum vector ~p. The direction of the z axis is defined along the proton beam direction.
cally (W → q¯q′). This decay channel includes also small
contributions from electrons and muons stemming from the decay of τ leptons (t → W b → τντb → ℓνℓντb). The
events are required to contain, in addition to the lepton, at least four jets and an imbalance in transverse momen-tum 6ET, as discussed in Sec. IV.
II. MONTE CARLO SIMULATIONS AND QCD
PREDICTIONS
Monte Carlo (MC) simulations are used to model the reconstruction of the observables, to estimate systematic uncertainties associated with the measurements, and to simulate physics processes. Different MC event gener-ators are used to implement hard scattering processes based on leading-order (LO) and NLO QCD calcula-tions, and are complemented with parton shower evo-lution. To simulate detector effects, generated events (including hadronization) are passed through a detailed simulation of the D0 detector response based on geant3 [15]. To account for effects from additional overlapping p¯p interactions, events without any trigger requirements are selected randomly in collider data and overlaid on the fully simulated MC events.
The t¯t samples are generated with mc@nlo version 3.4 [16], which includes the production of off-shell top quarks by taking into account their finite width or with alpgen version 2.11 [17], which produces only on-shell top quarks. Single top quark production (q ¯q′ → t¯b, q′g →
tq¯b) is modeled using comphep [18]. For events gener-ated with mc@nlo, the parton showering is performed with herwig version 6.510 [19], whereas for alpgen and comphep parton showering is implemented by pythia version 6.409 [20]. In the following the term “scale” and the symbol µ refer to the renormalization and factoriza-tion scales, which are assumed to be equal and evaluated for the specific processes. The parton density functions (PDF), and other choices made in generating simulated events are summarized in Table I. For all the MC simula-tions involving the generation of top quarks a top quark mass of mt= 172.5 GeV is used. The difference from
the current Tevatron top quark mass measurement of 173.2 GeV [3] has negligible impact on the analysis and is treated as a systematic uncertainty (see Sec. IX).
Several QCD predictions for differential t¯t cross sec-tions have been calculated at higher orders than those included in the MC generators. They use approximate NNLO calculations based on next-to-next-to-leading logarithm (NNLL) resummation for mt= 173 GeV to
calculate the ptopT and |ytop| differential distributions
[14, 23], and mt= 172.5 GeV to calculate the m(t¯t)
and ptopT differential distributions [24]. All use the MSTW2008NNLO PDF [25]. The scale used to calcu-late the ptopT and |ytop| differential distributions is mt.
Employing mt as the scale for calculating the m(t¯t)
dis-tribution leads to large and negative NLO corrections that result in negative differential cross sections at
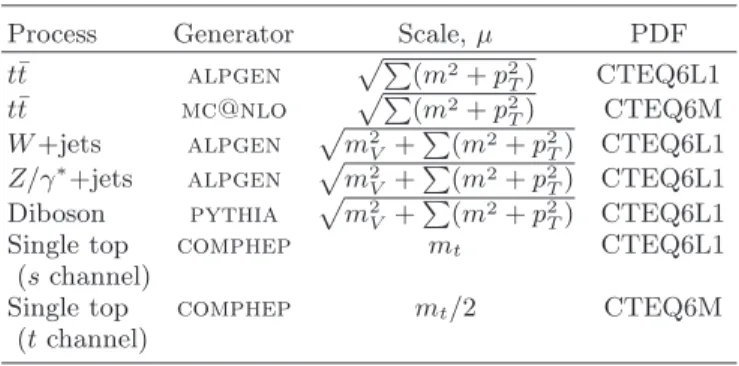
ap-TABLE I: Details of the signal and background modeling em-ployed in this measurement. All final-state particles are used to compute the chosen scale, except the decay products of the W boson, and are consequently used to calculate the mass m and pT. The term mV refers to the mass of the W or Z boson. The CTEQ6L1 [21] and CTEQ6M [22] PDFs are used.
Process Generator Scale, µ PDF
t¯t alpgen pP(m2+ p2 T) CTEQ6L1 t¯t mc@nlo pP(m2+ p2 T) CTEQ6M W +jets alpgen pm2 V +P(m2+ p2T) CTEQ6L1 Z/γ∗+jets alpgen pm2 V +P(m2+ p 2 T) CTEQ6L1 Diboson pythia pm2 V +P(m2+ p2T) CTEQ6L1
Single top comphep mt CTEQ6L1
(s channel)
Single top comphep mt/2 CTEQ6M
(t channel)
proximate NNLO, especially at large m(t¯t). In Ref. [24], the m(t¯t) distribution is calculated using the scale m(t¯t) instead, which avoids this issue, but leads to a 7.7% lower inclusive cross section.
When comparing to D0 data, we normalize the total cross section of the calculations in Ref. [24] for the ptopT
and m(t¯t) distributions to match the inclusive fully re-summed NNLL at NNLO QCD calculation (using mt=
172.5 GeV and the MSTW2008NNLO PDF), which finds σres
tot= 7.35+0.23−0.27(scale + pdf) pb [26]. The total cross
section of the approximate NNLO calculation as in Ref. [14, 23] is calculated from the ptopT distribution and yields
7.08+0.20−0.24(scale)+0.36−0.27(PDF) pb. The inclusive cross sec-tion calculated by integrating the |ytop| or ptop
T
distribu-tion deviates by 1.1%. For reasons of consistency, the ptopT and |ytop| distributions from Refs. [14, 23] are not
rescaled from their original predictions.
A. Backgrounds
The main background to t¯t in the ℓ+jets final state is W +jets production. It consists of events where one W boson is produced via an electroweak interaction, to-gether with additional partons from QCD processes. The W +jets final state can be split into four subsamples ac-cording to parton flavor: W b¯b+jets, W c¯c+jets, W c+jets and W +light jets, where light refers to gluons, u, d or s quarks. The LO alpgen cross sections are corrected for NLO effects as provided by mcfm [27]: the W + jets cross section is multiplied by 1.30, and the W b¯b+jets and W c¯c+ jets (W c + jets) cross sections are multiplied by an additional 1.5 (1.3). The pT distribution of the W boson
in MC simulation is reweighted to match the product of the pT distribution of the Z boson measured in D0 data
[28] and the SM ratio of these two distributions, which was calculated at NLO using resbos [29].
pro-duction, which include Z bosons decaying to electron, muon or tau pairs. The LO alpgen predictions are similarly corrected using the NLO calculation of mcfm. The Z/γ∗+jets cross section is multiplied by 1.3, and the
Zc¯c + jets and Zb¯b + jets cross sections by an additional 1.7 and 1.5, respectively. The simulated pT distribution
of the Z boson is reweighted to match the measured pT
distribution in Z → ℓℓ [28].
The single top quark background consists of s- and t-channel single top quark productions, which are normal-ized to the NLO cross sections of 1.04 and 2.26 pb [30], respectively. As the single top quark background yields only a few events passing all selection criteria described later, no effects are considered from the dependence of this background on mt.
Diboson production (W W , W Z and ZZ bosons) pro-cesses are normalized to NLO cross sections, calculated with mcfm, of 11.6 pb, 3.3 pb and 1.3 pb, respectively.
III. THE D0 DETECTOR
The D0 detector [31] consists of several subdetectors designed for identification and reconstruction of the prod-ucts of p¯p collisions. A silicon microstrip tracker (SMT) [32, 33] and central fiber tracker surround the interaction region for pseudorapidities2 |η| < 3 and |η| < 2.5,
re-spectively. These elements of the central tracking system are located within a superconducting solenoidal magnet generating a 1.9 T field, providing measurements for re-constructing event vertices and trajectories of charged particles. The SMT allows for a precision of 40 µm or better for the reconstructed primary p¯p interaction vertex (PV) in the plane transverse to the beam direction. The impact parameter of typical charged particle trajectories relative to the PV is determined with a precision between 20 and 50 µm depending on the number of SMT hits and particle momenta. The impact parameter and its measurement uncertainty are key components of lifetime-based identification of jets containing b quarks [34]. Par-ticle energies are measured using a liquid argon sampling calorimeter that is segmented into a central calorimeter covering |η| < 1.1, and two end calorimeters extending the coverage to |η| = 4.2. Outside of the calorimetry, trajectories of muons are measured using three layers of tracking detectors and scintillation trigger counters, and an iron toroidal magnet generating a 1.8 T field between the first two layers. Plastic scintillator arrays are located in front of the end-calorimeter cryostats to measure the luminosity [35].
2 The pseudorapidity η = − ln [tan(θ/2)] is measured relative to the center of the detector, and θ is the polar angle with respect to the proton beam direction.
IV. EVENT SELECTION
This analysis uses all the data recorded by the D0 de-tector at √s = 1.96 TeV. After applying data quality requirements, the data correspond to an integrated lu-minosity of 9.7 fb−1. The trigger selects ℓ+jets events
by requiring at least one lepton (electron or muon) with an efficiency of 95% or 80% for t¯t events containing an electron or muon candidate, respectively.
Accepted events must have a reconstructed PV within 60 cm of the center of the detector along the beam axis, one lepton with transverse momentum pT > 20 GeV
and |η| < 1.1 (for electrons) or |η| < 2 (for muons), and 6ET > 20 GeV. The measurement of 6ET is based on
calorimetry. In addition, leptons are required to origi-nate from the PV by demanding |∆z(ℓ, PV)| < 1 cm. A distance ∆R =p∆η2+ ∆φ2between a lepton and a jet
of ∆R(ℓ, closest jet) > 0.5 is required to ensure that lep-tons are isolated [36, 37]. For the µ+jets sample upper limits on the transverse mass of the reconstructed W bo-son of MW
T < 250 GeV and 6ET < 250 GeV are applied
to remove events in data with misreconstructed muon pT. To further remove such events, we employ an
addi-tional requirement on the significance of the track cur-vature Sc, which is defined as the ratio of the curvature,
κ, and the expected uncertainty on κ measured for the track associated with the muon. We employ two selec-tion requirements with different slopes in the azimuthal (∆φ) vs Scplane: (−70 + 25.47 · ∆φ(µ, 6ET)) < |Sc| and
(−8.76 + 4.38 · ∆φ(µ, 6ET)) < |Sc|. Figure 1(a) shows
these requirements indicated by the solid lines in the |Sc| versus ∆φ(µ, 6ET) plane for t¯t events and 1(b)
for W +jets background events. The cut on Sc
re-moves low momentum muons misreconstructed at high momenta while keeping 97% of the leptons stemming from t¯t decays. A minimum separation in azimuth of ∆φ(ℓ, 6ET) > 0.5 is imposed between the direction of the
lepton and the direction of the missing momentum, to reduce multijet background caused by the misidentifica-tion of a jet as a lepton and the consequent impact on the accompanying 6ET. Further reduction of the
mul-tijet background is achieved by requiring an additional minimum separation in azimuth between the isolated lepton and 6ET: ∆φ(e, 6ET) > 2.2 − 0.045 · 6ET/GeV and
∆φ(µ, 6ET) > 2.1 − 0.035 · 6ET/GeV. After correcting the
energy of the jet to the particle level [38] at least four jets with pT > 20 GeV and |η| < 2.5 are required. The jet
with highest pT is also required to have pT > 40 GeV.
Because of the high instantaneous luminosity provided by the Tevatron, additional p¯p collisions may occur within the same bunch crossing. As noted above, events from randomly selected beam crossings with the same instantaneous luminosity are overlaid on the simulated events, which are reweighted to match the luminosity profile observed in data. To suppress jets from these additional collisions, jets are required to contain two tracks consistent with originating from the PV. At least one of the jets must be selected as
0 5 10 15 20 25 30 35 40 0 0.5 1 1.5 2 2.5 3 0 20 40 60 80 100 (a) PSfrag replacements DØ L = 9.7 fb−1 DØ L = 9.7 fb−1 DØ MC ptop T [GeV] dσ/dptop T [pb/GeV] |ytop| dσ/d|ytop| [pb] m(t¯t) [GeV] dσ/dm(t¯t) [pb/GeV] ET[GeV] Njet Lepton pT[GeV] HT[GeV] χ2 m(t¯t) [GeV] |ytop| ptop T [GeV] |Sc| ∆ φ (µ ,E T ) [r a d ] 0 5 10 15 20 25 30 35 40 0 0.5 1 1.5 2 2.5 3 0 2 4 6 8 10 12 14 16 (b) PSfrag replacements DØ L = 9.7 fb−1 DØ L = 9.7 fb−1 DØ MC ptop T [GeV] dσ/dptop T [pb/GeV] |ytop| dσ/d|ytop| [pb] m(t¯t) [GeV] dσ/dm(t¯t) [pb/GeV] ET[GeV] Njet Lepton pT[GeV] HT[GeV] χ2 m(t¯t) [GeV] |ytop| ptop T [GeV] |Sc| ∆ φ (µ ,E T ) [r a d ]
FIG. 1: The |Sc| versus ∆φ(µ, 6ET) plane for (a) t¯t events and (b) for W +jets background events. The selection requirements are indicated by the solid lines.
likely to originate from a b quark (b tagged) using a multivariate discriminant (MVD) [34]. The discriminant combines variables that characterize the presence and properties of secondary vertices and tracks within jets. The MVD identification of jets containing b quarks has an efficiency of approximately 60%, with a light quark misidentification rate of approximately 1.2%. Events containing more than one isolated muon or electron, which satisfy the lepton requirements discussed above, are rejected.
V. SAMPLE COMPOSITION
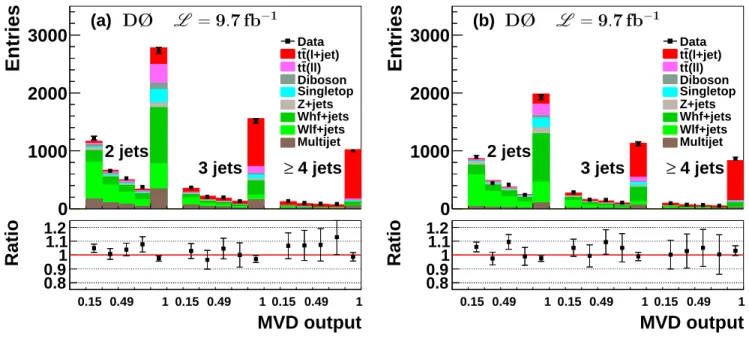
Background contributions are categorized into instru-mental background and irreducible background from processes with final states similar to t¯t. Instrumental background is due to multijet processes where a jet is misidentified as an electron in the e+jets channel, or when a muon originating from the semileptonic decay of a heavy hadron appears to be isolated in the µ+jets channel. Data-driven [39, 40] and MC simula-tion methods are employed to model the instrumental background. The irreducible background processes are estimated using MC simulations described in Sec. II. Most of this background arises from W +jets production, and to constrain it we use the ℓ + 2 jets and ℓ + 3 jets data (dominated by W +jets production) in addition to the ℓ+ ≥ 4 jets sample (dominated by t¯t production). We determine the sample composition from a simulta-neous fit for the t¯t cross section and the heavy-flavor contribution originating from W +jets. The fit is made to the MVD b identification output distribution; Fig. 2 shows the distribution after applying the fit results for the ℓ + 2 jets, ℓ + 3 jets and ℓ+ ≥ 4 jets data sample in the 2(a) e+jets and 2(b) µ+jets decay channel. The simultaneous fit yields a W +jets heavy-flavor scale factor sWHF
fit = 0.89 ±0.08 to be applied to the W b¯b+jets
and W c¯c + jets contributions in addition to the factors
discussed in Sec. II. Similar procedures were used in previous measurements by D0 [40]. The simultaneous fit to the ℓ + 2 jets, ℓ + 3 jets and ℓ+ ≥ 4 jets samples yields a t¯t cross section of σt¯t
fit = 8.00 ± 0.40 (stat.)
pb. We verified that there is no need for an additional scale factor to accommodate the Z/γ∗+jets heavy-flavor
contributions sZHF
fit by using a modified version of the
simultaneous fit taking into account sZHF
fit instead of
sWHF
fit . The σ t¯t
fit serves as an initial value of the t¯t cross
section in the t¯t differential cross section measurement using inclusive four-jet data.
The total inclusive t¯t cross section is also calculated using only events with at least four jets from the three differential distributions by integrating all bins of each of the cross section distributions, as presented below in Sec. VIII and average the resulting three inclusive cross sections as discussed in Sec. X. This yields a compatible value of σ(p¯p → t¯t) = 8.0 ± 0.7 (stat.) ± 0.8 (syst.) pb. The t¯t contributions in the following plots are derived employing mc@nlo simulated events normalized to this measured inclusive t¯t cross section of 8.0 pb.
Figures 3 and 4 demonstrate, respectively, the qual-ity of the modeling of the selected events in the e+jets and µ+jets sample with the background and signal con-tributions. The signal contribution is derived employing mc@nlo simulated events normalized to the measured inclusive t¯t cross section of 8.0 pb. The expected com-position of the sample after the final selection is given in Table II.
VI. EXTRACTION OF THE SIGNAL
To reconstruct the four-vectors of the full t¯t decay chain, t¯t → W+b + W−¯b → (q¯q′)b + (ℓν)¯b, we use a
constrained kinematic reconstruction algorithm [41] that takes into account experimental resolutions. In total the algorithm uses 18 parameters based on the measurements of jets, leptons and 6ET. The masses of the W boson and
Entries
0
1000
2000
3000
Data (l+jet) t t (ll) t t Diboson Singletop Z+jets Whf+jets Wlf+jets Multijet(a)
2 jets
3 jets
≥
4 jets
MVD output
0.15 0.49 1 0.15 0.49 1 0.15 0.49 1Ratio
0.8
0.9
1
1.1
1.2
PSfrag replacements DØ L = 9.7 fb−1DØ
L = 9.7 fb
−1DØ MC
ptop T [GeV] dσ/dptop T [pb/GeV] |ytop| dσ/d|ytop| [pb] m(t¯t) [GeV] dσ/dm(t¯t) [pb/GeV] ET[GeV] Njet Lepton pT[GeV] HT[GeV] χ2 m(t¯t) [GeV] |ytop| ptop T [GeV]|S
c|
∆φ(µ, E
T) [rad]
Entries
0
1000
2000
3000
Data (l+jet) t t (ll) t t Diboson Singletop Z+jets Whf+jets Wlf+jets Multijet(b)
2 jets
3 jets
≥
4 jets
MVD output
0.15 0.49 1 0.15 0.49 1 0.15 0.49 1Ratio
0.8
0.9
1
1.1
1.2
PSfrag replacements DØ L = 9.7 fb−1DØ
L = 9.7 fb
−1DØ MC
ptop T [GeV] dσ/dptop T [pb/GeV] |ytop| dσ/d|ytop| [pb] m(t¯t) [GeV] dσ/dm(t¯t) [pb/GeV] ET[GeV] Njet Lepton pT[GeV] HT[GeV] χ2 m(t¯t) [GeV] |ytop| ptop T [GeV]|S
c|
∆φ(µ, E
T) [rad]
FIG. 2: Distributions of the MVD b identification output distribution for the ℓ + 2 jets, ℓ + 3 jets and ℓ+ ≥ 4 jets data sample in the (a) e+jets and (b) µ+jets decay channel. The data are compared to the sum of predicted contributions from signal and background processes. More details on how the sample composition is derived can be found in the text.
TABLE II: Expected number of events with at least four jets due to each process (uncertainties are statistical and system-atical added in quadrature). The sample composition is de-termined as discussed in Sec. V. Events in the t¯t dilepton decay channel are denoted by ℓℓ.
Process µ+jets e+jets
Multijet 31.1 ± 10.0 75.1 ± 56.3 W +jets 164.9 ± 15.9 148.8 ± 14.3 Diboson 9.1 ± 0.8 10.5 ± 0.9 Z/γ∗+jets 11.9 ± 1.2 12.4 ± 1.5 Single top 16.1 ± 2.2 21.8 ± 3.0 t¯t, ℓℓ 22.6 ± 2.0 33.5 ± 2.9 P bgs 254.4 ± 19.1 302.1 ± 58.3 t¯t, ℓ+jets 838.7 ± 72.5 1088.7 ± 94.2 P (sig + bgs) 1093.1 ± 75.0 1390.8 ± 110.8 Data 1137 1403
the t quark are fixed to 80.4 GeV and 172.5 GeV, respec-tively. The 6ET provides the initial estimate for the pT of
the neutrino. The longitudinal momentum pz(ν) is
esti-mated by constraining the mass of the W boson decay products to 80.4 GeV. This yields a quadratic equation in pz(ν) with two solutions. These solutions, together
with the 12 possible jet-quark assignments yield 24 pos-sible solutions to the kinematic reconstruction algorithm. The large number of solutions is reduced by assigning b-tagged jets to b quarks. The solution with the best χ2
for assigning the reconstructed objects to the parton-level quantities serves as the input to the unfolding (see Sec.
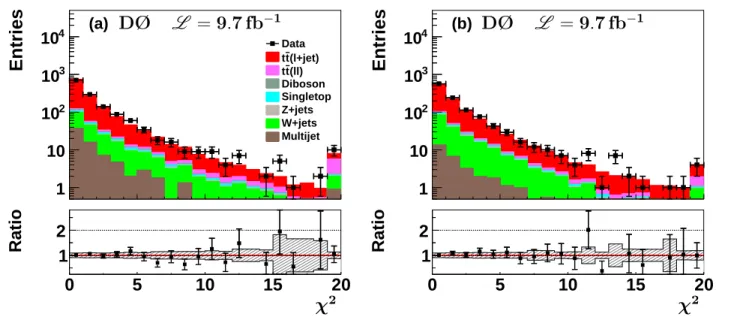
VII). This solution corresponds to the correct assignment of the jets to the quarks from the t¯t decay in MC events in 80% of the cases. The observed and expected distri-butions in χ2 are compared in Fig. 5.
The modeling of signal and background processes is ver-ified through a comparison of the data to the number of expected t¯t signal events and the sum of all background contributions. The expected t¯t contribution is derived employing mc@nlo simulated events normalized to the measured inclusive cross section of 8.0 pb. Figures 6– 8 show the reconstructed m(t¯t), |ytop|, and ptop
T
distri-butions before unfolding. The |ytop| and ptop
T
distribu-tions include both W → ℓν and W → q¯q′ decay modes
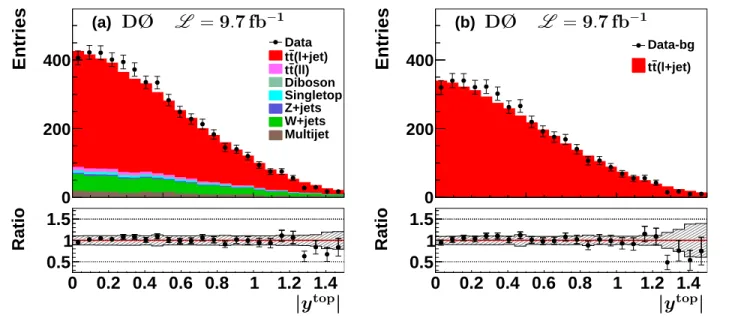
(two entries per event). The resolutions in the two decay modes are similar; hence they are combined. The distri-butions in (a) of Figs. 6–8 show the data compared to the t¯t signal and background processes, while (b) shows the background-subtracted data. The data and its de-scription by the sum of signal and background processes agree within uncertainties.
VII. MEASUREMENT TECHNIQUE
Measurements involving top quarks benefit from the very short lifetime of the t quark, since it decays before it can hadronize. Effects of hadronization and QCD corrections are thus reduced. Moreover, at Tevatron energies the transverse momentum of t¯t pairs is almost always smaller than m(t¯t) and production is central, so that almost the entire phase space of t¯t production is within the detector acceptance. Corrections to measured
Entries
1
10
210
310
410
(a)
Data (l+jet) t t (ll) t t Diboson Singletop Z+jets W+jets Multijet4
5
6
7
8
Ratio
0.5
1
1.5
2
PSfrag replacementsDØ
L = 9.7 fb
−1DØ
L = 9.7 fb
−1p
topT[GeV]
dσ/dp
topT[pb/GeV]
|y
top|
dσ/d|y
top| [pb]
m(t¯
t) [GeV]
dσ/dm(t¯
t) [pb/GeV]
E
T[GeV]
N
jetLepton p
T[GeV]
H
T[GeV]
χ
2m(t¯
t) [GeV]
|y
top|
p
topT[GeV]
Entries
0
100
200
(b)
0
100
200
300
400
500
Ratio
0.5
1
1.5
2
PSfrag replacementsDØ
L = 9.7 fb
−1DØ
L = 9.7 fb
−1p
topT[GeV]
dσ/dp
topT[pb/GeV]
|y
top|
dσ/d|y
top| [pb]
m(t¯
t) [GeV]
dσ/dm(t¯
t) [pb/GeV]
E
T[GeV]
N
jetLepton p
T[GeV]
H
T[GeV]
χ
2m(t¯
t) [GeV]
|y
top|
p
topT[GeV]
Entries
0
50
100
150
(c)
0
50
100
150
Ratio
0.5
1
1.5
2
PSfrag replacementsDØ
L = 9.7 fb
−1DØ
L = 9.7 fb
−1p
topT[GeV]
dσ/dp
topT[pb/GeV]
|y
top|
dσ/d|y
top| [pb]
m(t¯
t) [GeV]
dσ/dm(t¯
t) [pb/GeV]
6E
T[GeV]
N
jetLepton p
T[GeV]
H
T[GeV]
χ
2m(t¯
t) [GeV]
|y
top|
p
topT[GeV]
Entries
0
50
100
150
(d)
0
50
100
150
200
Ratio
0.5
1
1.5
2
PSfrag replacementsDØ
L = 9.7 fb
−1DØ
L = 9.7 fb
−1p
topT[GeV]
dσ/dp
topT[pb/GeV]
|y
top|
dσ/d|y
top| [pb]
m(t¯
t) [GeV]
dσ/dm(t¯
t) [pb/GeV]
E
T[GeV]
N
jetLepton p
T[GeV]
H
T[GeV]
χ
2m(t¯
t) [GeV]
|y
top|
p
topT[GeV]
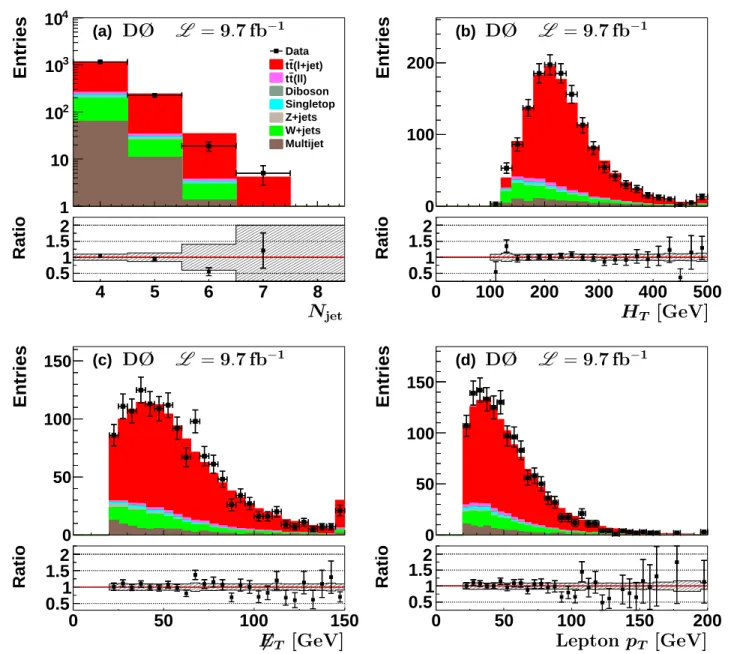
FIG. 3: Distributions of (a) the number of jets, (b) the scalar sum of the pT values of the lepton and jets, (c) 6ET, and (d) lepton pT for the e+jets final state. The data are compared to the sum of predicted contributions from signal and background processes. The signal contribution is derived employing mc@nlo simulated events normalized to the measured inclusive t¯t cross section of 8.0 pb. The highest bin in the histograms is used as an overflow bin. The ratios of data to the sum of the signal and all background contributions are shown in the panels below the distributions. The bands show the 1 s.d. combined systematic uncertainties on the sum of the signal and background contributions.
quantities as well as their uncertainties are therefore small, leading to well measured top-quark cross sections. The differential cross sections are defined for parton-level top quarks including off-shell effects and are cor-rected for detector and QCD effects using a regularized matrix unfolding procedure [42, 43]. This procedure re-duces the influence of model dependencies in the cross section determination and introduces correlations among the bins used in the measurement. These correlations are minimized by regularization. Unfolding event
migra-tions relies on a migration matrix (A), which describes the relation between the generated distribution of a vari-able (~xgen) and its reconstructed distribution (~yrec) as
A~xgen= ~yrec. Each matrix element Aijis the probability
for an event originating from bin j of ~xgento be measured
in bin i of ~yrec. The migration matrix is based on the
simulation of the D0 detector. The reconstruction-level bins used in the migration matrix are twice as narrow as the generator level bins, in order to provide detailed in-formation on the bin-to-bin migrations, and improve the accuracy of the unfolding [44]. The generated
distribu-Entries
1
10
210
310
410
(a)
Data (l+jet) t t (ll) t t Diboson Singletop Z+jets W+jets Multijet4
5
6
7
8
Ratio
0.5
1
1.5
2
PSfrag replacementsDØ
L = 9.7 fb
−1DØ
L = 9.7 fb
−1p
topT[GeV]
dσ/dp
topT[pb/GeV]
|y
top|
dσ/d|y
top| [pb]
m(t¯
t) [GeV]
dσ/dm(t¯
t) [pb/GeV]
E
T[GeV]
N
jetLepton p
T[GeV]
H
T[GeV]
χ
2m(t¯
t) [GeV]
|y
top|
p
topT[GeV]
Entries
0
50
100
150
200
(b)
0
100
200
300
400
500
Ratio
0.5
1
1.5
2
PSfrag replacementsDØ
L = 9.7 fb
−1DØ
L = 9.7 fb
−1p
topT[GeV]
dσ/dp
topT[pb/GeV]
|y
top|
dσ/d|y
top| [pb]
m(t¯
t) [GeV]
dσ/dm(t¯
t) [pb/GeV]
E
T[GeV]
N
jetLepton p
T[GeV]
H
T[GeV]
χ
2m(t¯
t) [GeV]
|y
top|
p
topT[GeV]
Entries
0
50
100
(c)
0
50
100
150
Ratio
0.5
1
1.5
2
PSfrag replacementsDØ
L = 9.7 fb
−1DØ
L = 9.7 fb
−1p
topT[GeV]
dσ/dp
topT[pb/GeV]
|y
top|
dσ/d|y
top| [pb]
m(t¯
t) [GeV]
dσ/dm(t¯
t) [pb/GeV]
6E
T[GeV]
N
jetLepton p
T[GeV]
H
T[GeV]
χ
2m(t¯
t) [GeV]
|y
top|
p
topT[GeV]
Entries
0
50
100
150
(d)
0
50
100
150
200
Ratio
0.5
1
1.5
2
PSfrag replacementsDØ
L = 9.7 fb
−1DØ
L = 9.7 fb
−1p
topT[GeV]
dσ/dp
topT[pb/GeV]
|y
top|
dσ/d|y
top| [pb]
m(t¯
t) [GeV]
dσ/dm(t¯
t) [pb/GeV]
E
T[GeV]
N
jetLepton p
T[GeV]
H
T[GeV]
χ
2m(t¯
t) [GeV]
|y
top|
p
topT[GeV]
FIG. 4: Distributions of (a) the number of jets, (b) the scalar sum of the pT values of the lepton and jets, (c) 6ET, and (d) lepton pT for the µ+jets final state. The data are compared to the sum of predicted contributions from signal and background processes. The signal contribution is derived employing mc@nlo simulated events normalized to the measured inclusive t¯t cross section of 8.0 pb. The highest bin in the histograms is used as an overflow bin. The ratios of data to the sum of the signal and all background contributions are shown in the panels below the distributions. The bands show the 1 s.d. combined systematic uncertainties on the sum of the signal and background contributions.
tion ~xgen can be estimated using A†, the pseudoinverse
[45] of the matrix A: ~xgen = A†~yrec. As with ordinary
matrix inversion, this results in large contributions that lack statistical significance. Such contributions can be minimized by imposing regularization, which leads to an effective cutoff of the insignificant terms. We employ reg-ularized unfolding as implemented in the tunfold pack-age [46]. The regularization is based on the derivative of the distribution and is done in twice as many bins as are used in the final results. An insufficient regularization admits fluctuations into the unfolded result, whereas
ex-cessive regularization overly biases the measurement to-ward the MC generated distribution. The value of the regularization strength is determined using the so-called L-curve approach [46] that balances the consistency of the unfolded data x with the initial data y against the scatter of x. The scatter of x can be caused by fluctu-ations in cases in which an insufficient regularization is chosen. A χ2 statistic measures the tension between x,
the data and the scatter of x. Within the earlier men-tioned bounds, a systematic uncertainty is derived for this procedure as discussed in Sec. IX E. The statistical
Entries
1
10
210
310
410
(a)
Data (l+jet) t t (ll) t t Diboson Singletop Z+jets W+jets Multijet0
5
10
15
20
Ratio
1
2
PSfrag replacementsDØ
L = 9.7 fb
−1DØ
L = 9.7 fb
−1p
topT[GeV]
dσ/dp
topT[pb/GeV]
|y
top|
dσ/d|y
top| [pb]
m(t¯
t) [GeV]
dσ/dm(t¯
t) [pb/GeV]
E
T[GeV]
N
jetLepton p
T[GeV]
H
T[GeV]
χ
2m(t¯
t) [GeV]
|y
top|
p
topT[GeV]
Entries
1
10
210
310
410
(b)
0
5
10
15
20
Ratio
1
2
PSfrag replacementsDØ
L = 9.7 fb
−1DØ
L = 9.7 fb
−1p
topT[GeV]
dσ/dp
topT[pb/GeV]
|y
top|
dσ/d|y
top| [pb]
m(t¯
t) [GeV]
dσ/dm(t¯
t) [pb/GeV]
E
T[GeV]
N
jetLepton p
T[GeV]
H
T[GeV]
χ
2m(t¯
t) [GeV]
|y
top|
p
topT[GeV]
FIG. 5: Distribution of χ2 for the best solution with lowest χ2 for the (a) e+jets and (b) µ+jets final states. The data are compared to the sum of predicted contributions from signal and background processes. The signal contribution is derived employing mc@nlo simulated events normalized to the measured inclusive t¯t cross section of 8.0 pb. The highest bin in the histograms is used as an overflow bin. The ratios of data to the sum of the signal and all background contributions are shown in the panels below the distributions. The bands show the 1 s.d. combined systematic uncertainties on the sum of the signal and background contributions.
uncertainties of the differential measurements are com-puted analytically with tunfold and verified using an ensemble of simulated pseudo–data sets. The covariance matrix is calculated by propagating the uncertainties of the reconstructed distribution ~yrecthrough the unfolding
process.
VIII. CROSS SECTION DETERMINATION
Equation (1) is used to calculate the differen-tial t¯t cross section σi as a function of the observable
X, where i denotes an individual bin, and ∆Xiits width.
dσi
dX =
Nunfold i
L · B · ∆Xi . (1)
The unfolded number of signal events Nunfold
i is corrected
for the branching fraction B into the ℓ+jets decay chan-nel of 0.342±0.02 [47] and used to obtain the cross section for the total integrated luminosity L that corresponds to the selection requirements, including data quality cuts. The branching fraction used in Eq. (1) includes elec-trons and muons originating from the decay of τ leptons. The number of expected background events is estimated through MC simulations and data-driven methods and is subtracted from data to determine Nunfold
i . The numbers
of background-subtracted events are corrected for effects due to limited detector resolution and efficiency by means
of the regularized matrix unfolding as discussed in Sec. VII. By using this procedure, the data are corrected for all detector effects including those from trigger, selection and b-tagging efficiencies and for the kinematic and geo-metric acceptance.
IX. SYSTEMATIC UNCERTAINTIES
Systematic uncertainties are assessed by varying the values of a specific parameter used in the modeling of the data, and repeating the analysis. Unless otherwise stated, the magnitude of the parameter modifications is obtained from alternative calibrations of the MC simu-lation. The migration matrix and the background con-tributions are extracted from these different MC mod-els, while the regularization strength is fixed to that for the nominal unfolded data. The difference between the nominal unfolded data and unfolded data, including a modification due to a specific parameter serves as the es-timate of an individual source of systematic uncertainty. Individual sources of systematic uncertainty are added in quadrature for each bin of a differential cross section. The largest uncertainties usually arise at large values of m(t¯t), |ytop|, or ptop
T , where there are fewer events. Table
III summarizes the systematic uncertainties on the inclu-sive and differential cross sections. Numbers stated in the column denoted with |δdiff| illustrate the size of the
sys-tematic uncertainties in individual bins of the differential measurements.
Entries
0
100
200
300
(a)
Data (l+jet) t t (ll) t t Diboson Singletop Z+jets W+jets Multijet0
200 400
600
800 1000 1200
Ratio
0.5
1
1.5
PSfrag replacementsDØ
L = 9.7 fb
−1DØ
L = 9.7 fb
−1p
topT[GeV]
dσ/dp
topT[pb/GeV]
|y
top|
dσ/d|y
top| [pb]
m(t¯
t) [GeV]
dσ/dm(t¯
t) [pb/GeV]
E
T[GeV]
N
jetLepton p
T[GeV]
H
T[GeV]
χ
2m(t¯
t) [GeV]
|y
top|
p
topT[GeV]
Entries
0
100
200
300
(b)
Data-bg (l+jet) t t0
200 400
600
800 1000 1200
Ratio
0.5
1
1.5
PSfrag replacementsDØ
L = 9.7 fb
−1DØ
L = 9.7 fb
−1p
topT[GeV]
dσ/dp
topT[pb/GeV]
|y
top|
dσ/d|y
top| [pb]
m(t¯
t) [GeV]
dσ/dm(t¯
t) [pb/GeV]
E
T[GeV]
N
jetLepton p
T[GeV]
H
T[GeV]
χ
2m(t¯
t) [GeV]
|y
top|
p
topT[GeV]
FIG. 6: Distribution of m(t¯t), (a) compared to the sum of predicted contributions from signal and background processes, and (b) the background-subtracted distribution. The signal contribution is derived employing mc@nlo simulated events normalized to the measured inclusive t¯t cross section of 8.0 pb. The lower panels indicate the ratio of the data to (a) the sum of the signal and all background processes, and (b) to the signal process only.
Entries
0
200
400
(a)
Data (l+jet) t t (ll) t t Diboson Singletop Z+jets W+jets Multijet0
0.2 0.4 0.6 0.8
1
1.2 1.4
Ratio
0.5
1
1.5
PSfrag replacementsDØ
L = 9.7 fb
−1DØ
L = 9.7 fb
−1p
topT[GeV]
dσ/dp
topT[pb/GeV]
|y
top|
dσ/d|y
top| [pb]
m(t¯
t) [GeV]
dσ/dm(t¯
t) [pb/GeV]
E
T[GeV]
N
jetLepton p
T[GeV]
H
T[GeV]
χ
2m(t¯
t) [GeV]
|y
top|
p
topT[GeV]
Entries
0
200
400
(b)
Data-bg (l+jet) t t0
0.2 0.4 0.6 0.8
1
1.2 1.4
Ratio
0.5
1
1.5
PSfrag replacementsDØ
L = 9.7 fb
−1DØ
L = 9.7 fb
−1p
topT[GeV]
dσ/dp
topT[pb/GeV]
|y
top|
dσ/d|y
top| [pb]
m(t¯
t) [GeV]
dσ/dm(t¯
t) [pb/GeV]
E
T[GeV]
N
jetLepton p
T[GeV]
H
T[GeV]
χ
2m(t¯
t) [GeV]
|y
top|
p
topT[GeV]
FIG. 7: Distribution of |ytop
|, (a) compared to the sum of predicted contributions from signal and background processes, and (b) the background-subtracted distribution. The signal contribution is derived employing mc@nlo simulated events normalized to the measured inclusive t¯t cross section of 8.0 pb. The lower panels indicate the ratio of the data to (a) the sum of the signal and all background processes, and (b) to the signal process only.
A. Modeling of signal
The effect of NLO corrections on the matrix el-ement for t¯t production is estimated by compar-ing t¯t events generated with mc@nlo+herwig to
those from alpgen+pythia. From a comparison of alpgen+pythiato alpgen+herwig, we find that the effects of hadronization uncertainties are less than those from the inclusion of higher-order effects. The top mass is varied within its uncertainty of ±1 GeV [3]. An addi-tional uncertainty on the signal arises from the relatively
Entries
0
200
400
600
(a)
Data (l+jet) t t (ll) t t Diboson Singletop Z+jets W+jets Multijet0
100
200
300
400
Ratio
0.5
1
1.5
PSfrag replacementsDØ
L = 9.7 fb
−1DØ
L = 9.7 fb
−1p
topT[GeV]
dσ/dp
topT[pb/GeV]
|y
top|
dσ/d|y
top| [pb]
m(t¯
t) [GeV]
dσ/dm(t¯
t) [pb/GeV]
E
T[GeV]
N
jetLepton p
T[GeV]
H
T[GeV]
χ
2m(t¯
t) [GeV]
|y
top|
p
topT[GeV]
Entries
0
200
400
600
(b)
Data-bg (l+jet) t t0
100
200
300
400
Ratio
0.5
1
1.5
PSfrag replacementsDØ
L = 9.7 fb
−1DØ
L = 9.7 fb
−1p
topT[GeV]
dσ/dp
topT[pb/GeV]
|y
top|
dσ/d|y
top| [pb]
m(t¯
t) [GeV]
dσ/dm(t¯
t) [pb/GeV]
E
T[GeV]
N
jetLepton p
T[GeV]
H
T[GeV]
χ
2m(t¯
t) [GeV]
|y
top|
p
topT[GeV]
FIG. 8: Distribution of ptopT , (a) compared to the sum of predicted contributions from signal and background processes, and (b) the background-subtracted distribution. The signal contribution is derived employing mc@nlo simulated events normalized to the measured inclusive t¯t cross section of 8.0 pb. The lower panels indicate the ratio of the data to (a) the sum of the signal and all background processes, and (b) to the signal process only.
TABLE III: Sources of systematic uncertainties. The uncer-tainty from each source on the inclusive cross section is given in the second column. Systematic uncertainties in the binned values of the differential cross sections vary within the range given in the last column.
Source of uncertainty Uncertainties, %
δincl |δdiff| Signal modeling +5.2/−4.4 4.0 – 14.2 PDF +3.0/−3.4 0.9 – 4.4 Detector modeling +4.0/−4.1 3.1 – 13.7 Sample composition ±1.8 2.8 – 9.2 Regularization strength ±0.2 0.8 – 2.1 Integrated luminosity ±6.1 6.1 – 6.1
Total systematic uncertainty +9.6/−9.3 8.5 – 23.1
poor modeling of the reconstructed transverse momen-tum of the t¯t pair pt¯t
T at D0 [4]. A systematic uncertainty
is estimated by reweighting the distribution of the recon-structed pt¯t
T in the MC simulation to the one observed in
D0 data.
B. Parton distributions functions
The uncertainty on the cross sections due to the uncer-tainty on PDFs is estimated following the procedure of Ref. [22] by reweighting the MC simulation according to each of the 20 pairs of error eigenvectors of the CTEQ6M
PDF, with their effects added in quadrature.
C. Modeling of detector
Uncertainties on the modeling of the detector include uncertainties on trigger efficiency, lepton identification and b-quark identification. The uncertainty on trigger efficiency is roughly 2.5% for harder collisions [ptopT > 90
GeV or m(t¯t) > 500 GeV] and 6% for softer collisions that are typically closer to trigger thresholds. The ptopT
and m(t¯t) differential cross sections are modified accord-ing to these uncertainties, and the |ytop| differential cross
section is rederived with trigger efficiencies reweighted according to ptopT . The identification efficiencies for b, c,
light quarks (u, d, s) and gluons in MC simulations are calibrated using dijet data [48], and variations within the calibration uncertainty are used to determine the systematic uncertainty due to b-quark identification. Additional uncertainties arise from track multiplicity requirements on the selected jets in the identification of b quarks.
Other instrumental uncertainties from modeling the detector arise from the calibration of the jet energy, reso-lution and efficiency. The jet energy scale (JES) corrects the measured energy of the jet to the energy of its con-stituent particles. The JES is derived using a quark-jet dominated γ + jet sample, and corrects for the differ-ence in detector response between data and simulation. An additional correction based on the single particle
re-sponse accounts for the different characteristics of quark and gluon jets. Jets in MC simulations have their trans-verse momenta smeared so that the simulated resolution matches the one observed in data. Calibrations to the jet reconstruction and identification efficiency in MC simu-lations are determined using Z/γ∗+jets data. As
men-tioned earlier, jets are required to contain at least two tracks (see Sec. IV), and in MC simulations the corre-sponding efficiency is adjusted to match the one derived in dijet data. The uncertainties on the calibration of the jet energies, resolutions, and efficiencies as well as on the single particle response corrections are propagated to de-termine their effect on the differential cross sections.
D. Sample composition
Uncertainties on the composition of the selected events arise from the heavy-flavor scale factor used for W +jets events, the assumed t¯t cross section, single top quark and diboson cross sections, and the estimate of the contribu-tions from misidentified leptons. As described in Sec. V, the heavy-flavor scale factor in W +jets and the assumed t¯t cross section are obtained from a simultaneous fit to the MVD distribution in the ℓ + 2 jets, ℓ + 3 jets and ℓ+ ≥ 4 jets samples. From the fit we derive a systematic uncertainty of 8% on the normalization of the W c¯c + jets and W b¯b+jets processes, and 5% on the normalization of the t¯t processes. The uncertainty on the single top quark cross sections is 12.6%, taken from varying the scale by factors of 2 and 0.5. An uncertainty of 7% on the diboson cross sections is assigned to the NLO predictions based on scale variation and PDF uncertainties. The uncertainties on the data-driven method of estimating multijet (MJ) background and its kinematic dependencies, mostly due to the uncertainties on the selection rates of true and false lepton candidates, are 75% in the µ+jets and 32% in the e+jets sample. These uncertainties are estimated by varying the contribution of W c¯c + jets, W b¯b + jets, Zc¯c + jets and Zb¯b + jets by ±20%, the t¯t contribution by ±10%, comparing the fake and true signal rates in different variables (quoting the largest difference as ad-ditional parametrization uncertainty). In addition, to estimate the contribution of the fake rate uncertainty, a different 6ET cut of < 15 GeV (standard cut for the fake
rate estimation is < 10 GeV) [49] is applied. An overall 6.1% uncertainty on the luminosity [35] is assigned to the measured cross sections and is fully correlated across all bins of the differential cross section.
E. Regularization strength
As a procedural uncertainty in the unfolding method, the regularization strength is changed to higher and lower values by amounts consistent with the general bounds discussed in Sec. VII, and its impact is added to the total uncertainty. We test for a potential bias by
doing a closure test employing an ensemble of simulated pseudo–data sets, and find biases smaller than the assigned systematic uncertainty due to the unfolding procedure.
X. CROSS SECTIONS
The inclusive t¯t production cross section in the ℓ+jets decay channel can be calculated from any of the three dif-ferential measurements. We calculate it from the average of the three differential measurements in events with ≥ 4 jets weighted by the χ2 as provided by the regularized
unfolding (see Sec. VII), and we find σt¯t
= 8.0 ± 0.7 (stat.) ± 0.6 (syst.) ± 0.5 (lumi.) pb. (2) The inclusive t¯t production cross sections using the indi-vidual differential cross sections in dσ/dptopT , |ytop| and
m(t¯t) are 8.0 ± 1.1 (tot.) pb, 8.2 ± 1.1 (tot.) pb and 7.8 ± 1.0 (tot.) pb, respectively. The differences between these results have been verified to be statistically consis-tent using ensemble tests including correlations between the three measurements. These results are in agreement with the inclusive result of Sec. V, which was based on the inclusive ℓ+2 jets sample. The inclusive t¯t production cross section [Eq. (2)] is in agreement with the inclusive fully resummed NNLL at NNLO QCD calculation (see Sec. II), which gives σres
tot = 7.35+0.23−0.27(scale + pdf) pb.
The total cross section of the approximate NNLO calcu-lation as in Refs. [14, 23] is calculated from the ptopT
dis-tribution and yields 7.08+0.20
−0.24(scale)+0.36−0.27(PDF) pb. The
data may also be compared to differential cross section predictions from mc@nlo and alpgen that correspond to total cross sections of σtot = 7.54 pb and σtot = 5.61
pb, respectively.
The fully corrected differential cross sections are shown in Figs. 9–11, for m(t¯t), |ytop|, and ptop
T , respectively. The
corresponding correlation coefficients of the differential measurements are presented in Tables IV to VI in Ap-pendix A. For ptopT and |ytop| distributions we present the
average t and ¯t cross sections. The differential cross sec-tions are listed in Table VII to IX in Appendix A. Note that the correlated normalization uncertainty on the dif-ferential data points is about ±6.6%, dominated by the uncertainty on the measurement of the integrated lumi-nosity. For quantitative comparison to SM predictions, the covariance matrices (Tables X–XII) for the results are presented in Appendix A. No bin centering correction is applied to the measurements, and the cross sections are displayed at the center of each bin. Contributions be-yond the highest bin boundary are included in the last bin of the m(t¯t), |ytop|, and ptop
T distributions. As shown
in Fig. 6, there are no contributions to the differential cross section for m(t¯t) below 240 GeV.
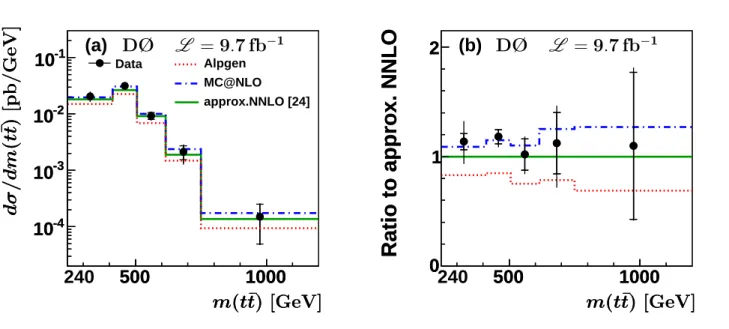
Figure 9(a) shows the cross section for the unfolded data as a function of m(t¯t), and (b) shows the ratio of
the cross section and several predictions to the approx-imate NNLO distribution [24]. Within the systematic uncertainties the mc@nlo and approximate NNLO de-scribe the data, while the alpgen prediction is low in absolute normalization as shown in Fig. 9(b). The dis-tribution for |ytop| is shown in Fig. 10. The ratio in Fig.
10(b) indicates that the distribution predicted by QCD at approximate NNLO is in marginal agreement with the data for |ytop|. The predictions by mc@nlo describe the
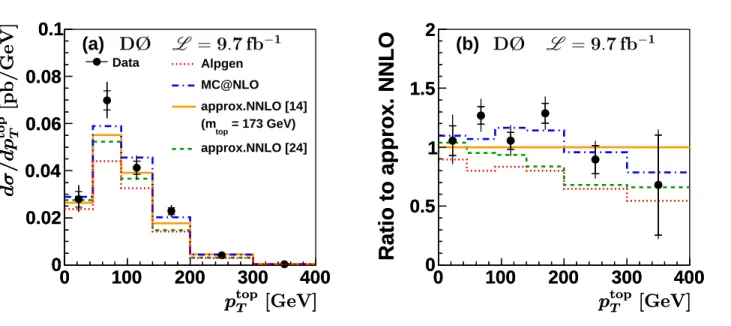
data better. As shown in Fig. 11(a), the differential cross section as a function of ptopT is reasonably described by mc@nlo and the approximate NNLO QCD prediction. The mc@nlo prediction describes the shape of the ptopT
distribution well.
This new result is consistent with an earlier measure-ment by D0 using 1.0 fb−1 of data [11]. Statistical
un-certainties are defined differently in Ref. [11], following Ref. [50], and are not directly comparable with the cur-rent uncertainties. The statistical uncertainties reported here are computed analytically and verified using an en-semble of simulated pseudo–data sets. Results presented here supersede the results of Ref. [11].
XI. CONCLUSIONS
Differential cross sections for t¯t production have been measured in the ℓ+jets decay channels using the full Tevatron data set at√s = 1.96 TeV. The data are cor-rected for detector efficiency, acceptance and bin migra-tion by means of a regularized unfolding procedure. The differential cross sections are measured with a typical pre-cision of 9% as a function of the invariant mass of the t¯t system m(t¯t), the absolute rapidity of the t and ¯t quarks |ytop|, and the transverse momentum ptop
T . The
mea-sured differential cross sections are in general agreement with predictions by QCD generators and predictions at approximate NNLO.