A Dynamic Analysis of the U. S. Office Market and Lease-versus-Buy Decisions
from 1951 to 1990 by
Young Wuk Chai
B. A. in Architecture
University of California, Berkeley (1982)
Master of Business Administration University of California, Los Angeles
(1986)
Submitted to the Department of Urban Studies and Planning in Partial Fulfillment of the
Requirements for the Degree of Doctor of Philosophy
at the
Massachussetts Institute of Technology April 1994
© 1994 Young W. Chai. All rights reserved.
The author hereby grants to MIT permission to reproduce and to distribute publicly paper and electronic copies of this thesis
document in whole or in Dart.
Signature of Author ...
Departet of Urb n Studies and Planning April 11 1994
Certified by ...
William C. Wheaton Professor of Economics and Urban Studies and Planning Thesis Supervisor Accepted by ... Karen R. Polenske Chairwoman, Ph. D. Committee MASSAC tTS INSTITUTE
JUL 121994
LHAH!ESA Dynamic Analysis of the U. S. Office Market and Lease-versus-Buy Decisions
from 1951 to 1990
by
YOUNG WUK CHAI
Submitted to the Department of Urban Studies and Planning in partial fulfillment of the requirements for the Degree of Doctor of Philosophy
Abstract
This thesis analyzes the determinants of office absorption, investment, rental adjustment, and lease-versus-buy (LVB) decisions. The office model presented in this thesis differs from past studies in that it recognizes explicitly: 1) the interactions between the capital and property markets; 2) that owner-occupants, renters, and lessors make up the office market participants; 3) the existence of incentives to leverage and to trade in office
investments; 4) the mid- to long-term nature of typical office lease agreements; and 4) non-financial incentives in the office LVB decisions.
Theoretically, from an owner-occupant firms' point of view, both the demand for and supply of office space are assumed to be a function of the level of and growth in office employment so that supply adjustments occur appropriately to demand shocks. In contrast, the demand for rental office space is believed to be a function of growth in office employment and
expected rental costs. The investment in rental office space is a function of a lagged price, which is further assumed to be a function of absorption and vacancy rates, equilibrium
capitalization rate, and net operating income. The change in rental rate is assumed to be determined by the difference between actual and optimal vacancy rates. The optimal vacancy rate is assumed to be a function of lagged absorption to stock ratio, investment rate, and linearly rising structural vacancy rate. Finally, the LVB decisions are assumed to be affected by local market conditions, national market conditions over time, and user firms' characteristics.
Empirically, when the sample period, from 1951 to 1990, is split into two subperiods (1951 to 1970 and 1971 to 1990), the office market behavior is found to be inconsistent between the two subperiod, which reflects the emergence of the active rental office market in the second subperiod. Specifically, the first (second) subperiod is better estimated by the owner-occupant (rental) office market equations. Especially for office investment in the second subperiod, the equilibrium capitalization rate, which is determined by the capital market, is found to be a critical determinant. Using a logit model on 2,137 observations of LVB decision, the non-financial determinants are able to correctly predict 76 percent of the overall observations.
The persistence of booms and busts in the rental office market appears to be a result of long lags (three years) in and slow rate (about 38 percent per year) of supply adjustments
coupled with frequent changes in fiscal and monetary policy. Contrary to the traditional belief, simulation results show that high inflation and ordinary tax rates actually reduce
the capitalization rate thereby boosting the level of office investments. Thesis Supervisor: William C. Wheaton
ACKNOWLEDGEMENTS
This dissertation is not an individual achievement. Many individuals have provided me with intellectual advice, emotional support, and encouragement, without which I could not have possibly completed the dissertation.
First, my advisor, Professor William C. Wheaton, has guided me from the beginning to the end with his wisdom and intellect. He has spent innumerable hours, at times several hours without stopping, to give me constructive arguments and thoughtful suggestions. I am appreciative of his willingness to share his proprietary data to make this thesis possible. Also I am grateful that my other dissertation committee members, Professors Jerome Rothenberg at M.I.T. and Karl Case at Wellesley College, were very forthcoming with their comments and
provided me with critical encouragement near the end.
Second, many professors at M.I.T. have been invaluable sources of inspiration and information. I am indebted to Professors Ranko Bon and Michael Joroff, who have initiated me into the subject of corporate real estate portfolios. In particular, I am grateful for Michael Joroff's constant support and generosity. Also, Professors Marc Louargand, Karen Polenske, and Lynne Sagalyn have given me advice on various issues related to my thesis when I worked for them as a teaching assistant. Third, many close friends and colleagues have brought me joyous moments during my years at M.I.T. that I will always cherish. Particularly, Young-Keun and Eun-Jung Kim were always willing to share difficult and cheerful times. I will
remember discussions I have had with Sang-Hun Lee and Chae-Shin Yoon both on and off the campus. Dr. Bae-Hoon Lee has shown me how to be a righteous man. Lastly, but most importantly, I thank my family for their indefatigable support and love. My wife, Keeryung, who is pursuing her Ph.D. at Harvard University,
sacrificed tremendously to help me finish my dissertation. She abandoned her studies at The University of Paris to come with me to Boston, is raising our son Jonathan, and has always been a source of inspiration. When I was discouraged and down, her confidence in me and her optimism always kept me going. My parents have provided me with emotional and financial support to make this dissertation possible. They have always been 100 percent behind me and I am very appreciative of their assistance. My parents-in-law have encouraged me unceasingly with their spiritual and financial support. They have prayed for me and have been very generous with their love. I am also thankful to my brother for his support as well as assistance with my data.
To all those others who helped me in countless ways during my work on this dissertation, I wish to express my deep appreciation.
Table of Contents
Chapter 1 Introduction and Thesis Outline
1.1 Introduction ... 7
1.2 Thesis O utline ... . 10
1.3 Summary of Empirical Findings ... 17
Chapter 2 Historical Trends in Supply of and Vacancy Rates in Office Property 2.1 Introduction ... 19
2.2 Office Investment and Stock ... ... 20
2.3 Office Vacancy Rates ... . 31
2.4 Concluding Rem arks ... 38
Chapter 3 Previous Studies and Problems 3.1 Introduction ... 40
3.2 Past Models of Aggregate Investment Expenditures ... 41
3.3 Past Models of the Rental Office Market ... .44
3.4 Concluding Rem arks ... 50
Chapter 4 The Demand for Office Space 4.1 Introduction ... 52
4.2 The Theory ... 53
4.2.1 The Demand for Owner-Occupied Space ... 53
4.2.2 The Demand for Rental and Owner-Occupied Space ... .57
4.3 Estim ation Strategies ... .60
4.4 Estim ation Results ... . 68
4.5 Concluding Rem arks ... 81
Chapter 5 The Supply of Office Space 5.1 Introduction ... 84
5.2 The Theory ... 86
5.2.1 The Owner-Occupant Investment Equation ... .86
5.2.2 The Rental Office Investment Equation ... 87
5.3 Estimation Strategies for Equilibrium Price Index ... .91
5.3.1 The Effect of Taxes ... . 97
5.3.2 The Effect of Debt Financing ... .101
5.3.3 The Effect of Trading ... .106
5.4 Estim ation Results ... 117
5.5 Concluding Rem arks ... .126
Chapter 6 The Rental Adjustment Model 6.1 Introduction ... . 130
6.2 The Theory ... 133
6.2.1 The Optimal Vacancy Rate ... .133
6.2.2 The Equilibrium Rental Rate ... .137
6.3 Estim ation Strategies ... 139
6.4 Estimation Results ... 142
6.5 Concluding Remarks ... .145
Chapter 7 Tax Policy, Inflation, and Office Investment Behavior 7.1 Introduction ... . 148
7.2 The Adjustments in the Property and Capital Markets ... .149
7.3 The Effects of High Leveraging and Trading ... .153
7.5 Concluding Rem arks ... .165
Chapter 8 The Determinants of Lease-Versus-Buy Decisions 8.1 Introduction ... . 167
8.2 The Equilibrium Office Rent Equation ... .171
8.3 The Non-Financial Determinants of LVB Decisions ... 184
8.4 Methodology and Estimation Strategies ... 192
8.5 Estim ation Results ... 198
8.6 Concluding Rem arks ... .203
Chapter 9 Conclusions 9.1 Introduction ... . 209
9.2 Summary of the Office Model and Empirical Findings ... .213
9.2.1 The Demand M odel ... 215
9.2.2 The Supply M odel ... . 217
9.2.3 The Rental Adjustment Model ... 219
9.2.4 Simulation Results ... .220
9.3 The Determinants of Lease-Versus-Buy Decisions ... .222
9.4 Limitations of the Model and Possible Extensions ... .224
Chapter 1
Introduction and Thesis Outline
1.1 Introduction
Real estate is one of the most valuable assets owned or leased by American
businesses. Results of several surveys demonstrate the magnitude of corporate real estate holdings. Zeckhauser and Silverman [1981] surveyed corporate real estate holdings in the United States in 1981 and estimated that corporations owned
four-to-seven billion square feet of building space, leased two-four-to-seven billion square feet, and controlled an additional 70-to-140 million acres of raw land. They also estimated that the total worth of corporate real estate assets in 1981 was somewhere between $700 billion and $1.4 trillion. More recently, Roulac [1989] estimated that, in 1988, corporations were the most important players in the
non-residential real estate market with a nearly 75 percent market share or nearly
$2.6 trillion out of $3.5 trillion of total non-residential real ;state capital (both debt
and equity). The Bureau of Economic Analysis' (BEA) Industry Wealth and Investment data confirm the significance of corporate real estate holdings. For example, in terms of 1982 dollars, the gross stock of industrial and commercial properties increased from $349 billion in 1947 to $1.4 trillion in 1990. Looking at
only the office properties, the gross stock quadrupled from $110 billion in 1947 to
Surveys that analyze corporate space usage cast doubt on the conventional belief
that corporations lease office facilities with greater frequency than
industrial/warehouse facilities (see, for example, Smith and Wakeman [1985]). Wheaton and Torto [19901 show that 45 percent of the gross stock of industrial and commercial warehouse properties is occupied by owners. Recent data, supplied by CB Commercial, regarding office properties in 53 major U.S. metropolitan areas,
reveal that approximately 15 percent of all office space is occupied solely by
owners, and an additional 20 percent is occupied by owners who also lease out a part of their owned space to other firms. Similarly, a survey of large firms
conducted by The International Facilities Management Association in 1987 [1987] indicated that 54 percent of all office space is owner-occupied. Another extensive survey by The Energy Information Administration (EIA) in .1989 [19911 estimated
an even higher percentage of office ownership. It estimated that approximately 32 percent of all surveyed office space is owned by sole owner-occupants, and 38 percent is owned by owner-occupants who also rent to other tenants.
These figures indicate that the corporate real estate market, and the office market
in particular, is composed of two types of firms. The more traditional type is the owner-occupant firms that invest in the market primarily for their own uses. The other type consists of "rental" firms that rent properties to the corporate users. While real estate firms are the largest providers of rental office space, firms in other industries, specifically the insurance industry, also provide a non-trivial
Accordingly, the overall office investment and absorption behavior and
rent-adjustment must exhibit and be determined by combined actions of both types of firms. Presumably the owner-occupant firms' investment behavior is a direct response to their own needs for office space and is less sensitive to the office market cycles or volatility than that of the "rental" firms. In fact, the "rental" firms may be the primary generators of office market volatility. Similarly, the
demand function for office space with an active rental market must be different from that without an active rental market. One of three objectives of this thesis is
to identify the determinants of the demand for and supply of office space with an explicit recognition of the owner-occupant and "rental" firms that make up the overall office market.
Another objective of this thesis is to model the office market by allowing the capital
market and the property market to interact to determine the demand for and supply of office space. While the relationship between these two markets seems intuitively obvious, many studies have failed to consider them simultaneously by assuming that they act autonomously. Only recently, DiPasquale and Wheaton
[1992A] have provided a theoretical basis to understand the interaction of the
capital and property markets and Fisher [19921 suggests the need for integrating the two markets.
Finally, the third objective of this thesis is to understand driving force behind the
growing dominance of the rental office space by identifying and testing possible
approaches in analyzing the LVB decision focus on financial factors and assume
that non-financial factors do not pose asymmetries between a lessor and a lessee.
However, a unique set of characteristics of the office market (e.g., indivisibility, heterogeneity, durability, and persistence of market disequilibrium) suggests that
market conditions and user characteristics should be important in the LVB decisions.
Three pragmatic reasons exist for limiting the scope of the study to office properties. First and foremost, the office market has received much attention recently due to its explosive growth in supply. Not surprisingly, the recession of
1991 and the period leading to it evidenced the fragility of the market and the
severity of the over-investment. This type of phenomenon suggests the importance of proper capital investment policies and market awareness in fueling economic
activities. Second, firms perceive office properties as "generic" in nature; and therefore are not seriously constrained in making the tenure choice. Unless the type of real estate assets is readily available in both rental and sales markets, firms may not have a realistic tenure choice. Third, there exists a severe lack of
consistent and historic data on other non-residential real estate markets. Of all the data reviewed, the office market seems to provide the most complete data necessary for testing theoretical models.
1.2 Thesis Outline
trends of the office investment, accumulated stock, and vacancy rates over the last
40 years are presented. Both the investment and stock data are reviewed based on gross and net values in order to identify the amount of replacement versus new investment (the replacement investment accounts for the difference between gross
and net investment). The gross stock data confirm the well-known observation that
over one-half of the existing stock was built over the last twenty years. In addition to the analysis of the level of investment, various investment ratios are presented. The two most relevant ratios are investment to previous year's stock and
investment to GNP ratios. Surprisingly, these two ratios appear to behave quite
similarly -- the correlation coefficient of these two ratios is 0.975. Even these ratios confirm that the level of office investment in the 1980s is simply
unparalleled. The vacancy rate over the last 40 years is presented to show that it increased gradually until the mid-1960s and, since then, it has exhibited the
well-known cyclical nature of the rental market.
Two major sets of previous investigations into office market investment behavior are presented in Chapter 3. Currently, there is a lack of a coherent office market
investment model with a substantive theoretical basis which reconciles the capital and property markets that determine the behavior of the office market.
Macroeconomists have developed capital investment models which aggregate all fixed assets and treat them homogeneously, with little regard to peculiarities of the commercial properties, such as high-leverage mortgages, the incentive to trade, and
the significance of the rental investments. These models focus primarily on the dynamics of interest, inflation, and tax rates, which are important; however, they
cannot tell the complete story. In particular, if one ignores the rental investments,
one cannot explain the vacancy cycles which have occurred over the last 30 years.
On the other hand, real estate economists have developed and empirically tested office models that lack a sound theoretical basis because they focus on the rental market as if owner-occupant firms do not exist. Moreover, these models do not
incorporate the dynamics of the capital market that influence office investment behavior. For example, the dynamic issues of interest rates, inflation rates, and
tax policies that the macroeconomists find so important should be -- but are not --incorporated explicitly in these models. Rather, the models treat these factors as
constant in an attempt to analyze the property market equilibrium. Empirically they tend to rely on relatively short time-series data, which cannot portray the full impact of changes in the capital and property markets.
In Chapters 4 and 5, equations that determine the demand for and the investment in office space are developed and tested empirically. The office market model presented in this thesis recognizes both the consumption and investment nature of
the office investment behavior by treating office space as containing both property and capital values. The property value is determined by the unique characteristics of the office market such as vacancy rates, rental rates, and office employment
growth, whereas the capital value reflects those characteristics such as interest rates, inflation rates, and tax rates that affect the decision to invest in any assets. Since the office market is composed of owner-occupant and rental spaces, this office
behavior. From the owner-occupant firms' point of view, the office investment is a
direct response to a rising office employment, and a higher (lower) cost-of-capital is believed to discourage (encourage) investment assuming that the supply cost
remains relatively stable. On the other hand, the rental office space demand is assumed to be determined by office employment as well as market rent rates. Rental office investment is based primarily on the expected price; hence,
substantial speculative behavior (i.e., sporadic over- and under-investment) is
expected to occur. In other words, the amount of spread between the expected
market price and the supply cost is believed to determine the level of rental office investment. For example, an increase in the net operating income and/or a
decrease in the capitalization rate can raise the expected market price, which leads to a higher investment rate.
The empirical content of this thesis differs from the past researches on the office
market (which have relied on a spatial unit (i.e., square feet) for their empirical analysis) in that a constant dollar value of investment and stock series are used. Serious problems arising from using the spatial unit for analysis are: 1) depending
upon geographical regions, same-sized office buildings may have substantially different values; 2) within a given city, a building's value varies according to its
level of quality and specific location; 3) over time, the value of office stock can change even though the size of the stock remains the same depending upon the
average age of the stock; and 4) in the capital market, office buildings are
analyzed, like any other assets, based on the rate of return, which is difficult to
In addition, the time span of the data used in this thesis is far more extensive than that commonly used in previous studies. While most of the office models have been
empirically tested for a period of less than 20 years, the data employed in this thesis go back to 1947. By testing 40 years of data, the model can be tested to determine the degree of stability of the estimated coefficients, which could not have
been possible with the previous studies by the real estate economists using only 10 to 20 years of data.
The empirical tests following the theoretical development of the demand and investment models validate the hypothesis generated by the models. One of the salient characteristics of the office market is that when the -40-year period
examined is split into two 20-year subperiods, one finds that the rental market has emerged as a significant component of the overall office market only within the last 20 years. Additionally, the rental market, without the ability to adjust supply accurately and quickly, has contributed to the increased volatility in the office
market during the last 20 years as the user firms attempt to deal with the greater fluctuations in the cost of capital or the rental rate. The rental market's inherent problem, which leads to the proverbial office cycles, is that the investment occurs with very long lags and very low adjustment rates.
In Chapter 6, a rental adjustment model is developed and tested empirically. In developing this equation, the traditional notion that the rental rate adjusts in response to the difference between the actual and optimal vacancy rates is
linearly rising long-term structural vacancy rate, and past absorption and investment rates. The basis for assuming a linearly rising long-term structural
vacancy rate is that office user firms have been increasingly reliant on the rental
office space. In other words, as the demand for rental office space, as oppose to owner-occupant office space, has increased, the structural vacancy rate should also increase. Unfortunately, without access to a marginal rental rate time-series, the
empirical testing relies on average rental rates between 1971 and 1990. Even with
the average rental rate series, the empirical findings suggest that change in rent is affected positively by past absorption rate and the time variable and negatively by past investment and vacancy rates.
Chapter 7 presents the relationship among interest rate, inflation, tax policy, and office investment behavior. The ability to induce changes in the interest rates and
taxes is the basic power behind monetary and fiscal policies exercised by a
government. All economists agree that lowering the effective tax rates acts as a stimulus for the economy to grow faster. Accordingly, U.S. tax rules and monetary policy have been based on a notion that accelerating the depreciation deductions, lowering statutory tax rates, and lowering the inflation rate interact to encourage
investment. However, the nature of office investment with high leverage ratio and trading characteristics completely contradict this widely accepted conclusion. Chapter 7 shows that from both theoretical and empirical perspectives, high inflation and tax rates, when coupled with accelerated depreciation deductions,
encourage office investment. The anti-inflationary policy and frequent tax rule
rental investment behavior, have had quite the opposite of the desired stabilizing effect. Simulation results show that they have actually amplified the cycles in the
office market and have prolonged its state of disequilibrium.
Chapter 8 presents various theories on determinants of the office tenure choice and these determinants are tested empirically. The traditional approach to lease-versus-buy (LVB) analysis sets non-financial factors equal and focuses on the
effective marginal tax rates as the main source of asymmetries between a lessee and a lessor. However, empirical evidences show that a majority of firms both lease and buy office properties. In other words, the effective marginal tax rates
cannot be the key determinant of LVB decisions. Initially, following the equilibrium capitalization rate calculations in Chapter 5, an equilibrium office rental rate equation, which reflects the high-leverage mortgages and the incentive
to trade, is developed. The equilibrium office rental rate equation indicates that the most critical and yet most uncertain variable in the equation is an estimation
of the present value of residual claim. This suggests that a firm's level of risk aversion with respect to the future value of office buildings may be far more critical in determining the tenure choice.
More importantly, eight sets of non-financial sources of asymmetries between leasing and buying are theorized and tested empirically. They can be classified under three categories: 1) local market conditions, 2) national market conditions
over time, and 3) user characteristics. Using a logit model and 2,137 observations
overall observations.
Finally, in Chapter 9, a summary of the model and empirical findings, limitations of the model, areas of further study, and policy implications are provided.
1.3 Summary of Empirical Findings
The empirical results validate the key hypotheses proposed in the thesis. They
are:
1) The office market has experienced a structural change between 1951 and 1990
as a result of presence of the active rental office market over the last two decades.
When the sample period is split into two subperiods (i.e., 1951-1970 and
1971-1990), the estimated coefficients are strikingly unstable. Specifically, in estimating
the level of office absorption, the first subperiod, which is dominated by
owner-occupants, is better explained by a stock-flow model, whereAs the second subperiod, which is dominated by lessees, is better explained by a flow model. Also, the
investment equation is consistent with the absorption equation for the first subperiod as one would expect (i.e., the supply responses appropriately to the changes in the demand functions). However, for the second period, the level of office investment is substantially determined by the level of price (i.e., the
underlying theory of Tobin's q model) rather than the level of or growth in office
2) The interactions between property and capital markets are absolutely
important in understanding the ways in which the rental office market behaves.
Considering the second subperiod only, statistical fit of the investment equation
improves significantly by specifying variations in the equilibrium capitalization rate over time. The main difference between the equilibrium capitalization rate and the market capitalization rate is the rate at which the net operating income is expected to change in the future. This difference appears to be proxied reasonably
well by lagged vacancy and absorption rates.
3) Contrary to the general belief by macroeconomists, higher inflation and
ordinary tax rates actually help lower the office user-cost-of-capital. Simulation results show that the poor timing of the tax policy changes in the 1980s
contributed to the unprecedented level of investments in the mid-1980s. Without a
doubt, this led to the much discussed problem of over-supply of office space in the
late-1980s and early-1990s. Without a significant surge in office employment in the 1990s, the excess supply of office space is not expected to erode soon.
4) A set of non-financial determinants is able to correctly predict office tenure choices at a rate of 76 percent. The determinants can be classified into local market conditions, national market conditions, and user characteristics. Because of the size factor (i.e., a ratio of square feet occupied to building size), in the absence of an active office condominium market, many office users appear to be
Chapter 2
Historical Trends in Supply of and Vacancy Rates in Office Property
2.1 Introduction
The purpose of this chapter is to review the movement of the office investment, stock, and vacancy rates between 1947 and 1990. While many macroeconomists have investigated the determinants of the aggregate value of non-residential fixed investment, the ways in which firms invest in a single asset category have been
poorly-understood. Office property, in particular, has been a growing component of the commercial properties, structures, and GNP over the last 40 years. Still, high
variability of the office investment series suggests that its underlying determinants need to be identified and understood.
Traditionally, macroeconomists have examined investments in terms of the demand for capital, which implies that the supply responds appropriately to the changes in the demand function. However, the rental market's vacancies distort the presumed relationship between supply of and demand for office space. With
some assumptions, the proportional share of rental investment and stock are estimated, and the market disequilibrium (measured by the vacancy rates) are
presented. Over the last 40 years, vacancy rates, while exhibiting cyclical
increased.
2.2 Office Investment and Stock
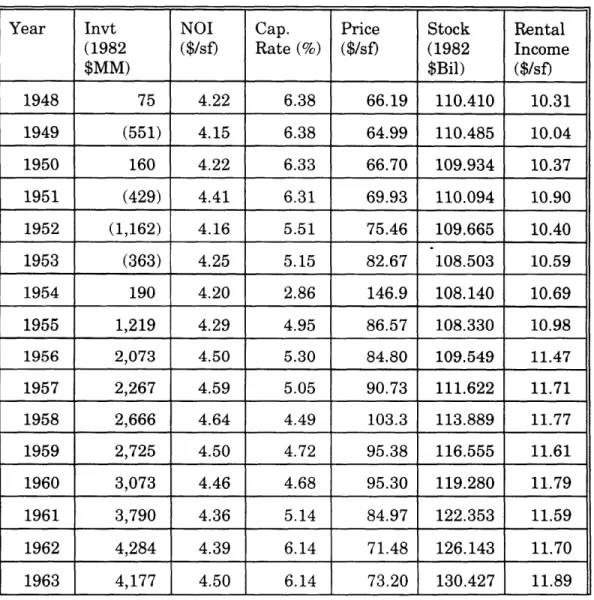
To measure historical investment patterns in office property, this thesis relies on data provided by the BEA on Fixed Business Wealth and Investment. The BEA
compiles annual data on 72 types of capital (i.e., nonresidential structures and producers' durable equipment) by 62 types of industries. The Wealth data begin in 1947 and include gross stock, capital input, net stock, depreciation, and discards.
To arrive at constant-cost valuation, the implicit GDP price-deflators are used. The GDP price deflator series differs slightly from the Nonresidential Structures price deflator series (most notably in years 1981 and 1982); however, they appear
to be reasonably close to one another as shown in Figure 1.
The difference between the gross and net stock values is that the former employs the one-hoss shay decay assumption and the latter assumes a constant exponential deterioration rate. While there is a consensus in employing the exponential decay assumption due to its computational simplicity, the gross stock value measures most closely the stock of office buildings in terms of the level of service delivered.
A rationale for using the gross stock is that once a building is completed, it
provides the same or similar amount of services during its lifetime. Since gross investment accounts for the value of new properties and replacement of the
existing properties, net investment, which is defined as the gross investment less
Figure 1
Figure 2 shows the gross and net investment in office properties between 1948 and
1990 in 1982 dollars. Prior to the mid-1950s, gross investment was relatively
stable at around $3 billion. Between the mid-1950s and 1973, it increased gradually to about $13 billion and then dropped to $8 billion in 1976. The most striking observation of the trend is the astonishing growth rate of investment between the late-1970s and the mid-1980s. In 1985, the investment peaked at $28
billion, which is double the amount in 1973 when the previous peak occurred. IMPLICIT PRICE DEFLATORS
GDP vs. Nonresidential Structures 110 100 -90 -80 -o 70 -0 50 -40 -30 -20 9 61 63 65 67 69 71 73 75 77 79 81 83 85 87 60 62 64 66 66 70 72 74 76 78 80 82 84 86 88 Years 0 GDP + Structures
Figure 2
The net investment pattern closely follows the gross investment pattern. The
replacement investment accounts for, quite consistently, $3 billion over the last 40 years. Over time, the proportion of replacement to gross investment declined
--prior to the mid-1950s, virtually all of the gross investment represented
replacement and, in 1985, the replacement consisted of only about 11 percent of the gross investment. A declining rate of replacement investment, as opposed to
the traditional theory of a constant replacement investment rate, is explained by a
consistent decline in the average age of office buildings over the 40-year period. Specifically, the average age of office stock declined from over 20 years to under 10
years between 1947 and 1990.
INVESTMENT IN OFFICE PROPERTIES
30 28 26 24 22 f\\* 20 18 14 z 0 12 10 50 607 019 466 4 2 0 -2 - 19,48 5 5 1 1 75 1 8'5 1 50 60 7080 1990 YEARS 0 NET + GROSS
Figure 3
Figure 3 shows the gross stock of office properties between 1947 and 1990 in 1982 dollars. In the absence of a true market value time-series on the office stock which
would provide annual change in the market value relative to the general price deflator, the gross stock time-series is used as the closest proxy. The
reasonableness of the gross stock figure is confirmed by they Society of Industrial and Office REALTORS' (SIOR) 1990 survey [19911, which estimated the office stock
at $400 billion (approximately $278 billion in 1982 dollars) and Institute of Real
Estate Management (IREM) and Arthur Andersen's 1991 survey [1991], which
estimated the office stock at $1 trillion (approximately $695 billion in 1982 dollars).
GROSS STOCK OF OFFICE
500 450 400 350 M 300 z 0 -j 250 200 150 100 50 19,47 55 65 75 e5 50 60 70 60 1990 YEARS
During this period, the gross stock quadrupled from approximately $110 billion in
1947 to $440 billion in 1990. And much of the growth occurred in the 1980s. This pattern coincides with Birch's [1990] statement:
We tend to forget that as recently as 1960, we had relatively little office space. We were an agricultural and then an industrial economy, and few people worked in office buildings. By 1960 we had still built only about 27% of the office space existing today. Said another way, 43% of all office space ever built in the U.S. was built in the past 10 years and about 60% has been built in the past 20 years.
The Energy Information Administration's survey [1991] also estimated that about
52 percent of office stock in 1989 was built during the past 20 years. In fact, in
1947, the gross stock of office buildings was only two-thirds of the industrial buildings stock, whereas, by 1990, they were virtually identical.
Rather than looking at the absolute values of investment in and stock of office properties, investigating relative values is more insightful since the economy, in
general, has been growing over time and over the last 40 years, the GNP has also quadrupled. One must also be cognizant of the fact that the level of office
investment in the 1980s is not only high in terms of its absolute value but also disproportionally high in relative terms. Several ratios presented below provide those relative values.
First, the ratio of net office investment to the gross stock shows the growth rate of
the office supply. Figure 4 illustrates that in the mid-1950s, the growth rate increased from negative one percent to positive two percent, and until the early
1970s, the rate increased fairly steadily to about five percent. Between 1973 and
1977, the rate dropped back to two percent only to rebound to a historic peak at
around seven percent in 1982 and again in 1985. By 1990, it dramatically
decreased to about three percent. During the same period, the growth rate of net investment in all non-residential structures ranged from a lbw of one percent in
1948 and 1990 to a high of 3.5 percent in 1965 and 1981. Indeed, the growth rate of office supply is significantly more volatile (in term of both magnitude and frequency) than the growth rate of all nonresidential structures.
Figure 4
Second, ratios of the net office investment to the net investment in the total
OFFICE NET INVT/STOCK RATIO
0.08 0.07 -0.06 0.05 -0.04 0.03 0.02 -0.01 -0 --0.01 -1948 55 65 75 85 50 60 70 20 YEARS
structures as well as the total capital (i.e., structures and equipment) can show whether the office investment expenditures pattern is significantly different from
that of the aggregate plant (structures) and equipment expenditures. Figures 5 and 6 represent the proportional share of the office net investment.
Figure 5
Figure 5 shows that between the late 1950s and the early 1980s, the net investment in office space made up approximately 10 percent of that in all
structures. However, in the 1980s, the proportional share of net investment in
office buildings relative to all the structures increased and peaked at around 40 percent in 1989.
OFFICE/STRUCTURES NET INVT RATIO
-0.1
Figure 6
Figure 6 shows that, consistent with the previous two ratios, the period between
the late-1940s and mid-1950s experienced negative or very low office investment rates. Between the late-1950s and the early-1980s, the proportional share of office to total capital net investment was cyclical but, nevertheless, it averaged around five percent. By 1982, the ratio peaked at 12 percent, and since then, it has dropped back to about seven percent. The reason that the office/capital ratio has declined since 1982, rather than remaining high near the 1982 level or continuing
to increase as the office/structures ratio did, is due to an even more rapidly
increasing level of investment in office, computing, and accounting machinery in OFFICE/CAPITAL NET INVT RATIO
0.13 0 12 -0.11 -0.1 -0.09 0.08 -0.07 -0 -06 -0.05 -0.04 -0 -03 0.02 -0.01 -0 -0.01 -0.02 --0.03 1948 55 65 75 85 50 60 70 80 19 YEARS
the 1980s. Clearly, these two ratios suggest that the early-1950s, with negative
investment rates, and the 1980s, with exceptionally high investment rates, cannot be considered as "normal" periods in terms of office investment expenditures.
Third, the negative office net investment level during the late-1940s to the
early-1950s as well as the increasing level in the 1980s had a significant impact on the proportional share of the gross stock of office space to both total structures and
capital. Figures 7 and 8 depict these ratios.
OFFICE/STRUCTURES GROSS STOCK RATIO
0.13 0.12 -0.11 0.1 0.09 -0.08 -0.0755 65 75 95 1947 5 ' 50 60 70 20 1990 YEARS Figure 7
Figure 7 shows that office buildings accounted for approximately 8.5 percent of the
total stock of structures in 1947. The ratio dropped to about 7.5 percent in the mid-1950s, and increased thereafter to about 9 percent by 1980. Since 1980, the office share has been increasing steadily, reaching almost 13 percent in 1990.
Figure 8 shows that the office to capital gross stock ratio between 1947 and 1990 resembles a U-shaped curve. In both 1947 and 1990, the ratio was nearly six percent. Between the mid 1950s and the early-1980s, the ratio fluctuated between
4.6 percent an 4.8 percent.
Figure 8
Based on these figures, one can postulate that the 1980s represented a period of OFFICE/CAPITAL GROSS STOCK RATIO
0.061 0.06 -0.059 -0.058 -0.057 0.056 0.055 -0.054 -0.053 -0.052 -0.051 -0.05 -0. 049 -0.048 -0,047 -0.046 -0.045 1947 55 65 75 e5 50 so 70 Bo 1990 YEARS
unusually high office stock, which is confirmed by unusually high vacancy rates in
the 1980s. Also Figure 8 suggests that the late-1940s and the early-1950s may have been a period of excess supply. The excess supply in the 1940s and 1950s is
not reflected in the vacancy rates, which suggests that the excess may have come from owner-occupant firms. If in fact the excess supply did exist in the late-1940s, the negative or very low investment rates (Figures 4, 5, and 6) observed in the late-1940s and early-1950s appear to be a reasonable and appropriate response.
Fourth, another indicator of the office investment level is the office net investment to GNP ratio, which is shown in Figure 9. This ratio indicates the relative amount of GNP that is accounted for by the net investment in office buildings. The pattern of this ratio is quite close to that of the office net investment to gross stock ratio
shown in Figure 4 -- the correlation coefficient is remarkably high at 97.5 percent. The office net investment to GNP ratio increased between the mid-1950s to the
early-1970s from negative 0.1 percent to about 0.4 percent. It dropped in the mid-1970s to about 0.2 percent and peaked close to 0.7 percent in 1982 and again in
1985. Thereafter, the ratio dropped to approximately 0.35 percent in 1990.
The above illustrations reveal the high variability of investment in office buildings
relative to overall structures, capital, and GNP. The two most striking and consistent observations are: 1) very low investment rates prior to 1960, and 2)
unprecedentedly high investment rates in the 1980s. Also, the investment rates in the 1960s and the 1970s appear to exhibit modest cyclical behavior. The high
Figure 9
measuring the impact of fundamental demand and supply factors.
2.3 Office Vacancy Rates
As long as vacant rental office space exists, the amount of office space actually occupied does not equal the amount of stock available in the market; thus
disequilibrium exists in the office market. As a result, the investment and stock values discussed in the previous section do not necessarily equal the amount
The most relevant indicator of the degree of disequilibrium in the rental market is
the vacancy rate. It measures the stock (i.e., the supply) in relation to the actual occupancy (i.e., the demand) for office space. Following Wheaton [1987], the
national vacancy data were compiled from two sources: CB Commercial, a national
commercial brokerage company, and the Building Owners and Managers
Association's (BOMA) "Experience Exchange Report." Figure 10 illustrates the
vacancy rates between 1947 and 1991. There appear to have been three distinct office vacancy cycles over the last 30 years and the average rate seems to have been increasing over time. Causes of the growing average vacancy rates and
persistence of the cycles are postulated below.
First, the fundamental cause of the growing imbalance appears to be the increasing role of the speculative rental market. Developers and investors in the rental
market cannot forecast and respond properly to the constantly fluctuating demand
and yet they have become the most significant providers of office space over the last 20 years.
Assuming that investment, which includes both new constructions and acquisitions of existing office buildings, made by firms in the real estate and insurance carrier (REIC) industries is directed predominantly to the rental market, whereas firms in
the other (Other) industries invest primarily for their own uses, the office market has evolved dramatically over the last 40 years as the REIC's share of the office
stock has become significantly large in the 1980s. Figure 11 illustrates the
NATIONAL OFFICE VACANCY PATES 20 -19 -18 -17 -16 15 14 13 12 z 11 U a 10 C- 9 8 7 6 5 4 3 2 1947 1950 1955 1960 1965 1970 1975 1980 1985 1990 YEARS Figure 10
Between 1947 and 1964, the REIC's stock declined from approximately 26 percent to 23 percent. Parenthetically, this declining trend started in the early-1930s, shortly after a decade of accumulating office space in the 1920s. Between the mid-1960s and the mid-1970s, the REIC's share increased briefly reaching a peak at around 25 percent and dropped back to about 23.5 percent. Since then, the REIC's share continued to increase as its stock reached nearly 40 percent in 1990.
Interestingly, much of the growth occurred in the 1980s when the REIC's market
share of the office stock increased by about 54 percent.
In comparing the REIC's portion of the office employment and the REIC's stock of
% of Gross Stock of Office Bul 1dings
by RE & Insurance Industries
41 40 -39 -38 -37 -36 -35 -34 -33 -CD E. 30 -29 -28 -27 -26 -25 -24 23 -22 1947 55 65 75 e5 50 60 70 20 1990 Years Figure 11
office buildings, one can postulate that much of the REIC's stock prior to the 1970s must have been invested for their own uses rather than for the rental market.
Specifically, the ratio of REIC's employment to the total office employment declined consistently from about 30 percent in the late-1940s to about 18 percent in 1990. The trend in this ratio and the REIC's stock ratio remained' parallel until the
mid-1960s, which suggests that only a minor portion of the REIC's stock could have been actually available for the rental market. Since the mid-1960s, the growing
proportion of the REIC's stock in contrast to the continually declining portion of
the REIC's employment can only imply that much of their investments in office buildings must have been for the rental market.
Figure 12
Figure 12 shows the constant dollar value of the net investment series between the REIC and Other (non-REIC) industries. Clearly, the REIC's investment was only a minor portion of the total investment prior to the 1970s. Between the late 1940s and the late 1960s, the REIC's net investment grew from a negative amount to about $2 billion whereas the Other's net investment increased from a negative investment to about $5 billion. The mid-1970s' recession had a drastic impact on the REIC's investment in comparison to that of the Other. For example, in 1976,
the REIC's investment dropped to $62 million from $3.5 billion in 1973. In
contrast, the Other's investment dropped from $8 billion in 1974 to $4.4 billion in
1978. The most prominent market change occurred in the 1980s when the amount Net Inv t in Off ice Bui Id ings
between REIC ana Other
15 14 -13 12 -11 10 9 C\j 08 -7 0 6 - 5 4 3 2 0 -1 --2 19481 55 65 75 8,5 50 60 70 80 9 0 PEIC + Other
of the REIC's investment surpassed that of the Other.
Figure 13 shows the proportional share of the total gross investment made by the REIC. The REIC's portion of the gross investment series, which has never been
higher than 30 percent prior to the 1980s, hovered consistently around 50 percent in the 1980s.
Figure 13
Second, the causes of this cyclical imbalance between demand and supply which result in persistent booms and busts can be attributed to three fundamental
characteristics of the rental market. The first factor is the contrast in the timing
% of Gross Inv 't. in Off ice BuTidings
by insurance & Real Estate Industries 60 50 40-C L 30-20 -10 -0 471 55 6 5 70
1
85 Yearsbetween the building construction and building servicing periods; office buildings are constructed in one period, while the service they bring to the market extends
over several decades. Hence a typical building will experience a series of demand fluctuations during its life. As long as these fluctuations exist, vacancy cycles appear to be inevitable. Secondly, the rental office investment process involves a
very long gestation period to formulate expectations, to make decisions, and to physically develop buildings. Within the stage of developing the building, the task
of assembling land, financing, and construction entails time-consuming processes, which appear to be getting only longer. Thus the delay in the timing between the shortage of office supply and the delivery of additional office space can be as long as several years. Thirdly, related to the second factor, the decision to invest this year is predetermined by the expectations formulated several years ago about the
economic and market conditions of the current year. Without a reliable forecast of
anticipated demand and supply responses, firms resort to extrapolating previous economic and market conditions to formulate their expectations. The method of extrapolation tends to exacerbate the cyclical behavior of the rental market.
The peculiarities of the office market make the cycles more severe than those observed with other fixed capitals. Specifically, office buildings are characterized
by high transactions costs, indivisibility, and heterogeneity that an actual supply
adjustment to demand and market changes involves long time lags and is hampered by inaccurate information. In most cases, the continually fluctuating
nature of the demand for office space is never sufficiently adjusted by supply.
is pervasive and significant.
2.4 Concluding Remarks
The office investment and stock data over the last 40 years reveal that office
buildings have become an increasingly important component of GNP as well as national private wealth. In terms of 1982 dollars, average annual office net investments in the last four decades (i.e., 1950s to 1980s) w'ere $935 million, $4,372 million, $7,310 million, and $16,263 million. Between 1947 and 1990, the
gross office stock quadrupled from approximately $110 billion to $440 billion. Particularly, the high office investment levels in the 1970s and 1980s propelled the office stock to more than double between 1970 and 1990.
The low investment levels in the 1950s and unusually high investment levels in
the 1980s are investigated in relation to office stock, other non-residential structures, capital, and GNP. Instead of finding a relatively constant share of office investment, one finds that the early-1950s was a period of unusually low (in fact negative) investment rates and that the 1980s was a period of unusually high investment rates.
The office vacancy rates between 1947 and 1991 indicate that: 1) the average vacancy rates have been rising; and 2) the cycles appear to be persistent. The
rising average vacancy rates seems to be caused by the increasing role of the rental
majority of the rental office investors, their proportional shares of total office
investment and stock have also increased dramatically in the 1980s. This appears to coincide with such high vacancy rates observed in the 1980s. The persistence
of vacancy cycles appears to be caused by: 1) the contrast in the timing between the building construction and building servicing periods; 2) the investment process
involves a very long gestation period; and 3) the lack of reliable forecast of
anticipated demand and supply responses.
Given the magnitude of volatility in the office market, there is a need to
understand its causes, and its implications by exploring the ways in which firms invest in and utilize office buildings. In doing so, it might be possible to forecast
such expected variations and, ultimately, expected excessive or shortage of investment may be managed to bring more stability in the market by the
government's fiscal or monetary policy. In the following chapter, past studies on
capital and office investment are presented along with some of problems associated with the models.
Chapter 3
A Review of Previous Studies
3.1 Introduction
This chapter is not intended to review all the studies that have explored the various incentives for complex capital investment decisions. Rather, it is meant to
discuss briefly two distinct categories of theoretical models that attempt to explain the determinants of capital investment and problems associated with the models. The first category consists of aggregate investment expenditure models developed
by macroeconomists. Due to the aggregation of various assets without respect to
their unique characteristics, empirical results of these models have not been very successful in their predicting performance. A greater problem in directly applying these models to the office market is that they do not explicitly recognize the rental
component of the office market. For example, in studying the impact of the TRA of
1986 on equipment and structures investments, Auerbach and Hassett [1991] were
able to explain much of variations in the equipment investments. However, in estimating the level of investment in structures, they could not even get a positive adjusted R2
. The second category of models is developed by real estate economists,
who have focused on the rental office market and ignored the owner-occupant
firms. Moreover, these models focus on variations in the property market and fail to consider the dynamic issues influenced by the capital market.
3.2 Past Models of Aggregate Investment Expenditures
Most of the existing investment models define the demand for investment as the difference between the desired and actual amount of stock, denoted K,* and K,.,
respectively. The speed of adjustment, denoted a, determines the rate at which the
gap between K,* and K,.1 is closed. If a were 0, then the gap does not change, whereas, if a were 1, then the gap is closed within one time period. The net
investment, denoted I, is:
I,=a;(K,*-K,-4)+p,. 1
where p, = p,+ to represent a stochastic disturbance.
To add flexibility to the equation, various forms of distributed lags have been
incorporated. Three notable models, which differ in determining the desired stock, are presented below.
One of the earliest investment models is the accelerator model developed by Clark
[1917], which assumes that a firm's desired stock is a constant function of its
output. Therefore, the investment level is a linear function of changes in the
output. This model has been criticized for its simplistic approach of measuring the
expected future conditions by the past level of output as a surrogate. Depending
on the surrounding circumstances, such as business cycles, firms are expected to
behave differently toward the investment level. Specifically, some of the problems of the model are: 1) a firm may increase its investment level for the purpose of improving its efficiency and future profitability without the past or current output
increasing; 2) if the level of output is falling rapidly, a firm may not be able to disinvest at the same rate; and 3) a firm exhibiting increasing return to scale experiences a decreasing level of investment rather than the constant level assumed in the model.
The neo-classical model developed by Hall and Jorgenson [1967] has been advanced to explicitly optimize the desired stock to interest rates, prices, tax policies, and output. The attractive feature of this model is that it allows substitution among capital, labor, and other inputs that the accelerator model does not. The crux of
the model is the estimation of the user-cost-of-capital that firms implicitly charge themselves, which equals the "market" rental rate in theory. The model specifies the user-cost-of-capital as a function of the opportunity cost of funds, depreciation rate of the capital, capital gains or losses, and effects of various taxes. While the model, being theoretically sound, specifies clearly the factors that determine the
demand for capital investment, empirical implementation of it has been hampered
by the difficulties in estimating the user-cost-of-capital. Specifically, they are: 1)
calculating marginal effective tax rates is inexact due to the complexity of tax laws; 2) measuring the discount rate is complicated by various sources (i.e., debt,
internal cash flows, and new equity) of funds and their respective costs; and 3) a
certain level of expected price appreciation or loss must be assumed when it is
some controversies arose as to whether the assumption that the elasticity of
substitution between capital and labor equals unity or zero. If it were zero and the elasticity of optimal capital stock with respect to output equals unity, then the
model reduces to the accelerator model.
Tobin's q model [1969] postulates that the level of investment depends on the ratio, known as q, of the market value to replacement value of the firm. This model
suggests that a firm would invest if its marginal q is greater than unity since the model assumes that the future profitability is completely summarized by the
market value. Tobin's q model can be related to the neoclassical model by transforming the q ratio, which is in terms of asset prices, to a revised ratio in
terms of flow prices. This is easily done by replacing the numerator with the market rental rate and the denominator with the user-cost-of-capital. Problems encountered in the empirical implementation of this model are: 1) difficulties in
calculating marginal q versus average q; 2) omission of intangible assets in calculating q; and 3) inability to value untraded debt obligations.
The prevalent and most serious problem of all these models is that all capital resources are treated homogeneously as if investment in equipment and structures can all be aggregated based on the monetary value. The process of this
aggregation ignores the complementarity characteristics of capital goods, which suggests that there exists an optimal combination of the capital goods that maximizes a firm's value. The economic implication of recognizing the
capital goods must be accounted for in order to understand the investment behavior.
3.3 Past Models of the Rental Office Market
Standard neo-classical office market models attempt to explain office investment, absorption, and rental rate adjustments -- three equations are typically developed and tested empirically. Most of the studies are extensions of Rosen [1984] and
Wheaton [1987], who originally developed office market models. Rosen theorizes that: 1) investment is a function of expected rental rate, vacancy rate, construction costs, interest rates, and tax laws; 2) absorption is a function of office employment,
and rental rate; and 3) change in rental rate is a function of actual and optimal vacancy rates, where the optimal vacancy rate is further assumed to be the sample average. Unexpectedly, Rosen's empirical results reveal that only the lagged
vacancy rates is significant in determining the investment level.
Wheaton postulates that: 1) investment level is a function of real rental rate, vacancy rate, office employment growth rate, amount of stock, construction costs, and short-term interest rates; 2) absorption is a function of real rental rate, the level of office employment, and office employment growth rate; and 3) change in
real rental rate is a function of actual and a constant structural vacancy rates. In the absence of a reasonably reliable real rental rate series, he assumed that the difference between actual and structural vacancy rates with appropriate lag
determines the movement of real rental rates. For example, a relatively high (low)