HAL Id: hal-01199308
https://hal.univ-reunion.fr/hal-01199308
Submitted on 29 May 2020
HAL is a multi-disciplinary open access
archive for the deposit and dissemination of
sci-entific research documents, whether they are
pub-lished or not. The documents may come from
teaching and research institutions in France or
abroad, or from public or private research centers.
L’archive ouverte pluridisciplinaire HAL, est
destinée au dépôt et à la diffusion de documents
scientifiques de niveau recherche, publiés ou non,
émanant des établissements d’enseignement et de
recherche français ou étrangers, des laboratoires
publics ou privés.
Xanthomonas axonopodis
Nadia Mhedbi-Hajri, Ahmed Hajri, Tristan Boureau, Armelle Darrasse,
Karine Durand, Chrystelle Brin, Marion Fischer-Le Saux, Charles Manceau,
Stéphane Poussier, Olivier Pruvost, et al.
To cite this version:
Nadia Mhedbi-Hajri, Ahmed Hajri, Tristan Boureau, Armelle Darrasse, Karine Durand, et al..
Evo-lutionary History of the Plant Pathogenic Bacterium Xanthomonas axonopodis. PLoS ONE, Public
Library of Science, 2013, 8 (3), pp.e58474. �10.1371/journal.pone.0058474�. �hal-01199308�
Xanthomonas axonopodis
Nadia Mhedbi-Hajri1,2,3, Ahmed Hajri1,2,3, Tristan Boureau1,2,3, Armelle Darrasse1,2,3, Karine Durand1,2,3, Chrystelle Brin1,2,3, Marion Fischer-Le Saux1,2,3, Charles Manceau1,2,3, Ste´phane Poussier1,2,3,
Olivier Pruvost4, Christophe Lemaire1,2,3., Marie-Agne`s Jacques1,2,3*.
1 INRA, UMR1345 Institut de Recherche en Horticulture et Semences, Beaucouze´, France, 2 Universite´ d’Angers, UMR1345 Institut de Recherche en Horticulture et Semences, SFR4207 QUASAV, PRES L’UNAM, Angers, France,3 AgroCampus-Ouest, UMR1345 Institut de Recherche en Horticulture et Semences, Angers, France, 4 CIRAD, UMR PVBMT, Saint Pierre, Cedex Re´union, France
Abstract
Deciphering mechanisms shaping bacterial diversity should help to build tools to predict the emergence of infectious diseases. Xanthomonads are plant pathogenic bacteria found worldwide. Xanthomonas axonopodis is a genetically heterogeneous species clustering, into six groups, strains that are collectively pathogenic on a large number of plants. However, each strain displays a narrow host range. We address the question of the nature of the evolutionary processes – geographical and ecological speciation – that shaped this diversity. We assembled a large collection of X. axonopodis strains that were isolated over a long period, over continents, and from various hosts. Based on the sequence analysis of seven housekeeping genes, we found that recombination occurred as frequently as point mutation in the evolutionary history of X. axonopodis. However, the impact of recombination was about three times greater than the impact of mutation on the diversity observed in the whole dataset. We then reconstructed the clonal genealogy of the strains using coalescent and genealogy approaches and we studied the diversification of the pathogen using a model of divergence with migration. The suggested scenario involves a first step of generalist diversification that spanned over the last 25 000 years. A second step of ecology-driven specialization occurred during the past two centuries. Eventually, secondary contacts between host-specialized strains probably occurred as a result of agricultural development and intensification, allowing genetic exchanges of virulence-associated genes. These transfers may have favored the emergence of novel pathotypes. Finally, we argue that the largest ecological entity within X. axonopodis is the pathovar.
Citation: Mhedbi-Hajri N, Hajri A, Boureau T, Darrasse A, Durand K, et al. (2013) Evolutionary History of the Plant Pathogenic Bacterium Xanthomonas axonopodis. PLoS ONE 8(3): e58474. doi:10.1371/journal.pone.0058474
Editor: Keith A. Crandall, George Washington University, United States of America Received September 18, 2012; Accepted February 5, 2013; Published March 7, 2013
Copyright: ß 2013 Mhedbi-Hajri et al. This is an open-access article distributed under the terms of the Creative Commons Attribution License, which permits unrestricted use, distribution, and reproduction in any medium, provided the original author and source are credited.
Funding: N. Mhedbi-Hajri and A. Hajri were supported by grants from the Tunisian Government, from CG Maine et Loire and from INRA. This study was funded by the Region Pays de la Loire (Xanthost) and the Plant Health and Environment Department of INRA (SPE 2007-0077-01, AIP Bioressources 2008-077-01). The funders had no role in study design, data collection and analysis, decision to publish, or preparation of the manuscript.
Competing Interests: The authors have declared that no competing interests exist. * E-mail: [email protected]
.These authors contributed equally to this work.
Introduction
Determining the relative part played by geography and ecological specialization in the reproductive isolation between populations of pathogens is still a great challenge [1], [2]. The extent of isolation between pathogen populations is conditioned by the divergence accumulated in allopatry or by the degree of adaptation to hosts. In complete allopatry, genetic reproductive barriers are less likely to be selected than in sympatry [3], and gene flow remains possible for populations that have diverged for a long time (several million years) [4]. Conversely, specialization on hosts greatly contributes to reproductive isolation and limits gene flow. Host specialization was promoted by plant domestication, which led to a reduction of host genetic variability, and by the development of agriculture, which has uniformized crops and increased host density [5]. More recently, the globalization of agriculture has strongly contributed to breaking natural barriers to dispersal, thereby reducing the geographic isolation and increasing opportunities for gene flow. Subsequent propagation of many
pathogens allowed secondary contacts between populations, which have diverged in allopatry [6]. Would such a return to sympatry be sufficient to promote gene flow between these populations of pathogens? The study of the relative importance of gene flow and divergence times between populations occupying different hosts then becomes crucial for understanding evolutionary histories and emergences of pathogens [7], [8].
Unlike for sexual eukaryotes, the classical biological species definition does not apply for prokaryotes, which are asexually reproducing organisms. Bacteria, rather, form ecologically isolated units called ecotypes [9]. The pathovar is an infrasubspecific division that was created to group pathogenic bacteria that display the same symptomatology on the same host range [10]. Would the ecological cohesion of the ecotype concept be found in the pathovar concept? The extent of reproductive isolation among pathovars remains to be clarified, because ecological isolation may be associated with reproductive isolation. Bacteria are mainly clonal but can exchange genes or fragments of their genomes through horizontal gene transfer. Such transfers would be
interpreted as recombination events in molecular polymorphism studies. Under the biological species concept for eukaryotes, reproductive isolation can be monitored by a strong decrease in recombination rates between species. In prokaryotes, sequence divergence, as a factor potentially involved in the decrease of recombination efficiency, would play only a little role in the genetic cohesion of bacterial species [11].
Recombination rates are not expected to be homogeneous among loci. Niche-neutral genes such as housekeeping genes are expected to recombine more freely than niche-specifying-genes [12]. For the latter, their transfer into a focus population adapted to a different niche implies a fitness cost resulting in negligible recombination rates. Alternatively, some virulence-associated (VA) genes may act as niche-transcending (NT) genes. NT genes confer a gain of fitness when transferred to a new ecotype (adaptive introgression). The increasing genetic exchanges among strains, due to agricultural globalization, may involve horizontal gene transfer of NT (VA) genes. In the latter case, the emergence of strains with new pathological competences becomes likely.
Bacteria belonging to the genus Xanthomonas are collectively responsible for diseases on more than 400 different host plants, among which many are economically important crops [13]. The physiological characteristics of Xanthomonas are very homogeneous. However, the diversity within this genus is highlighted by pathogenicity and host ranges. Each strain displays a narrow host range, and strains causing similar symptoms on the same host range are grouped into a pathovar [10]. These plant-associated bacteria are not known to colonize other environments such as soil or water. Symptomatic cultivated hosts are generally the best known hosts; weeds and asymptomatic hosts remain difficult to identify. The species X. axonopodis (sensu Vauterin and collaborators [14], [15]) groups strains that are collectively pathogenic on highly diverse crops. DNA:DNA hybridizations, Rep-PCR, and AFLP genomic fingerprintings show that X. axonopodis does not form a coherent group but comprises six groups named 9.1 to 9.6 [16], [17], [18]. Different MLSA-based studies support this delineation into six groups within X. axonopodis indicating a strong but undetermined biological signification for these groupings [16], [17], [19], [20], [21], [22]. Up to now, there has been no obvious ecological rationale such as host range, tissue specificity, or geographical origin to the clustering into six groups. So the nature of the evolutionary processes at the origin of these six groups as well as the extent of isolation between them remains unknown. In addition, within each of these six groups, numerous pathovars are defined only on a phenotypical basis, making each group pathologically heterogeneous.
To derive the parameters of X. axonopodis evolutionary history, we used a coalescent-based analysis. The coalescent framework uses DNA sequence data to infer genealogies of a population sample back in Time to the Most Recent Common Ancestor (TMRCA) [23]. We used two complementary methods, one taking recombination and clonal inheritance into account [24], [25] and the other assuming a model of divergence with migration [26] particularly well suited for pathogen diversification [5]. We address the following questions: does the coalescent analysis divide X. axonopodis into six groups as other methods did? If so, what is the history of divergence between these groups? What is the most likely mechanism of reproductive isolation for these groups: geography or ecology? Ancient ecological specialization would produce a pattern of divergence matching with host-divergences, whereas geography and/or recent host-jumps may reflect a divergence pattern independent from host divergence. Finally, would the recent increase in agriculture and human-based
transfers have favored gene exchanges between formerly divergent populations?
Materials and Methods Strain Sampling
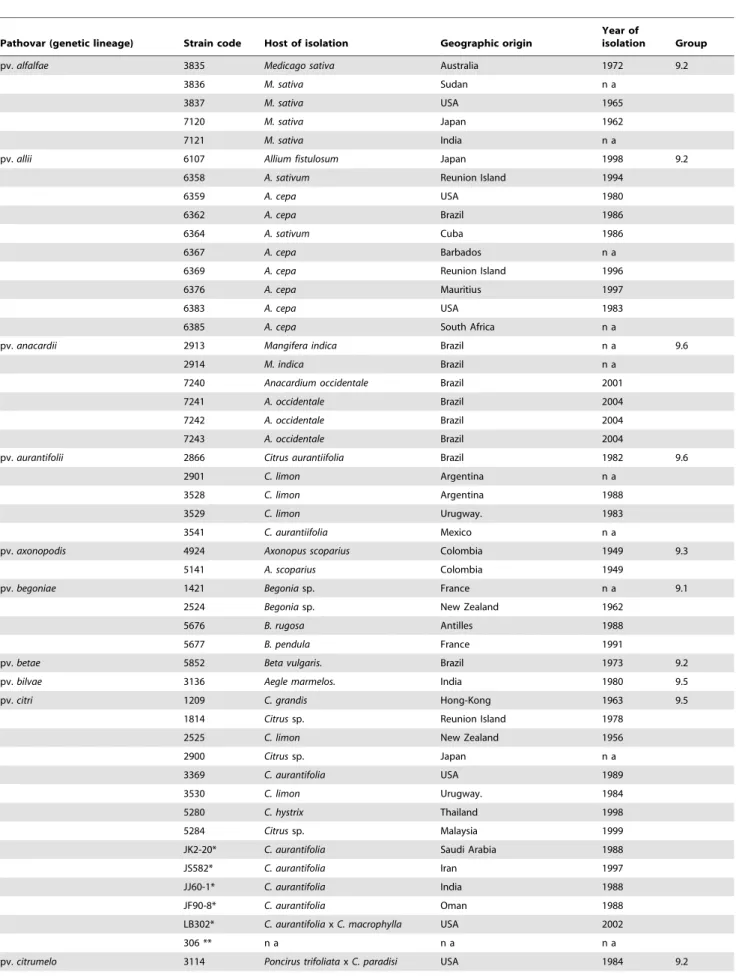
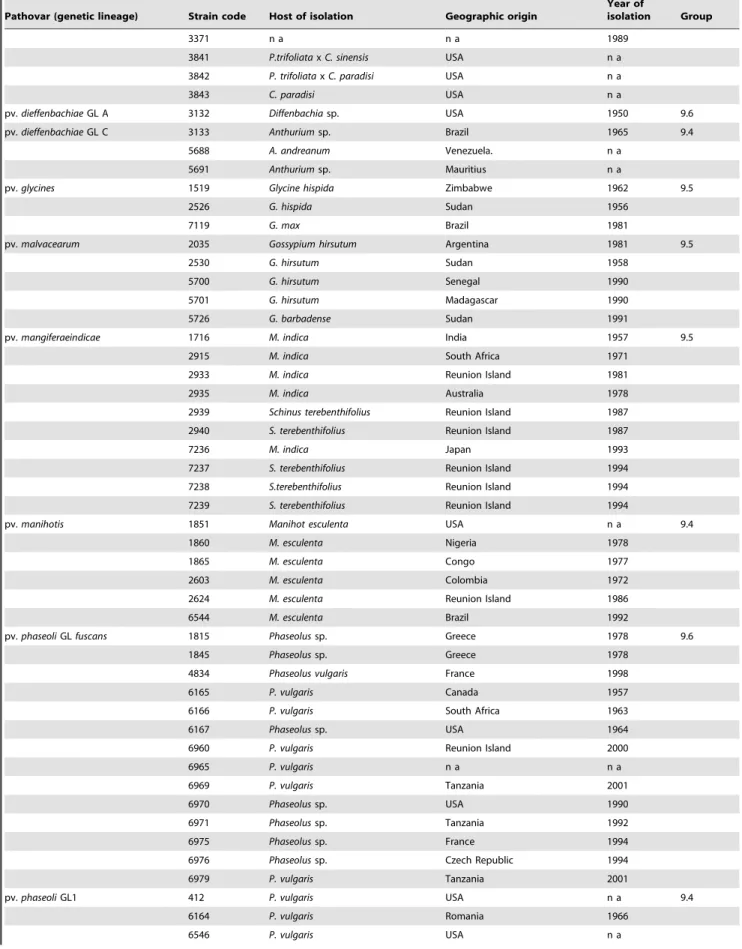
A collection of 131 strains of X. axonopodis belonging to 21 pathovars with valid names was selected from the French Collection of Plant Pathogenic Bacteria (CFBP, Angers, France, http://www.angers.inra.fr/cfbp/index_e.html) (Table 1). Most of these pathovars are monophyletic on the basis of previous MLSA-based studies. However, pathovar dieffenbachiae is composed of two different clusters of strains displaying different pathological specificities that should be considered as distinct pathovars but have not yet been defined as such [17]. Pathovar phaseoli is also genetically diverse and is composed of four genetic lineages, each harboring different sets of genes involved in pathogenicity [27], [28]. Thus 25 genetic lineages that we consider as 25 pathovars are represented in the present analysis. When possible, not less than five strains were sampled in each pathovar. Samples were collected in different geographical areas, on various hosts and over different years. Bacterial cultures were stored in 40% glycerol at 280uC for long term preservation. They were checked for purity and routinely cultivated on YPGA (yeast extract, 7 g liter21; peptone, 7 g liter21; glucose, 7 g liter21; agar, 18 g liter21) for 2–4 days at 28uC.
DNA Extraction
Suspensions made from fresh cultures (overnight growth at 28uC under agitation in YP broth: yeast extract, 7 g liter21
; peptone, 7 g liter21; pH 7.2) were used for DNA extraction using the standard hexadecyltrimenthylammonium bromide method [29]. Quality and quantity of DNA were spectrophotometrically (Nanodrop ND-100, Nanodrop Technologies) adjusted. Then, the extracted DNAs were aliquoted and stored at 220uC in microtubes.
Gene Amplification and Sequencing
Primers for partial sequencing of seven housekeeping genes (atpD: ATP synthase beta chain, dnaK: encoding the 70-kDa heat shock protein, efp: elongation factor P, fyuA coding a transmem-brane protein (Ton-B dependent transporter), glnA: glutamine synthetase I, gyrB: DNA gyrase subunit B, and rpoD: RNA polymerase sigma 70 factor) were designed (Table 2) from genomic Xanthomonas sequences available in GenBank: X. axonopodis pv. vesicatoria AM039952 and X. axonopodis pv. citri AE008923. PCR amplifications were performed in a 50ml reaction mixture containing 1X Go Taq Buffer (Promega), 200mM dNTP, 0.5mM of each primer (Table 2), 0.4 U of Go Taq Polymerase, and 3 ng of template genomic DNA in an Applied Biosystems thermocycler with an initial denaturation at 94uC for 2 min, 30 cycles of denaturation for 1 min at 94uC, annealing for 1.5 min at a gene specific temperature (Table 2), extension for 1.5 min at 72uC, and a final extension for 10 min at 72uC. Purity and yield of PCR products were checked by running 8ml reaction mixtures in 1.2% agarose gel and post-staining using ethidium bromide. The remaining amplified PCR products were sequenced with reverse and forward primers at the Biogenouest platform (Nantes, France).
Sequence Acquisition and Alignment
Forward and reverse nucleotide sequences were edited and assembled by using PREGAP4 and GAP4 of the Staden Package [30] and then translated and aligned using CLUSTAL W-based subalignment tool with default parameters [31] available in
Table 1. List of X. axonopodis strains used in the study.
Pathovar (genetic lineage) Strain code Host of isolation Geographic origin
Year of
isolation Group
pv. alfalfae 3835 Medicago sativa Australia 1972 9.2
3836 M. sativa Sudan n a
3837 M. sativa USA 1965
7120 M. sativa Japan 1962
7121 M. sativa India n a
pv. allii 6107 Allium fistulosum Japan 1998 9.2
6358 A. sativum Reunion Island 1994
6359 A. cepa USA 1980
6362 A. cepa Brazil 1986
6364 A. sativum Cuba 1986
6367 A. cepa Barbados n a
6369 A. cepa Reunion Island 1996
6376 A. cepa Mauritius 1997
6383 A. cepa USA 1983
6385 A. cepa South Africa n a
pv. anacardii 2913 Mangifera indica Brazil n a 9.6
2914 M. indica Brazil n a
7240 Anacardium occidentale Brazil 2001
7241 A. occidentale Brazil 2004
7242 A. occidentale Brazil 2004
7243 A. occidentale Brazil 2004
pv. aurantifolii 2866 Citrus aurantiifolia Brazil 1982 9.6
2901 C. limon Argentina n a
3528 C. limon Argentina 1988
3529 C. limon Urugway. 1983
3541 C. aurantiifolia Mexico n a
pv. axonopodis 4924 Axonopus scoparius Colombia 1949 9.3
5141 A. scoparius Colombia 1949
pv. begoniae 1421 Begonia sp. France n a 9.1
2524 Begonia sp. New Zealand 1962
5676 B. rugosa Antilles 1988
5677 B. pendula France 1991
pv. betae 5852 Beta vulgaris. Brazil 1973 9.2
pv. bilvae 3136 Aegle marmelos. India 1980 9.5
pv. citri 1209 C. grandis Hong-Kong 1963 9.5
1814 Citrus sp. Reunion Island 1978
2525 C. limon New Zealand 1956
2900 Citrus sp. Japan n a
3369 C. aurantifolia USA 1989
3530 C. limon Urugway. 1984
5280 C. hystrix Thailand 1998
5284 Citrus sp. Malaysia 1999
JK2-20* C. aurantifolia Saudi Arabia 1988
JS582* C. aurantifolia Iran 1997
JJ60-1* C. aurantifolia India 1988
JF90-8* C. aurantifolia Oman 1988
LB302* C. aurantifolia x C. macrophylla USA 2002
306 ** n a n a n a
Table 1. Cont.
Pathovar (genetic lineage) Strain code Host of isolation Geographic origin
Year of
isolation Group
3371 n a n a 1989
3841 P.trifoliata x C. sinensis USA n a
3842 P. trifoliata x C. paradisi USA n a
3843 C. paradisi USA n a
pv. dieffenbachiae GL A 3132 Diffenbachia sp. USA 1950 9.6
pv. dieffenbachiae GL C 3133 Anthurium sp. Brazil 1965 9.4
5688 A. andreanum Venezuela. n a
5691 Anthurium sp. Mauritius n a
pv. glycines 1519 Glycine hispida Zimbabwe 1962 9.5
2526 G. hispida Sudan 1956
7119 G. max Brazil 1981
pv. malvacearum 2035 Gossypium hirsutum Argentina 1981 9.5
2530 G. hirsutum Sudan 1958
5700 G. hirsutum Senegal 1990
5701 G. hirsutum Madagascar 1990
5726 G. barbadense Sudan 1991
pv. mangiferaeindicae 1716 M. indica India 1957 9.5
2915 M. indica South Africa 1971
2933 M. indica Reunion Island 1981
2935 M. indica Australia 1978
2939 Schinus terebenthifolius Reunion Island 1987
2940 S. terebenthifolius Reunion Island 1987
7236 M. indica Japan 1993
7237 S. terebenthifolius Reunion Island 1994
7238 S.terebenthifolius Reunion Island 1994
7239 S. terebenthifolius Reunion Island 1994
pv. manihotis 1851 Manihot esculenta USA n a 9.4
1860 M. esculenta Nigeria 1978
1865 M. esculenta Congo 1977
2603 M. esculenta Colombia 1972
2624 M. esculenta Reunion Island 1986
6544 M. esculenta Brazil 1992
pv. phaseoli GL fuscans 1815 Phaseolus sp. Greece 1978 9.6
1845 Phaseolus sp. Greece 1978
4834 Phaseolus vulgaris France 1998
6165 P. vulgaris Canada 1957
6166 P. vulgaris South Africa 1963
6167 Phaseolus sp. USA 1964
6960 P. vulgaris Reunion Island 2000
6965 P. vulgaris n a n a
6969 P. vulgaris Tanzania 2001
6970 Phaseolus sp. USA 1990
6971 Phaseolus sp. Tanzania 1992
6975 Phaseolus sp. France 1994
6976 Phaseolus sp. Czech Republic 1994
6979 P. vulgaris Tanzania 2001
pv. phaseoli GL1 412 P. vulgaris USA n a 9.4
6164 P. vulgaris Romania 1966
MEGA 4.0.2 program [32] to obtain high quality sequences. Multiple alignments were manually edited using BIOEDIT program [33]. Amino acid alignments were transposed back to nucleotide sequence level to obtain a codon-based alignment [33]. Sequences were concatenated following the alphabetic order of the genes ending in a sequence of 5466 bp (1–777 for atpD, 778–1674 for dnaK, 1675–2034 for efp, 2035–2898 for fyuA, 2899–3882 for glnA, 3883–4683 for gyrB, and 4684–5466 for rpoD).
The Genbank accession numbers for the partial sequences used in this study are: atpD: HQ590543 to HQ590673, dnaK: HQ590674 to HQ590804, efp: HQ590805 to HQ590935, fyuA: HQ590936 to HQ591066, glnA: HQ591067 to HQ591197, gyrB: HQ591198 to HQ591328, and rpoD: HQ591329 - HQ591338.
Statistical Analyses
All summary statistics and genealogical analyses were carried out at the level of X. axonopodis; no outgroup is needed with these methods. Occurrence of intragenic and intergenic recombination was analyzed using the four gametes test of Hudson and Kaplan [34] implemented in DnaSP v.5 [35] and seven non-parametric detection programs implemented in RDP version 3.38 [36]: RDP [37], GENECONV [38], MaxChi [39], Chimaera [40], BootScan [41], SiScan [42], and 3Seq [43]. The analysis was performed with default settings for the different detection methods, and the Bonferroni-corrected P-value cut-off was set at 0.05. Recombina-tion events were accepted when detected with at least three detection methods out of seven. The Web-based service GARD (genetic algorithm for recombination detection) was also used to Table 1. Cont.
Pathovar (genetic lineage) Strain code Host of isolation Geographic origin
Year of
isolation Group
6982 P. vulgaris Reunion Island 2000
6983 P. vulgaris Reunion Island 2000
6984 P. vulgaris Reunion Island 2000
6985 P. vulgaris Reunion Island 2000
pv. phaseoli GL2 6988 P. vulgaris Reunion Island 2000 9.6
6990 P. vulgaris Reunion Island 2000
6991 P. vulgaris Reunion Island 2000
pv. phaseoli GL3 6992 P. vulgaris Reunion Island 2000 9.6
6994 P. vulgaris Tanzania 1990
6996 P. vulgaris Reunion Island 2000
6993 P. vulgaris Reunion Island 2000
pv. ricini 5863 Ricinus communis Brazil 1981 9.2
5864 R. communis Brazil 1995
5865 R. communis Brazil 1995
6541 R. communis Brazil 1981
6542 R. communis Brazil 1985
pv. spondiae 2547 Spondias dulcis Mauritius 1985 9.1
pv. vasculorum 1289 Saccharum officinarum Reunion Island 1970 9.3
5696 Thysanolaena maxima Reunion Island n a
5822 S. officinarum Australia 1946
5823 S. officinarum Mauritius 1979
pv. vesicatoria 75-3** Lycopersicon esculentum n a n a 9.2
1604 Capsicum annuum Guadeloupe n a
2484 L. esculentum Guadeloupe 1980
5594 L. esculentum Guadeloupe 1993
5618 C. annuum USA n a
6817 n a Thailand 1997
6864 C. frutescens USA 1947
pv. vignicola 7110 Vigna unguiculata Zimbabwe n a 9.6
7111 V. sinensis USA 1942
7112 V. unguiculata USA 1942
7113 V. unguiculata Sudan 1966
7115 V. sinensis Brazil 1978
CFBP (French Collection of Plant Pathogenic Bacteria) code for strain (Strain code) except * which were provided by O. Pruvost, Cirad, Reunion Island, France and ** code of the reference strains whose genome are publicly available. All strains were provided by the CFBP. Genetic group number (Group) from Rademaker et al. (2005); not available (n a).
detect and locate recombination breakpoints [44]. All the sequences of the 131 strains of X. axonopodis were analyzed under a coalescent framework, in order to take into account all the nucleotidic variation between sequences [24] and to permit the inference of genetic parameters between populations [26], [45]. Haplotype number (Hap), haplotype diversity (Hd; [46]), nucleo-tidic diversities (hp; [46], and hw;[47]), and neutrality test results
(Tajima’s D: [48] and Fu and Li’s D* and F*; [49]) were obtained for each of the seven genes for each population using DnaSP. Bonferroni’s correction for multiple tests [50] was applied.
Clonal genealogy of the 131 strains was estimated using ClonalFrame [24]. Parameter space was explored using a Markov Chain Monte Carlo (MCMC) simulation of 100,000 iterations, of which 30,000 were considered as burn-in. The interval of genealogy sampling was set at 50, which ensured good indepen-dence between successive sampling. A 50% consensus tree was produced. Parameters estimated were the mutational rate h, the intragenic recombination rate R, the average length of a recombination event d, the rate n of new polymorphism introduced by recombination, and the TMRCA. Two additional statistics, r/m and r/h, represent, respectively, a measure of the impact of the recombination (r) relative to mutation (m) in the diversity of the sample, and a measure of the rate of recombination per site (r) relative to the mutation rate (h). A first analysis was performed on the global dataset. Additional analyses were performed on each population dataset.
Migration rates and divergence time between clusters and their ancestors inferred by ClonalFrame were estimated using the Isolation-with-Migration model of Hey implemented in IMa2 [26]. It was not possible to analyze the dataset at the scale of the 25 genetic lineages because of computation issues [26] and because the DNA sequence dataset was not large enough. In the IMa2 model, an ancestral population of size NA
splits at a time t into two populations of respective sizes N1and
N2, which may occasionally exchange a small number of
migrants after divergence. Here, migration refers to homologous recombination events affecting housekeeping genes between strains of different clusters. The genealogy given by Clonal-Frame makes it possible to set ancestral nodes for estimations of
ancestral effective size and divergence time. As our dataset violates the assumption of no recombination within loci, we used the four gametes-test implemented in DnaSP [35] and identified blocks undergoing recombination. These blocks were discarded and the remaining dataset was divided into a set of 94 non-recombinant loci, as suggested in Hey and Nielsen [51]. Priors for h parameter within each population are provided by estimates obtained using ClonalFrame. Parameter space is explored by a heuristic MCMC exploration, and posterior distributions of each parameter are then generated. We used 30,000,000 MCMC iterations with genealogy sampling per-formed every 100 iterations. The first 1,000,000 iterations were discarded as burn-in. Mixing and convergence were obtained by running 100 Metropolis coupled-chains with 100 chain swap-ping attempts between iterations. The number of migrants between populations per generation was obtained using m estimated by IMa2 and h estimated by ClonalFrame as it assumes clonal inheritance. A generation time of 0.003 year was used.
Heterochronous sampling of strains allows estimating mutation rates by Beast 1.6.1 [52]. This method was applied to those strains for which year of isolation was known. Comparison of clock models using Bayesian Factors in Tracer 1.5 indicated that the strict clock model best fitted our dataset, relative to the lognormal relaxed model (data not shown). Statistical inferences of mutation rates as well as of demography were also performed under the Extended Bayesian Skyline Plot (EBSP) model [53]. Such a model allows for population size changes, a likely situation for pathogens [54], [55], [56]. As population structure may bias estimations of mutation rates, the latter were estimated for each of the six groups independently. Estimated mutation rates were entered as inputs in IMa2 analyses.
Additionally, IMa2 results previously obtained were compared to results of IMa2 pairwise analyses. We took into account the Clonal Frame genealogy to perform pairwise analyses between populations defined at each node: 9.4 vs. 9.1; 9.4–9.1 vs. 9.2; 9.5 vs. 9.6; 9.5–9.6 vs. 9.3; 9.1–9.2–9.4 vs. 9.3–9.5–9.6. Reducing the number of parameters led to estimates that were not significantly Table 2. Primers characteristics.
Locus
Sequence of forward (F)
and reverse (R) primers (59 R 39) Fragment length (bp) Annealing temperature (6C)
atpD F: GGGCAAGATCGTTCAGAT 868 60 R: GCTCTTGGTCGAGGTGAT dnaK F: GGTATTGACCTCGGCACCAC 1034 60 R: ACCTTCGGCATACGGGTCT efp F: TCATCACCGAGACCGAATA 445 62 R: TCCTGGTTGACGAACAGC fyuA F: ACCATCGACATGGACTGGACC 963 60 R: GTCGCCGAACAGGTTCACC glna F: ATCAAGGACAACAAGGTCG 1094 60 R: GCGGTGAAGGTCAGGTAG gyrB F: TGCGCGGCAAGATCCTCAAC 1051 60 R: GCGTTGTCCTCGATGAAGTC rpoD F: ATGGCCAACGAACGTCCTGC 1313 60 R: AACTTGTAACCGCGACGGTATTCG doi:10.1371/journal.pone.0058474.t002
different with the two approaches, thus strengthening our conclusions.
Population Clustering
We performed a Bayesian clustering analysis using Structure version 2.3 [57] to estimate the number of populations in our dataset. We used the linkage model, which accounts for linkage disequilibrium between nearby sites that occurs in admixed populations [58]. Thirty independent runs were performed for each value of number of populations K = 1 to 30. Each run consisted of 500,000 Markov Chain Monte Carlo (MCMC) iterations of burn-in followed by 1,500,000 MCMC iterations. Optimal values of K were found using the method developed by Evanno et al. [59]. The average cluster membership coefficient was calculated by aligning outputs of the 30 runs of each K-clustering with CLUMPP [60], using the ‘‘Greedy’’ algorithm with random input order and 10,000 permutations.
Inference of Repertoires of Virulence-associated (VA) Genes at Ancestor Nodes
Repertoires of 107 genes coding different VA proteins (Methyl accepting Chemotaxis Proteins –MCPs-, sensory proteins of two component regulatory systems, adhesins and Type III Effectors -T3Es-) were determined, for each strain of this study in previous studies, by Hajri et al. [27] and Mhedbi-Hajri et al. [28]. Using the Mesquite 2.5 system for phylogenetic computing [61], the matrix of presence/absence of these genes for each strain was associated to the scenario for genealogy obtained in ClonalFrame. Reper-toires of genes at nodes of the ClonalFrame genealogy were inferred by parsimony using the Trace Character History function implemented in Mesquite.
We explored the possibility that recombination events, identified by IMA2 on the basis of analysis of seven housekeeping genes, may have occurred with the transfer of some genes belonging to the repertoires of VA genes. Indeed, for each migration event between strains identified by IMA2, we assigned a node considered as donor and a node considered as recipient. We considered that a character may have been horizontally transferred when it is present in the donor, absent in the recipient, but present in descendants of the recipient node. Such an acquisition would correspond to a niche-transcending adaptation [12].
Results
A Two-step Evolutionary History within X. axonopodis
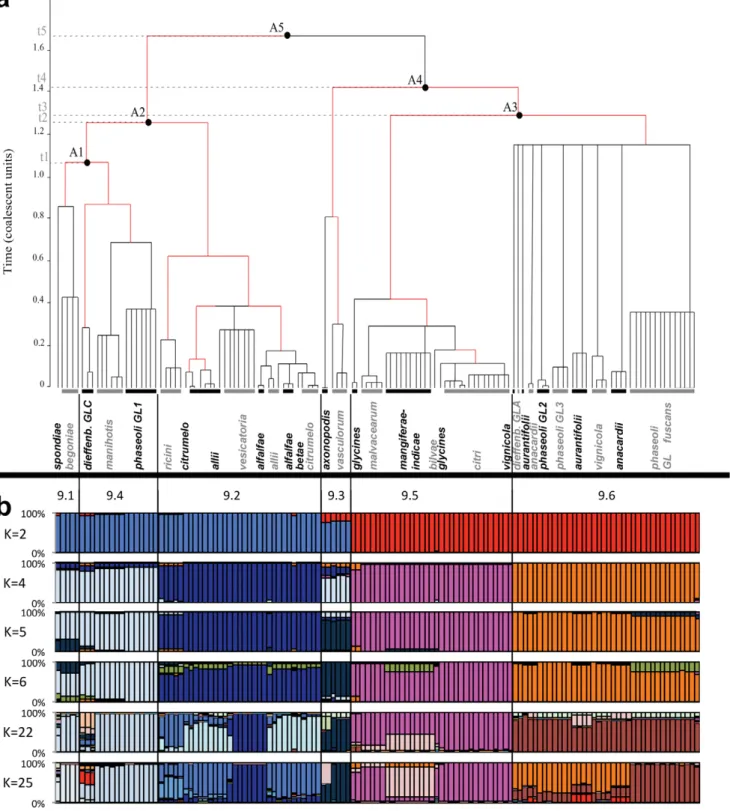
Combining the genealogy and Bayesian clustering approaches revealed an overlapping of two levels of clustering. The clustering of X. axonopodis strains into six groups corresponding to rep-PCR groups [17] is strongly supported by the majority-rule genealogy inferred from ClonalFrame analysis (Figure 1). This analysis clustered groups 9.1, 9.2, and 9.4 in one clade and groups 9.3, 9.5, and 9.6 in another clade. In the former clade, group 9.2 diverged first and then 9.1 and 9.4. In the latter clade, group 9.3 diverged first and then 9.5 and 9.6 (Figure 1). However, branching of 9.3 with 9.5 and 9.6 was less robust than other nodes (data not shown). Stricter consensus (i.e. with nodes that appeared in more than 60% of cases in the posterior genealogy distribution) genealogies put 9.3 at the same level as the common ancestor; the other nodes remained valid. Alternatively to the genealogy, Structure analysis using K = 2 revealed clustering of 9.3 with 9.1, 9.2 and 9.4 which is disputable according to lower assignment probabilities (Figure 1). Using K = 6 on the overall data set, strains were mainly assigned to five clusters. Indeed, Structure analysis could not differentiate
groups 9.1 and 9.4. Combination of both clustering methods demonstrated that grouping of strains into groups 9.1 to 9.6 represents a first episode of divergence. This episode is not yet achieved as 9.1 and 9.4 did not form totally distinct populations (Figure 1).
A second divergence episode can be observed when looking at pathovars. Genealogy showed that divergence among pathovars could be observed only on terminal branches (Figure1). Of note, all pathovars (as defined in Material and methods) were restricted to one of the six groups and most formed monophyletic clusters of strains. Within a group, some pathovars formed paraphyletic clusters. This is the case for pathovars allii (four clusters), alfalfae (two clusters), citrumelo (two clusters) in group 9.2, for pathovars glycines (two clusters) and anacardii (two clusters) in group 9.5, and for pathovar aurantifolii (two clusters) in group 9.6. For all groups, Time to the Most Recent Common Ancestor (TMRCA) was below 1.2 coalescent units. A star-like genealogy can be observed within group 9.6. This suggests a putative unique event of radiation within 9.6, whereas in the other groups pathovars emerged more gradually (Figure 1).
Populations of X. axonopodis are at Mutation/Drift Equilibrium
All analyzed loci presented a similar level of polymorphism. A total of 62 haplotypes was found in the dataset using concatenated genes (Table S1). Each haplotype belonged to a single pathovar. Within groups and within pathovars, no obvious trend was observed between sample size and level of polymorphism. The nucleotidic hpand Watterson hWdiversity estimators among all
genes were estimated for groups and pathovars. No significant departures from mutation/drift were detected at each level of clustering, i.e. the overall dataset and each of the six groups and pathovars (Table S1). Of note, the nucleotidic diversity hpwas null
for 11 out of 21 pathovars, suggesting that they could have emerged recently.
Recombination is an Important Factor in the Evolution of X. axonopodis
Evidence of recombination provides valuable information about the intensity of gene flow among strains. To screen for evidence of recombination within X. axonopodis, nine methods were employed. Because each method may be sensitive to different kinds of biases, combining different methods allows for the selection of events detected by most methods. Hence, we considered as reliable those events that are detected by most of the methods. Six of the seven detection methods implemented in RDP3 software detected 41 recombinant haplotypes among 62 haplotypes. These recombination events affected strains from pathovars alfalfae, allii, betae, citrumelo, dieffenbachiae GL C, manihotis, phaseoli GL1, and ricini. The importance of recombination was confirmed using GARD and DnaSp softwares (data not shown). Using coalescence analysis, we estimated the relative impor-tance of recombination vs. point mutation in the emergence of novel haplotypes. Significant recombination was found in the genealogy of the whole dataset (R = 12.43[9.12–15.59]) and in the genealogy of the six groups separately (Table 3). Recom-bination was found to occur as frequently as point mutation in the history of the 131 strains (r/h = 0.97 [0.42–1.84]). The mean tract length of the recombinant fragment (d) was 554 [403–742] bp. However, the impact of recombination was about three times greater than mutation on the diversity observed in the whole dataset (r/m = 3.18 [1.71–5.38]). The rate of new polymorphism introduced by recombination was about 1% for
Figure 1. Genetic structure ofX. axonopodis. (a) Majority-rule consensus genealogy inferred by ClonalFrame. Captions 9.1 to 9.6 refer to genetic groups within X. axonopodis. Populations A1 to A5 represent ancestral populations. Parameters were estimated from the sampling of 100 000 iterations of 131 strains typed on 94 non-recombinant loci. Red branches indicate significant occurrence of recombination (p.0.9). Despite being grouped in the same rake, strains may contain different closely related haplotypes. Limit of node age was set at 1.2 in coalescence unit. (b) Cluster analysis using STRUCTURE 2.3 with Linkage model. Four clustering are shown here for K = 2, 4, 5, 6, 21, 22 and. For each K, 30 independent runs were performed and analyzed using CLUMPP with 10,000 permutations. For each run, we used ten independent chains assuming different starting points, and for each chain 5.105steps for burnin followed by 1.5 6 106iterations with a thinning interval of 10 steps. Strains appear in the same order as in
the ClonalFrame coalescent.
the whole dataset and ranged from 0.003 in group 9.6 to 0.02 in group 9.2 (Table 3). Recombination occurred on some branches (p.90%) (Figure 1).
Isolation-with-Migration Model Reveals a Deep Evolutionary History and Recent Migration Events
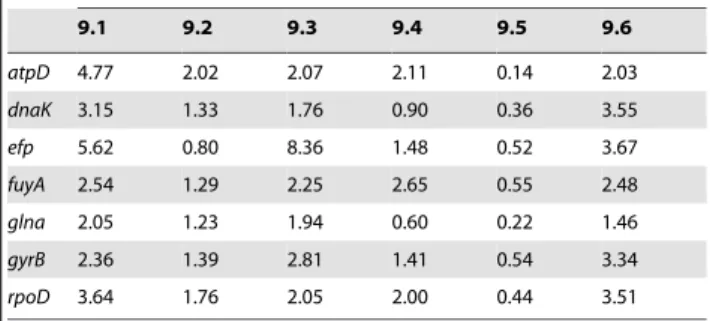
Bayesian inference of mutation rates using heterochronous sampling gave similar results for each gene in each of the six groups (Table 4). The estimated mutation rates per gene and per year were on average 2 6 1025. However, mutation rates in group 9.5 were an order of magnitude lower than in the other groups. Extended bayesian skyline plot (EBSP) analyses indicated strong changes in effective sizes for groups 9.2 to 9.6 (Figure S1). For groups 9.2 to 9.5, population bottlenecks may have occurred between ca. 1940s and 1960, and they may have occurred in the 2000s for group 9.6. However, the latter result for group 9.6 may be explained by a lack of statistical power, as most of the strains in this group were isolated around year 2000 (Table 1).
The evolutionary scenario derived from the genealogical analysis of our strains (Figure 1) was used in IMa2 for parameter estimation (Figure 2; Table S2). Using a generation time of 0.003 year and an average mutation rate per gene per year of 2.1025, divergence times ranged from 0.26 [Present –4.3] thousands of years (kyr) for groups 9.1 and 9.4 to 23.3 [14–39] kyr for the most ancestral population. Groups 9.5 and 9.6 diverged 7.9 [3.8–25.8] kyr ago, and group 9.3 diverged from A3 population (common ancestor of 9.5 and 9.6) 21 [9.4–31.5] kyr ago, while groups 9.2 diverged from A1 population (common ancestor of 9.1 and 9.4) 6.4 [2.8–12] kyr ago. Effective size ranged from 86103(group 9.1) to 3.76106(A2). Nine migration rates were significantly different from zero. Seven of them have occurred since 0.25 kyr (Figure 2) mainly between groups 9.3, 9.5, and 9.6, which belonged to the same super-clade. Within the other super-clade, no genetic exchanges occurred. Population 9.2 exchanged with populations 9.3 and 9.6.
Co-occurrence of Transfers of VA Genes and of Gene Flow Events in Housekeeping Genes
The recombination events detected in housekeeping genes show that genetic exchanges were possible between some strains belonging to the different groups. Thus we wanted to assess
whether other genetic exchanges may have occurred that involved VA genes. Repertoires of VA genes in ancestor strains were inferred by parsimony analysis at all nodes of the genealogy provided by ClonalFrame analysis. Based on these inferred repertoires of VA genes transfer events detected in our approach involved genes encoding T3Es, sensor proteins, MCPs and adhesins (Figure 3). Transfer of genes encoding T3Es occurred between ancestors of groups 9.5 and 9.6, 9.3 and 9.5, and 9.2 and 9.6. Also, transfer of the T3Es genes xopP and xopJ5 occurred between the ancestors of group 9.6 and of the Genetic Lineage 1 of pathovar phaseoli. Transfer events involving genes encoding components of sensory systems occurred between ancestors of groups 9.2 and 9.6, 9.3 and 9.5, and 9.5 and 9.6. Also, gene xac3050 encoding a sensor protein was transferred from the ancestor of group 9.6 to the ancestor of genetic lineage C of pathovar dieffenbachiae. Finally, genes fhaB1 and fhaB2 encoding non-fibrillar adhesins were transferred between ancestors of groups 9.2 and 9.6.
Discussion
Our analyses based on coalescence and Bayesian clustering approaches bring new insight into clusterings within X. axonopodis. The scenario suggested by our data involved a first step of Table 3. ClonalFrame parameters for the six groups (9.1 to 9.6) and the whole X. axonopodis dataset.
X. axonopodis group
Parameter 9.1 9.2 9.3 9.4 9.5 9.6 Whole set
n 5 33 6 16 33 38 131 h 0.009 13.13 0.21 0.24 0.368 7.21 14.10 [0.001–0.057] [4.52–25.79] [0.002–1.282] [0.006–0.903] [0.002–1.705] [1.33–19.98] [6.67–22.21] n 0.0111 0.021 0.009 0.02 0.005 0.003 0.01 [0.008–0.015] [0.015–0.028] [0.006–0.013] [0.018–0.036] [0.003–0.007] [0.001–0.004] [0.008–0.011] R 1.868 4.56 0.23 1.09 3.43 2.21 12.43 [0.009–7.225] [2.46–7.93] [0.002–1.743] [0.57–1.83] [1.614–6.01] [0.123–6.55] [9.12–15.59] TMRCA 1.053 1.98 2.296 5.72 1.74 0.97 1.67 [0.253–2.758] [0.82–4.19] [0.746–4.335] [2.83–10.58] [0.89–3.42] [0.52–1.8] [1.23–2.17] umber of strains (n); number of mutation events (h); rate of substitution via recombination (n); number of recombination events (R); estimate of time to the most recent common ancestor (TMRCA); [95% confidence interval].
doi:10.1371/journal.pone.0058474.t003
Table 4. Mutation rate per gene and per year inferred from EBSP analysis in BEAST for each of the six housekeeping genes in each of the six groups within X. axonopodis.
Mutation rate (6 1025
) per gene per year in each group
9.1 9.2 9.3 9.4 9.5 9.6 atpD 4.77 2.02 2.07 2.11 0.14 2.03 dnaK 3.15 1.33 1.76 0.90 0.36 3.55 efp 5.62 0.80 8.36 1.48 0.52 3.67 fuyA 2.54 1.29 2.25 2.65 0.55 2.48 glna 2.05 1.23 1.94 0.60 0.22 1.46 gyrB 2.36 1.39 2.81 1.41 0.54 3.34 rpoD 3.64 1.76 2.05 2.00 0.44 3.51 doi:10.1371/journal.pone.0058474.t004
diversification of generalist pathogenic bacteria followed by a second step of ecology-driven specialization, i.e. host-associated specialization. Secondary contacts between specialized strains probably occurred recently as a result of agricultural intensifica-tion and globalizaintensifica-tion. Subsequently, shuffling of VA genes by genetic exchanges may have favored emergence of novel pathotypes.
Our scenario involves the estimation of divergence times and demographic parameters. Such estimation is based on values of mutation rates that we inferred from our dataset [52]. These values are among the highest ones estimated so far for human bacterial pathogens, as reported by Nu¨bel and colleagues [62]. Calibrating the rate of sequence divergence based on arbitrary values for mutation rates [63] distorts the estimation of divergence times towards millions of years for Campylobacter coli [64]. Alternatively, a method based on intra-specific variation leads to estimates that better link genetic structure of populations to the history of ecological niches [23], [64], [65], [66]. Using Beast on our dataset enabled us to estimate ecologically meaningful divergence times between pathovars within X. axonopodis, thereby establishing a pioneer framework for scaling evolutionary history
of plant pathogenic bacteria, as was recently described for the other bacterial model in plant pathology: Pseudomonas syringae [67].
Episode 1: Diversification of Generalist Pathogenic Bacteria
Nucleotidic variation found in the seven housekeeping genes shows that X. axonopodis clustered into five main groups indepen-dently from their contemporary hosts and from geography. According to the Isolation-with-Migration model, the five groups coalesced over a period of 25,000 years (Figure 2). The divergence between 9.1 and 9.4, if it exists, can be considered as not fully achieved because the confidence interval of the time of their split contains the present time. The evolutionary parameter inference we provided here allows refining the status of the groups defined earlier on a phylogenetic basis [17], [21].
Geographical isolation does not appear to be the most obvious mechanism of divergence among these five groups. Indeed, no correlation was found between strain sampling localization and assignment to one of the groups. In most groups, strains were isolated in up to four continents. Also, the divergence of groups cannot be explained by the localization of the center of origin
Figure 2. Evolutionary history set in IMa2 of 131 strains ofX. axonopodisbelonging to 25 pathovars. Divergence time estimates are given in kyr at the left (in black). Plain gray double arrows indicate 95% Confidence Interval. Values in light gray r indicate lower and upper limits of 95% highest posterior density on divergence times. Directions of migration are represented by dotted grey arrows; numerical values represent the effective number of migrants. Only migrations significantly different from zero are represented (p,0.05). Populations 9.1 to 9.6 refer to genetic groups in X. axonopodis and A1 to A5 refer to ancestral populations.
and/or domestication of the contemporary hosts of the strains. As an illustration, group 9.6 harbors strains pathogenic on Citrus spp. and Phaseolus spp. that originate from southeastern Asia and Andean - Mesoamerican centers, respectively [68].
An evolutionary history that is apparently independent from pathological specificities would be a surprising result, as one usually expects evolution of pathogenic bacteria to be driven by host-specificity [69], [70], [71], [72]. Ecological divergence can be used to explain the early divergence of group 9.3; however, host-specificity cannot explain the pattern of divergence between the four other groups. In our collection, group 9.3 contains only strains that are pathogenic on monocots whereas all other groups harbor only strains that are pathogenic on dicots, the only exception being pathovar allii in group 9.2. Parkinson and colleagues [19] proposed that Xanthomonas genus first arose as a monocot pathogen. A similar proposal was made by Sarkar & Guttman [73] for another plant pathogen: Pseudomonas syringae. Group 9.3 seems to have rapidly evolved independently within X. axonopodis. For the four other groups in X. axonopodis, there is no clear relationship between ecological niches and genealogical clustering. On one hand, bacterial strains that are pathogenic on phylogenetically distant hosts cluster in the same group (Figure 1) [17]. On the other hand, strains that are pathogenic on the same plant species or family are scattered in very divergent groups. For example, pathogens of Citrus spp. are found in groups 9.5 and 9.6, which may have diverged around 8,000 yr ago, but also in group 9.2, which diverged from the ancestors of 9.5 and 9.6 around 25,000 yr ago. This is also the case for strains infecting legumes in groups 9.2 (on Medicago sativa), 9.4 (on Phaseolus vulgaris) and 9.6 (on P. vulgaris and Vigna unguiculata). In addition, strains that are pathogenic on common bean (P. vulgaris) cluster in four lineages [74]. Bean pathogenic strains belonged to groups 9.4 and 9.6, whichcoalesced at a time close to that of the TMRCA (ca. 25,000 yr) but that display pathological convergence today.
Episode 2: an Ecology-driven Specialization
Within each of the five groups, monophyletic clusters are formed by strains displaying different host specialization (Figure 1). Pathovars could then be considered as ecotypes where divergence is mainly driven by ecological isolation [9], which here means isolation by host. Given our data, the most parsimonious hypothesis would be that strains belonging to the various pathovars all derived from a common ancestor carrying a very broad host range. Specialization of strains into pathovars displaying distinct host ranges may have been driven by agricultural development, which arose only recently, beginning about 10 000 years ago, but which intensified recently [68]. Based on our data (Figures 1 and 2), X. axonopodis pathovar divergence occurred during the past two centuries. The genetic and environmental uniformity of monocultures coupled with the large size of intensified agro-ecosystems would have selected for highly specialized and aggressive pathogens. The massive increase of agricultural surfaces might have led to large demographic expansion of bacterial pathogens of cultivated plant. Such emergence of the ‘‘domesticated’’ strains through a single founder
event has already been reported in other environments [75] Significant increases of population size in the past fifty years have been observed in all X. axonopodis groups (Figure S1). No clear signal of such a demographic change has been detected, however, by neutrality tests such as Tajima’s D or Fu and Li’s D* and F* tests. The power of these tests is known to decrease with time after expansion [76]. Expansion of several centuries coupled with a short generation time, as expected in bacteria, would lead to a high number of generations until present and may prevent powerful detection by neutrality tests.
Based on strains collected from symptomatic crops, specializa-tion on host plants appears ecology-driven. However, xanthomo-nads strains may inhabit and infect wild species [77], [78], or may occur as commensals on plants or may be found in association with seeds [79]. Part of the diversity may therefore have been neglected in our study. However, among non-pathogenic or commensal strains isolated so far from seeds, none belonged to the species X. axonopodis (our unpublished data). No xanthomonads have so far been isolated from non-plant environments.
Episode 3: Secondary Contacts, Occurrence of Genetic Exchanges, and Emergence of Novel Pathotypes?
A surprising result is the occurrence of significant gene flow between some groups in the past three centuries (Figure 2). Agricultural development and globalization may account for secondary contacts allowing recent migration events. Plants traditionally cultivated in different geographical areas and hosting different specialized strains have recently been cultivated in the same areas. Intensive cultivation has probably led to increasing the local effective size of bacterial strains. Then, recombination events with strains from other groups could have been effective. The estimate of r/m shows that recombination impacted the diversity of our dataset three times more than mutation (Table 3). Our estimate of r/m = 3.18 for X. axonopodis is comparable to that of Campylobacter insulaenigrae (r/m = 3.2), which is ranked 17thhighest among 48 species of bacteria (min. 0.02, Leptospira interrogans; max. 63.6, Flavobacterium psychrophilum) [80]. This ratio is similar to the one found in a diverse collection of Xylella fastidiosa strains [81]. Recombination was found to contribute 5.8 times more than mutation to variation within closely related isolates of P. syringae pv. tomato [82], contrasting with the results obtained when distantly related isolates were analyzed within the complex P. syringae species [73]. In the latter case, mutation was dominant over recombina-tion in generating variarecombina-tion among individuals. Although the genetic distances between isolates in the P. syringae strain collection analyzed by Sarkar & Guttman [73] and ours are similar, the impact of recombination in genetic variation is opposite. It is tempting to hypothesize that this could be a consequence of different life history strategies. Indeed, unlike xanthomonads, pseudomonads are known to spend a significant fraction of their life history outside their plant host, i.e. in soil or in water [83], where opportunities to exchange genetic material could be low. For Pseudomonas, the frequency of genetic exchanges between strains was increased on plants, thereby enhancing the transfer of VA genes [84].
Figure 3. Inferences on transfer of VA genes possibly involved in host specificity. The repertoires of 107 genes encoding MCPs, sensors, adhesins, and T3Es were previously determined for each strain of the collection [27], [28]. Using a parsimony approach implemented in Mesquite 2.5 [61], repertoires of genes at nodes of the ClonalFrame genealogy were inferred. Comparison of repertoires at ancestral nodes provided hypotheses on horizontal transfers concomitant to migration events identified in Figure 2. Populations 9.1 to 9.6 refer to genetic groups in X. axonopodis and A1 to A5 refer to ancestral populations. Four of the migration events detected by IMa2 may be associated to transfers of genes encoding MCP (xac3768, xcv1954), adhesins (fhaB1, fhaB2), sensors (xac0852, xac2152, xac2155, xac3050, xac3498, xac4062), and T3Es (avrXccA2, xopC1, xopE1, xopF2, xopJ5, xopL, xopP, xopAJ, xopAF).
Sympatry resulting in migration events occurs non-randomly among groups. Gene exchanges that occurred in the past 250 years involved groups that contained strains colonizing the same families of host-plants. For example, both groups 9.5 and 9.6 contain strains able to share the same host plant from Rutaceae [22]. Gene exchanges also concern groups in which host range was shown to overlap. Gent et al. [85] reported epiphytic asymptom-atic survival of pv. allii (group 9.2) on legumes and of pv. phaseoli (essentially group 9.6) on onions. This niche overlapping potentially creates a secondary contact allowing genetic exchanges between pathologically specialized pathogens. This hypothesis is supported by migration events we observed between groups 9.5 and 9.6 and between 9.2 and 9.6.
Spatial vicinity of crops may constitute another type of secondary contact. Pathovars vesicatoria (group 9.2) and phaseoli (groups 9.4 and 9.6) colonize hosts (Lycopersicon esculentum and P. vulgaris, respectively) coming from the same domestication area in Central and South America. These two pathovars share mobile elements not present in other pathovars of the species. Indeed, a common IS element belonging to a family rarely found in Xanthomonadaceae was identified only in the four pathovars of X. axonopodis pv. phaseoli and in X. axonopodis pv. vesicatoria [86]. This could indicate that they somehow share ecological niches allowing horizontal gene transfer.
Lastly, our data suggest that VA genes involved in host specificity (MCPs, adhesins, sensors, and T3Es) were transferred between the X. axonopodis groups as niche transcending genes. This does not preclude acquisition of VA genes from more distantly related lineages although acquisition of genes in recent times probably occurred mainly among members of Xanthomonadales and not with other Proteobacteria [87]. Transfers of VA genes occurred between groups that were also affected by homologous recombination of housekeeping genes (Figure 3). Since a correlation between pathological specificity and repertoires of VA genes was demonstrated in X. axonopodis [27], [28], such transfers may have impacted the host range of strains and promoted the emergence of strains carrying new pathological specificities. On the basis of the analysis of housekeeping genes, we did not observe any genetic exchanges between strains of the three lineages of pathovar phaseoli belonging to group 9.6 and the genetic lineage (GL1) falling in group 9.4. However, earlier genetic exchanges between 9.6 and A1 (ancestor of 9.1 and 9.4) may account for the pathological convergence between strains of the different lineages of the pathovar phaseoli. Moreover, our approach detected the transfer of the T3E genes xopP and xopJ5 between the ancestor of strains belonging to group 9.6 and the ancestor of the GL1 of pathovar phaseoli. Our attempt to associate homologous recombination events with transfer of VA genes does not mean necessarily that these events were linked but that environmental conditions (niche sharing) were met to favor genetic exchanges. However, homologous recombination most probably is not the only exchange mechanism. Indeed, we identified transposases or remnants of insertion sequences in the vicinity of several newly acquired VA genes (data not shown).
In conclusion, while addressing the evolutionary history of X. axonopodis, we identified two main steps of diversification. The first one leads to a clustering of generalist pathogens. This clustering does not seem to be based on host specialization or geography. As our collection is composed of pathogenic strains isolated from symptomatic crops, we may have underestimated the overall diversity within X. axonopodis. Adding strains from other sources such as weeds and wild relatives in various environments may help improve our understanding of this clustering. The second evolutionary step leads to ecotypes that are specialized pathotypes grouped according to their host range and their symptomatology. These pathovars emerged recently (260 yr to present [4.3 kyr-present]) by specialization likely through agricultural intensifica-tion and expansion. Homologous recombinaintensifica-tions of housekeeping genes were identified in the recent history between most of the groups. Virulence associated genes have also been exchanged between different groups of strains in the recent past, maybe favoring the emergence of new specializations. The current context of agriculture globalization (cropping and trade) could lead to multiplying the possibilities of niche sharing among pathovars (sympatry of different pathovars) and in association with the recent occurrence of significant gene flow within X. axonopodis strains, could favor the emergence of new pathotypes by horizontal transfer of virulence-associated genes.
Supporting Information
Figure S1 Model of evolution of effective sizes for groups 9.1 to 9.6 within X. axonopodis by Extended Bayesian Skyline Plot analyses.
(TIF)
Table S1 Descriptive statistics for polymorphism in X. axonopodis inferred from the analysis of seven housekeeping genes from 131 strains estimated on overall data set (a), each of the 6 groups (b), and pathovars (c). Values for pathovars represented by more than one strain are indicated.
(DOC)
Table S2 IMa2 parameter estimates. (DOC)
Acknowledgments
We thank Perrine David for helpful discussion and critical reading of the manuscript. The authors thank CIRM-CFBP (INRA, France) for strain conservation and supply.
Author Contributions
Conceived and designed the experiments: NMH TB MAJ. Performed the experiments: NMH KD CB. Analyzed the data: NMH TB CL MAJ. Contributed reagents/materials/analysis tools: NMH AH TB AD KD CB MFLS CM SP OP CL MAJ. Wrote the paper: NMH TB CL MAJ.
References
1. Barrett R, Rogers SM, Schluter D (2008) Natural selection on a major armor gene in threespine stickleback. Science 322: 255–258.
2. Giraud T, Gladieux P, Gavrilets S (2010) Linking the emergence of fungal plant diseases with ecological speciation. Trends Ecol Evol 25: 387–395.
3. Coyne JA, Orr HA (2004) Speciation. Sinauer Associates, Sunderland, MA. 545 pp.
4. Pinho C., Hey J (2010) Divergence with Gene Flow: Models and Data. Ann Rev Ecol Evol Syst 41: 215–230.
5. Stukenbrock EH, McDonald BA (2008) The origins of plant pathogens in agro-ecosystems. Ann Rev Phytopathol 46: 75–100.
6. Anderson P, Cunningham A, Patel N, Morales F, Epstein P, et al. (2004) Emerging infectious diseases of plants: pathogen pollution, climate change and agrotechnology drivers. Trends Ecol Evol 19: 535–544.
7. Stukenbrock EH, Banke S, Javan-Nikkhah M, McDonald BA (2007) Origin and Domestication of the Fungal Wheat Pathogen Mycosphaerella graminicola via Sympatric Speciation. Mol Biol Evol 24: 398–411.
8. Gladieux P, Vercken E, Fontaine MC, Hood ME, Jonot O, et al. (2011) Maintenance of Fungal Pathogen Species That Are Specialized to Different Hosts: Allopatric Divergence and Introgression through Secondary Contact. Mol Biol Evol 28: 459–471.
9. Cohan FM (2002) Sexual isolation and speciation in bacteria. Genetica 116: 359– 370.
10. Dye DW, Bradbury JF, Goto M, Hayward AC, Lelliott RA, et al. (1980) International standards for naming pathovars of phytopathogenic bacteria and a list of pathovar names and pathotype strains. Rev Plant Pathol 59: 153–168. 11. Costechareyre D, Bertolla F, Nesme X (2009) Homologous recombination in
Agrobacterium: potential implications for the genomic species concept in bacteria. Mol Biol Evol 26: 167–176.
12. Cohan FM, Koeppel AF (2008) The origins of ecological diversity in prokaryotes. Curr Biol 18: R1024–R1034.
13. Hayward AC (1993) The hosts of Xanthomonas. In Swings JC, Civerolo EL, editors. Xanthomonas. Chapman and Hall: London. 1–119.
14. Vauterin L, Hoste B, Kersters K, Swings J (1995) Reclassification of Xanthomonas. Int J Syst Bacteriol 45: 472–489.
15. Vauterin L, Rademaker J, Swings J (2000) Synopsis on the taxonomy of the genus Xanthomonas. Phytopathology 90: 677–682.
16. Rademaker JLW, Hoste B, Louws FJ, Kersters K, Swings J, et al. (2000) Comparison of AFLP and rep-PCR genomic fingerprinting with DNA-DNA homology studies: Xanthomonas as a model system. Int J Syst Evol Microbiol 50: 665–677.
17. Rademaker JLW, Louws FJ, Schultz MH, Rossbach U, Vauterin L, et al. (2005) A comprehensive species to strain taxonomic framework for Xanthomonas. Phytopathology 95: 1098–1111.
18. Ah-You N, Gagnevin L, Grimont PAD, Brisse S, Nesme X et al. (2009) Polyphasic characterization of xanthomonads pathogenic to members of the Anacardiaceae and their relatedness to species of Xanthomonas. Int J Syst Evol Microbiol 59: 306–318.
19. Parkinson N, Aritua V, Heeney J, Cowie C, Bew J, et al. (2007) Phylogenetic analysis of Xanthomonas species by comparison of partial gyrase B gene sequences. Int J Syst Evol Microbiol 57: 2881–2887.
20. Parkinson N, Cowie C, Heeney J, Stead D (2009) Phylogenetic structure of Xanthomonas determined by comparison of gyrB sequences. Int J Syst Evol Microbiol 59: 264–274.
21. Young JM, Park DC, Shearman H, Fargier E (2008) A multilocus sequence analysis of the genus Xanthomonas. Syst Appl Microbiol 31: 366–377. 22. Bui Thi Ngoc L, Vernie`re C, Jouen E, Ah-You N, Lefeuvre P, et al. (2010)
Amplified fragment length polymorphism and multilocus sequence analysis-based genotypic relatedness among pathogenic variants of Xanthomonas citri pv. citri and Xanthomonas campestris pv. bilvae. Int J Syst Evol Microbiol 60: 515–525. 23. Gru¨nwald NJ, Goss EM (2011) Evolution and population genetics of exotic and re-emerging pathogens: novel tools and approaches. Annu Rev Phytopathol 49: 249–267.
24. Didelot X, Falush D (2007) Inference of bacterial microevolution using multilocus sequence data. Genetics 175: 1251–1266.
25. Didelot X (2010) Sequence-based analysis of bacterial population structures. In: Robinson DA, Falush D, Feil E (eds) Bacterial population genetics in infectious disease. John Wiley and Sons Inc: New Jersey. 103–120.
26. Hey J (2010) Isolation with migration models for more than two populations. Mol Biol Evol 27: 905–920.
27. Hajri A, Brin C, Hunault G, Lardeux F, Lemaire C, et al. (2009) A «Repertoire for Repertoire» Hypothesis: Repertoires of type three effectors are candidate determinants of host specificity in Xanthomonas. PLoS ONE 4: e6632. 28. Mhedbi-Hajri N, Darrasse A, Pigne´ S, Durand K, Fouteau S, et al. (2011)
Sensing and adhesion are adaptive functions in the plant pathogenic xanthomonads. BMC Evol Biol 11: 67.
29. Ausubel FM, Brent R, KingstonRE, Moore DD, Seidman JG, et al. (1992) Current protocols in molecular biology. Greene Publishing associates and Wiley Interscience: New York.
30. Staden R (1996) The Staden sequence analysis package. Mol Biotech 5: 233– 241.
31. Thompson JD, Gibson TJ, Plewniak F, Jeanmougin F, Higgins DG (1997) The CLUSTAL_X windows interface: flexible strategies for multiple sequence alignment aided by quality analysis tools. Nucleic Acids Res 25: 4876–4882. 32. Tamura K, Dudley J, Nei M, Kumar S (2007) MEGA4: Molecular Evolutionary
Genetics Analysis (MEGA) software version 4.0. Mol Biol Evol 24: 1596–1599. 33. Hall TA (1999) BioEdit: a user-friendly biological sequence alignment editor and analysis program for Windows 95/98/NT. Nucleic Acids Symp Ser 41: 95–98. 34. Hudson RR, Kaplan NL (1985) Statistical properties of the number of recombination events in the history of a sample of DNA sequences. Genetics 111: 147–164.
35. Librado P, Rozas J (2009) DnaSP v5: a software for comprehensive analysis of DNA polymorphism data. Bioinformatics 25: 1451–1452.
36. Martin DP, Williamson C, Posada D (2005a) RDP2: recombination detection and analysis from sequence alignments. Bioinformatics 21: 260–262. 37. Martin D, Rybicki E (2000) RDP: detection of recombination amongst aligned
sequences. Bioinformatics 16: 562–563.
38. Padidam M, Sawyer S, Fauquet CM (1999) Possible emergence of new geminiviruses by frequent recombination. Virology 265: 218–225.
39. Maynard Smith J (1992) Analysing the mosaic structure of genes. J Mol Evol 34: 126–129.
40. Posada D, Crandall K (2001) Evaluation of methods for detecting recombination from DNA sequences: Computer simulations. Proc Nat Acad Sci USA 24: 13757–13762.
41. Martin DP, Posada D, Crandall KA, Williamson C. (2005b). A modified bootscan algorithm for automated identification of recombinant sequences and recombination breakpoints. AIDS Res Hum Retroviruses 21: 98–102.
42. Gibbs MJ, Armstrong JS, Gibbs AJ (2000) Sister-Scanning: a Monte Carlo procedure for assessing signals in recombinant sequences. Bioinformatics 16: 573–582.
43. Boni MF, Posada D, Feldman MW (2007) An exact nonparametric method for inferring mosaic structure in sequence triplets. Genetics 176: 1035–1047. 44. Kosakovsky Pond SL, Posada D, Gravenor MB, Woelk CH, et al. (2006)
GARD: a genetic algorithm for recombination detection. Bioinformatics 22: 3096–3098.
45. Kuhner MK (2008) Coalescent genealogy samplers: windows into population history. Trends Ecol Evol 24: 86–93.
46. Nei M (1987) Molecular Evolutionary Genetics. Columbia Univ. Press, New York.
47. Watterson GA (1975) On the number of segregating sites in genetical models without recombination. Theoret Pop Biol 7: 256–276.
48. Tajima F (1989) Statistical method for testing the neutral mutation hypothesis by DNA polymorphism. Genetics 123: 585–595.
49. Fu YX, Li WH (1993) Statistical tests of neutrality of mutations. Genetics 133: 693–709.
50. Rice W (1989) Analysis tables of statistical tests. Evolution 43: 223–225. 51. Hey J, Nielsen R (2004) Multilocus methods for estimating population sizes,
migration rates and divergence time, with applications to the divergence of Drosophila pseudoobscura and D. persimilis. Genetics 167: 747–760.
52. Drummond A, Rambaut A (2007) BEAST: Bayesian evolutionary analysis by sampling trees. BMC Evol Biol 7: 214.
53. Heled J, Drummond A (2008) Bayesian inference of population size history from multiple loci. BMC Evol Biol 8: 289 doi:10.1186/1471-2148-8-289. 54. Burdon JJ, Jarosz AM, Kirby GC (1989) Pattern and Patchiness in
Plant-Pathogen Interactions–Causes and Consequences. Ann Rev Ecol Syst 20: 119– 136.
55. Zeller KA, Bowden RL, Leslie JF (2004) Population differentiation and recombination in wheat scab populations of Gibberella zeae from the United States. Mol Ecol 13: 563–571.
56. Bucheli E, Gautschi B, Shykoff JA (2001) Differences in population structure of the anther smut fungus Microbotryum violaceum on two closely related host species, Silene latifolia and S. dioica. Mol Ecol 10: 285–294.
57. Pritchard J, Stephens M, Donnelly PJ (2000) Inference of population structure using multilocus genotype data. Genetics 155: 945–959.
58. Falush D, Stephens M, Pritchard J (2003) Inference of population structure using multilocus genotype data linked loci and correlated allele frequencies. Genetics 164: 1567–1587.
59. Evanno G, Regnaut S, Goudet J (2005) Detecting the number of clusters of individuals using the software structure: a simulation study. Mol Ecol 14: 2611– 2620.
60. Jakobsson M, Rosenberg NA (2007) CLUMPP: a cluster matching and permutation program for dealing with label switching and multimodality in analysis of population structure. Bioinformatics 23: 1801–1806.
61. Maddison WP, Maddison DR (2009) Mesquite: a modular system for evolutionary analysis. Version 2.6 http://mesquiteproject.org.
62. Nu¨bel U, Dordel J, Kurt K, Strommenger B, Westh H, et al. (2010) A timescale for evolution, population expansion, and spatial spread of an emerging clone of methicillin-resistant Staphylococcus aureus. PLoS Pathogens 6: e1000855. 63. Ochman H, Wilson AC (1987) Evolution in bacteria: evidence for a universal
substitution rate in cellular genomes. J Mol Evol 26: 74–86.
64. Sheppard SK, Dallas JF, Wilson DJ, Stachan NJC, McCarty ND, et al. (2010) Evolution of an agriculture-associated disease causing Campylobacter coli clade: evidence from national surveillance data in Scotland. PLoS ONE 5: e15708. 65. Morelli G, Didelot X, Kusecek B, Schwarz S, Falush D, et al. (2010)
Microevolution of Helicobacter pylori during prolonged infection of single hosts and within families. PLoS Genet 6: e1001036.
66. Achtman M (2012) Insights from genomic comparisons of genetically monomorphic bacterial pathogens. Phil Trans R Soc B 367: 860–867. 67. Cai R, Lewis J, Yan S, Liu h, Clarke CR, et al. (2011) The plant pathogen
Pseudomonas syringae pv. tomato is genetically monomorphic and under strong selection to evade tomato immunity. PLoS Pathogens 7: e1002130. 68. Hancock JF (2006) Plant Evolution, 2nd
edn. CABI : Cambridge, USA. 69. Deitsch KW, Lukehart SA, Stringer JR (2009) Common strategies for antigenic
variation by bacterial, fungal and protozoan pathogens. Nat Rev Microbiol 7: 493–503.
70. Ding F, Tang P, Hsu M-H, Cui P, Hu S, et al. (2009) Genome evolution driven by host adaptations results in a more virulent and antimicrobial-resistant Streptococcus pneumoniae serotype 14. BMC Genomics 10: 158 doi:10.1186/1471-2164-10-158.
71. Oh PL, Benson AK, Peterson DA, Patil PB, Moriyama EN, et al. (2011) Diversification of the gut symbiont Lactobacillus reuteri as a result of host-driven evolution. ISME J 4: 377–387.
72. Zdziarski J, Brzuszkiewicz E, Wullt B, Liesegang H, Biran D, et al. (2010) Host imprints on bacterial genomes–rapid, divergent evolution in individual patients. PLoS Pathogens 6: e1001078.
73. Sarkar SF, Guttman DS (2004) Evolution of the core genome of Pseudomonas syringae, a highly clonal, endemic plant pathogen. Appl Environ Microbiol 70: 1999–2012.
74. Alavi SM, Sanjari S, Durand F, Brin C, Manceau C, et al. (2008) Assessment of the genetic diversity of Xanthomonas axonopodis pv. phaseoli and Xanthomonas fuscans subsp. fuscans as a basis to identify putative pathogenicity genes and a type III secretion system of the SPI-1 family by multiple suppression subtractive hybridizations. Appl Environ Microbiol 74: 3295–3301.
75. Passerini D, Beltramo C, Coddeville M, Quentin Y, Ritzenthaler P, et al. (2010) Genes but not genomes reveal bacterial domestication of Lactococcus lactis. PLoS ONE 5: e15306.
76. Achaz G (2009) Frequency spectrum neutrality tests: one for all and all for one. Genetics 183: 249–258.
77. Sikirou R, Wydra K (2004) Persistence of Xanthomonas axonopodis pv. vignicola in weeds and crop debris and identification of Sphenostylis stenocarpa as a potential new host. Europ J Plant Pathol 110: b939–947.
78. Barak JD, Koike ST, Gilbertson RL (2001) The role of crop debris and weeds in the epidemiology of bacterial leaf spot of lettuce in California. Plant Dis 85: 169– 178.
79. Darrasse A, Darsonval A, Boureau T, Brisset MN, Durand K, et al. (2010) Transmission of plant-pathogenic bacteria by nonhost seeds without induction of an associated defense reaction at emergence. Appl Environ Microbiol 76: 6787– 6796.
80. Vos M, Didelot X (2009) A comparison of homologous recombination rates in bacteria and archaea. ISME J 3: 199–208.
81. Scally M, Schuenzel EL, Stouhamer R, Nunney L (2005) Multilocus sequence type system for the plant pathogen Xylella fastidiosa and relative contributions of
recombination and point mutation to clonal diversity. Appl Environ Microbiol 71: 8491–8499.
82. Yan S, Liu H, Mohr TJ, Jenrette J, Chiodini R, et al. (2008) Role of recombination in the evolution of the model plant pathogen Pseudomonas syringae pv. tomato DC3000, a very atypical tomato strain. Appl Environ Microbiol 74: 3171–3181.
83. Morris CE, Sands DC, Vinatzer BA, Glaux C, Guilbaud C, et al. (2008) The life history of the plant pathogen Pseudomonas syringae is linked to the water cycle. ISME J 2: 321–334.
84. Lovell HC, Jackson RW, Mansfield JW, Godfrey SAC, Hancock JT, et al. (2011) In planta conditions induce genomic changes in Pseudomonas syringae pv. phaseolicola. Mol Plant Pathol 12: 167–176.
85. Gent DH, Al-Saadi A, Gabriel DW, Louws F, Ishimaru C, et al. (2005) Pathogenic and genetic relatedness among Xanthomonas axonopodis pv. allii and other pathovars of X. axonopodis. Phytopathology 95: 918–925.
86. Alavi MS, Poussier S, Manceau C (2007) Characterization of ISXax1, a novel insertion sequence restricted to Xanthomonas axonopodis pv. phaseoli (variants fuscans and non-fuscans) and Xanthomonas axonopodis pv. vesicatoria. Appl Environ Microbiol 73: 1678–1682.
87. Comas I, Moya A, Azad RK, Lawrence JG, Gonzalez-Candelas F (2006) The evolutionary origin of Xanthomonadales genomes and the nature of the horizontal gene transfer process. Mol Biol Evol 23: 2049–2057.