The California Energy Crisis and
Cogeneration Investment Opportunities for Office Landlords
ByGregory L. Hammond
B.A. Organizational Behavior
Brown University, 1980
Submitted to the Department of Architecture
In Partial Fulfillment of the Requirements for the Degree of
Master of Science in Real Estate Development
at the
Massachusetts Institute of Technology
September, 2001
@ 2001 Gregory L. Hammond
All rights reserved.
The author hereby grants to MIT permission to reproduce and to distribute publicly paper and electronic copies of this thesis document in whole or in part.
A
Signature of Author:
-
I
Gregory L. HammondAugust 3, 2001 Certified by:
Sandra Lambert Lecturer, Department of Urban Studies and Planning
Thesis Supervisor Accepted by: MASSACHUSETTS INSTITUTE OF TECHNOLOGY
SEP 2 7 2001
LIBRARIES
William C. Wheaton Chairman, Interdepartmental Degree Program in Real Estate DevelopmentThe California Energy Crisis and
Cogeneration Investment Opportunities for Office Landlords
By
Gregory L. Hammond
Submitted to the Department of Architecture on August 3, 2001 In Partial Fulfillment of the Requirements for the
Degree of Master of Science in Real Estate Development
ABSTRACT
For the past eight months, California has been beset by an energy crisis. An inadequate supply of electricity has not been able to keep up with the growing demand. Vital transmission lines are operating at or near capacity. The installation of cogeneration systems into office buildings can play an important role in the overall solution. Cogeneration is a form of on-site generation that can provide electricity to office landlords and tenants that is less costly and more reliable than that provided by the utilities. There are several ways that office cogeneration systems can ease the pressure on California's electric generation and transmission infrastructure.
First, office buildings consume 26% of all electricity nationwide. They place an equally great demand on California's generating capacity. With widespread application, the siting of cogeneration systems in office buildings can reduce the demand placed on California's centralized power plants (CPPs). Reducing the demand for electricity that is centrally generated and delivered via transmission lines reduces the risk of blackouts and the cost of wholesale and retail electricity.
Second, because transmission lines are already operating at or near their capacity, it will be problematic to deliver the new centralized generation capacity that is coming on-line. It will be many years and billions of dollars before the transmission lines are fully upgraded. On-site cogeneration reduces the electrical congestion on these power lines, enabling more of the new centralized generation to get delivered.
Third, office cogeneration systems can be deployed in one-fifth of the time it takes to place a large CPP into operation. The quicker more generation can be added, the sooner a healthy supply/demand balance can be struck. Because of their small-scale and relatively simple component parts, office cogeneration systems can be completely permitted, installed and in-operation within 90 to 180 days. By contrast, it takes up to two and one-half years to permit, construct and place a large CPP into operation.
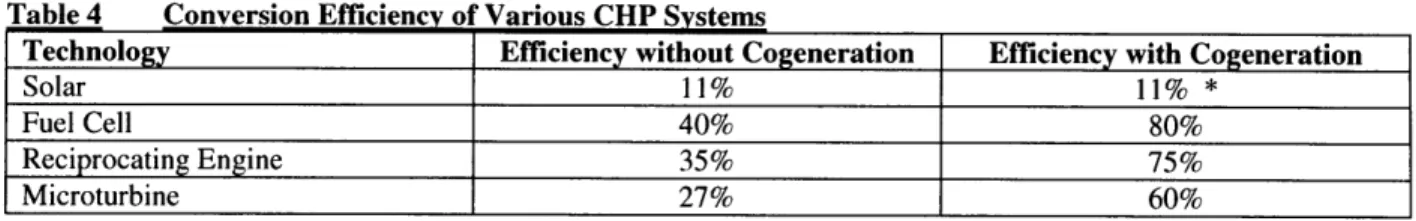
When fuel such as natural gas is combusted at a CPP, only 33% of the energy that is released via the combustion process actually reaches the remotely located end-users (e.g., homes and businesses) in the form of electricity. The conversion efficiency of an office cogeneration system is 75%, twice that of the CPP. Consequently, a cogeneration system can produce the electricity needed by a given office building while using only half the amount of fuel that a CPP would require. As these office cogeneration systems are located on-site, not only is the cost of transmitting electricity over long distances eliminated, so are the expenses associated with the maintenance and repair of the power grid. The fuel and transmission cost savings are what primarily enable office cogeneration systems to deliver electricity to office landlords and tenants at a fraction of the cost of power provided by the CPPs. The resultant price differential is what creates the investment opportunity for office landlords.
Thesis Supervisor: Sandra Lambert
TABLE OF CONTENTS
A B S T R A C T ... 3
CHAPTER 1 - INTRODUCTION O verview ... . 9
History of the Electricity Generation and Transmission Industry...10
Current Profile of California's Electricity Generation Industry... 12
California Deregulation and Electricity Generation... 13
D eregulation ... 13
G eneration ... 15
T ran sm ission ... 15
D istribution ... . . 16
Competition Transition Charge, Stranded Investments and Retail Rate Freezes... 16
CHAPTER 2 - THE CALIFORNIA ENERGY CRISIS The Initial Stages and Subsequent Economic Fallout... 18
Investor-Owned Utilities and the State of California... 19
Pacific Gas & Electric... 19
Southern California Edison... 19
San Diego Gas & Electric... 19
State of C alifornia... 19
C ost to B usinesses... 20
Retail Electricity Costs... 20
R olling B lackouts... 20
Causes of the California Energy Crisis... 21
Deregulation as a Construct... 21
M arket Pow er... 22
Acute Supply / Demand Imbalance... 22
D em and ... 24
Population G row th... 24
Higher Temperatures... 24
Retail Electric Rate Freeze... 24
Supply ... . .. 24
In-State Generating Capacity... 24
Perm it Process... 24
Reduced Hydroelectric Generation... 25
R educed Im ports... 25
Pow er Plant O utages... 26
Electric Transmission Congestion... 27
Natural Gas Transmission Congestion... 27
Long Term Contracts and Forward Markets... 27
Wholesale Price Caps... 27
Credit Issues for the Investor-Owned Utilities...27
B lackouts... . 28
How Blackouts Are Orchestrated... 28
Stage I E m ergency... 28
Stage 2 E m ergency... 28
Stage 3 E m ergency... 28
How Many Years Will Blackouts Persist... 30
R etail Electricity Prices... 32
Cost to Businesses in the Aggregate... 33
Cost to Individual Office Tenants... 33
Loss-R elated Surcharges... 34
How Many Years Will Retail Rates Remain Elevated and Surcharges be Applied... 35
Sum m ary ... . 35
CHAPTER 3 - COGENERATION INVESTMENT OPPORTUNITIES FOR OFFICE LANDLORDS Introduction ... 37
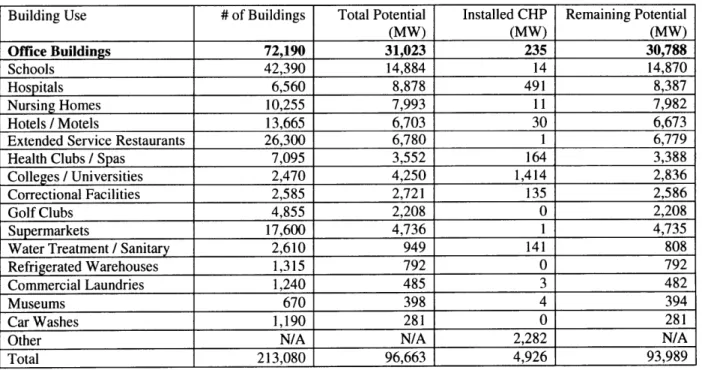
Technical Potential for CHP Applications in the Office Sector... 39
Fledgling Industry... 40
CHPs Role is Solving the California Energy Crisis... 40
Investm ent O pportunity... 41
Fuel and Transmission Savings... 41
Loss-R elated Surcharges...42
Early Industry Participants... 42
L andlords ... . .. 43
A rden R ealty... 43
Equity Office Properties...43
H ines... . 4 3 C aIPE R S ... 43 3rd-Party CHP Developers... 43 R ealE nergy ... 44 T exas U tilities... 44 E n ron ... 4 4 Interviews with Office Landlords and 3rd Party CHP Developers... 44
Basic CHP Functions... 45
H ours of O peration... 45
G eneration C apacity... 45
System of C hoice... 45
Owning & Operating vs. Outsourcing the CHP Functions... 47
3rd-Party CHP Developer... 47
Landlord Owns and Operates CHP... 48
G ross L ease... 48
T riple-N et Lease... 48
Fully Serviced Lease... 48
Benefits to Office Tenants... 49
Lower Electricity Costs... 49
Improved Power Reliability ... 50
Circumvention of Loss-Related Surcharges... 50
B enefits to Landlord... 50
Capturing the Price Differential between CHP- and IOU-Provided Electricity...50
Reliable Power Rent Premium...51
Tenant Retention and Attraction...51
Selling Excess Power Back to the Grid... 51
Lower Greenhouse Gas Emissions... 51
Business Risks and Mitigation Strategies... 51
Natural Gas Price Volatility ... 52
R e-R egulation... 52
Decline of Retail Electricity Prices... 52
Financing C osts... 53
Technological Obsolescence... 53
Local E m issions... 53
System R eliability... 53
Financial Strength of 3rd-Party Developer... 53
Targeting Markets for CHP Applications... 54
L andlord ... 54
3rd-Party CHP Developer... 54
Stand-By Fees and Back-Up Power... 54
E xit F ees... 55
Interconnections... 56
Landlords and Older Buildings... 57
CHP Markets in the Short- and Mid-Term... 57
D eregulation ... 58
High Retail Electricity Prices... 59
Constrained Supply Relative to Demand...60
Technical Potential for Office CHPs... 61
Sum m ary... 62
CHP Markets in the Long-Term... 62
D eregulation ... 63
National Energy Policy... 66
K yoto P rotocol... 66
W hat's O ld Is N ew ... 68
C onclu sion ... 6 8 APPENDICES A ppendix 1 G lossary... 69
Appendix 2 Chronology of California Energy Crisis... 74
Appendix 3 Assumptions for Summer Reserve Margin (2000-4) Calculations... 77
BIBLIOGRAPHY ... 79
FO O T N O T E S ... 90
LIST OF EXHIBITS Exhibit 1 Current Profile of California's Electricity Generation Industry... 13
Exhibit 2 Service Territories of California's Largest IOUs... 14
Exhibit 3 Bundled Services Provided by IOUs... 15
Exhibit 4 Flow of Electricity and Attendant Buy / Sell Transactions... 16
Exhibit 5 Wholesale Electricity and Natural Gas Prices During First Years of Deregulation... 18
Exhibit 6 Total Losses Incurred by the IOUs and the State of California as of July-01... 19
Exhibit 7 Frequency of Stage 1, 2 and 3 Emergencies... 20
Exhibit 8 Reserve Margin in 1994... 23
Exhibit 9 Reserve Margin in Aug 2000... 23
Exhibit 10 States in which Hydroelectric Comprises 30% or More of State's Total Generation... 25
Exhibit 11
Fastest Growing State Populations
(%)...
26
Exhibit 12 Regression Analysis Correlating Calif. Gross Output with Electricity Consumption.. 29
Exhibit 13 Summer Reserve Margin (2001 - 2004)... 31
Exhibit 15 SCE's Current and New Rates... 33
Exhibit 16 Diagram of Combined Heat and Power (CHP) System... 37
Exhibit 17 Permit and Construction Time for CHP Systems vs. Large, Centralized Power Plant.. 41
Exhibit 18 Price Differential Creates Investment Opportunity...42
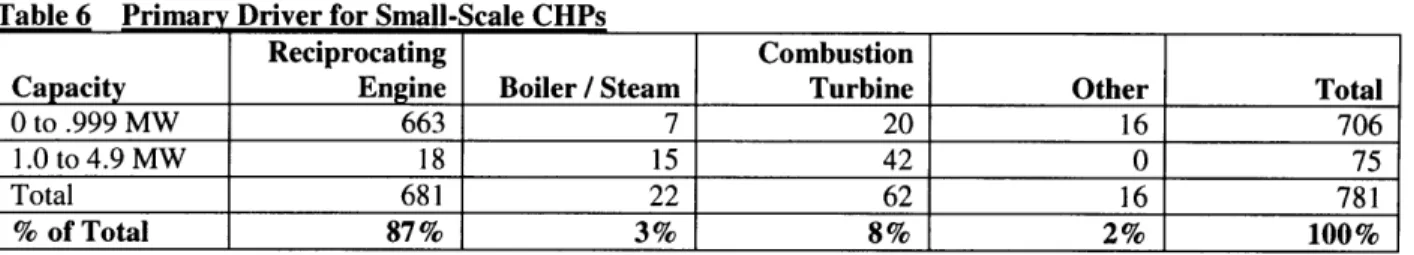
Exhibit 19 Primary Fuel Sources for CHPs... 46
Exhibit 20 Deregulated States... 58
Exhibit 21 States with the Ten Highest Retail Electricity Rates... 59
Exhibit 22 States with Ten Lowest per Capita Generating Capacities... 60
Exhibit 23 States with Highest Technical Potential for Office CHPs... 61
Exhibit 24 Inefficiency of Investor Owned Utility Power Plants... 64
Exhibit 25 Energy Intensity: Primary Energy Consumption (BTUs) per $1 of GDP... 65
LIST OF TABLES Table I Blackout Dates, Duration and Total Power Loss... 29
Table 2 Total GSP Loss Expected from Prospective Summer-01 Blackouts... 30
Table 3 Experts in Regulatory and Energy Economics... 32
Table 4 Conversion Efficiency of Various CHP Systems... 37
Table 5 Technical CHP Potential for Various Commercial and Institutional Building Uses.... 39
Table 6 Primary Driver for Small-Scale CHPs... 46
Table 7 Allocation of Electricity Cost Savings Under a Fully Serviced Office Lease... 49
The California Energy Crisis and
Cogeneration Investment Opportunities for Office Landlords
CHAPTER 1 - INTRODUCTION
OVERVIEW
In mid-1998, California became the first state in the U.S. to deregulate its electric markets. Two and one-half years later (Jan-01), California became embroiled by an energy crisis that continues to this day. Rolling blackouts have interrupted the daily operations of businesses, causing millions (and possibly billions) of dollars in reduced output. Recent rate increases could result in output declining by an additional $530 million per year in the Bay Area alone. Two of the state's three largest utilities are in precarious financial condition, incurring $9.5 billion in losses. One of them, Pacific Gas & Electric, has already filed for bankruptcy. The state has also incurred $7.5 billion in losses from stepping into the beleaguered utilities' shoes to buy electricity from power generators and wholesalers that were no longer willing to sell electricity to them.
The purpose of this thesis is to determine if California's energy crisis has created economic conditions and incentives for office landlords to invest in on-site generations systems to protect their tenants against blackouts and to provide them with less costly electricity. The focus will be on cogeneration, a type of on-site generation in which two forms of usable energy (heat and electricity) are produced from one fuel source. Because heat and power are produced, cogeneration systems are commonly referred to as combined heat and power systems (CHPs). CHPs exhibit great promise given their tremendous operating efficiencies, small-scale, short permitting and installation periods, substantial track record, reliability, and the presence of 3rd-parties poised to develop CHPs in office buildings.
To make these assessments, this thesis has been structured to examine the following critical questions:
- What are the root causes of the energy crisis? Was it just deregulation or did other factors contribute
more to the crisis?
- What has been the economic fall-out? Do these economic consequences create market opportunities
for CHPs?
- Will the root causes and economic consequences persist long enough so that investments in CHPs
will result in an attractive return on investment?
- If market opportunities for CHPs have been created in California, do they exist in other states?
- What are the long-term prospects for CHPs? Are there any macro-forces at play that may create a
national market for CHPs over the long-term?
The discovery process associated with examining these questions is filled with technical terms, acronyms and references to electricity industry players. To help keep track of all of them, a glossary is attached in Appendix 1. To put deregulation and its participants into context, a brief history of the electricity generation and transmission industry follows. It includes a snapshot of what the California electricity industry looks like today.
HISTORY OF THE ELECTRICAL GENERATION AND TRANSMISSION INDUSTRY
In 1879, Thomas Edison invented the incandescent light bulb. In 1881, he opened the world's first central electric power plant, located in New York City. Many civic leaders saw that electricity could greatly improve the quality of life for Americans'. The quicker it could be disseminated amongst the masses the better. However, large-scale deployment was no simple task for power entrepreneurs. Convincing residents and businesses of the value of having electricity was a tall order. Televisions, computers and electrical kitchen appliances had yet to be invented, so there wasn't a clear connection that could be made in the minds of these end-users.
From the beginning, the electricity business has been a capital intensive one. A great deal of money had to be invested in generating-equipment and electrical lines for distributing the power. A large amount of this money would have to come from lenders and investors. Given the uncertainty related to when and how many end-users would sign-up for electricity, revenues from generation and distribution could be sporadic, increasing the risk that the power entrepreneur would not be able to make its debt and equity payments. The greater the perceived risk of non-payment, the higher the interest rate and return-on-investment that lenders and investors would respectively demand. The higher these rates were, the greater the cost of electricity would be for end-users, and the slower the pace of mass deployment. This was contrary to the desires of civic leaders.
Many cities decided to deal with this impasse by establishing their own municipal power departments. City funds would be used to develop and promote the power infrastructure. The Los Angeles Department of Water and Power is a good example of a municipal utility. Other cities wanted the development of electric generation and distribution to be accomplished with private money. Their solution was to provide power entrepreneurs with an exclusive service territory in which no other power provider would be allowed to compete. With this exclusive right, power entrepreneurs had a more convincing story to tell investors and lenders. While it would still take a while for households and businesses to embrace electricity, when they did there would be only one supplier that they could buy from. For lenders and investors who saw the potential in electricity, this monopoly arrangement was sufficient to reduce their concerns over non-payment. This was the genesis of investor-owned utilities (IOUs). Debt and equity money started to flow, and so did electricity. With success and profits, power entrepreneurs secured more and more exclusive service territories. In some cases, their domain covered a large part of entire states. Good examples include ConEdison in New York and Pacific Gas & Electric in California.
The potential for IOUs to overcharge their customers given their monopoly power was not lost on civic leaders. The mechanism that ultimately emerged and was implemented by virtually all of the states between 1907 and 1922 was a public service commission that regulated each IOU2. These commissions
had to approve the retail electric rates that each IOU charged its end-users, and any plan of action that each IOU wanted to implement in order to add generation capacity or major debt. The retail rates allowed by the commission could only be high enough to cover all of the IOU's costs and provide a fair rate of return on its invested capital. Commissioners were often appointed by the governor and in some states they were elected. The public service commission formed in California is called the California Public Utilities Commission (CPUC).
Though the goal of distributing electricity throughout America has long since been met, the regulated monopoly model has largely remained in-place and unchallenged for the past seventy-five years. The first glimmer of change came in 1978 with the passing of the Public Utility Regulatory Policies Act (PURPA) by federal legislators. While this Act did not threaten the monopoly status of the IOUs, it did allow private non-IOU generators to build cogeneration plants and not be entirely subject to the rate-of-return regulations imposed by the public service commissions. These cogenerators were called "qualified facilities" (QFs). To qualify for the regulatory exemptions, they had to achieve generation efficiencies that were at least 50% greater than the average IOU power plant. When the QFs sold their power to the IOUs, the rates they could charge were subject to regulation. QFs could also sell their power to non-IOU entities and were able to charge these customers whatever rate the market would bear. PURPA was the first step towards being able to sell all generated electricity based on its market value.
In 1992, the federal Energy Policy Act created a new category of electric generators, "Exempt Wholesale Generators" (EWGs). As the name implies, these power providers are free to generate and sell electricity at its wholesale market price. Six years after the Energy Policy Act was enacted, California became the first state in the nation to completely deregulate its electric market, initiating the process that would create competition amongst electricity wholesalers and retailers.
CURRENT PROFILE OF CALIFORNIA'S ELECTRICITY GENERATION INDUSTRY
Exhibit I depicts the current profile of California's power generating industry. Each of the generator-types described above are included. Municipal utilities are among those entities identified as public agencies. They account for 23% of California's in-state generating capacity. IOUs are identified as utilities. They currently provide 15% of California's in-state generation capacity. Prior to deregulation IOUs accounted for 55%. Companies such as Calpine and Reliant purchased the power plants that the
IOUs sold due to deregulation. These companies are identified as Non-utility owners, producing 40% of California's in-state electricity generation. QFs, EWGs and other generators are combined and identified in Exhibit 1 as QFs and others. Together they account for 22% of California's in-state generating capacity.
Current Profile of California's Electricity Generation Industry
TOta generdon ownerhp Percent 100% = 52 GW uuttes OFS and othlers Non-umttty owners (97) Pubic agencies Non-utfIty-owed gerabo Percent 100% 21 GW (o4Ite Calpne Destec DynegyfNRG/Deeisc Southern Duke Rean AES -00W n*ue W WomeeS
Souo CEC Augus 2000 Rpor *o 0h Govemor Rt date; projct team OnuWeus
Source: "The Bay Area -A Knowledge Economy Needs Power". McKinsey & Company Report. April 2001.
CALIFORNIA DEREGULATION AND ELECTRICITY GENERATION
DEREGULATION
The rationale for California deregulating its electric market was quite simple. Though California's residents consumed about 35% less electricity on a per capita basis than the U.S. average (in part due to the state's moderate weather), California's average electric rate was the 10* highest in the country. As California's electricity market had largely been operated by IOUs as regulated monopolies, the logical strategy for reducing electric rates was to introduce competition into both the wholesale and retail power markets.
The first step taken was to open-up the wholesale electric markets. This process was actually initiated by the Federal Energy Regulatory Commission (FERC) which passed two regulations in 1996 that allowed for wholesale trading of electricity between the electricity generators (sellers) and the wholesale buyers irregardless of where in the U.S. the parties were located. This meant that wholesalers like Enron and Green Mountain Energy could scour the country looking for the most competitive electric rates that they, in turn, could pass along to their customers which include both IOUs and end-users such as homes and
businesses. In doing so they could garner a larger share of the retail electricity market. The second step taken was to open up the retail electric markets to competition. The Electric Utility Industry Restructuring Act became law on September 23, 1996. This law enabled retail customers to purchase electricity from any wholesaler or IOU they chose. Retail customers with large enough energy demands (e.g. manufacturers) could even purchase power directly from the generators. Now, wholesalers could buy from whomever they wanted, and so could the end-users. In order for these laws to be put into practice, the electricity market had to be physically restructured as well. As shown on Exhibit 2, the largest IOUs in California are Pacific Gas & Electric (PGE), Southern California Edison (SCE), and San Diego Gas & Electric (SDGE). Seventy-five percent of California's electricity is provided by these three IOUs4.
Exhibit 2 Service Territories of California's Largest IOUs
Source: California Independent Service Operator (CAISO)
Prior to deregulation each of these IOUs provided their customers with the following bundle of services (Exhibit 3). Generation is where the electricity is produced. Transmission lines are likened to highways as they are the major pathways over which electricity travels. Distribution lines are analogous to streets, roads and alleys on which electricity travels to reach its final destination.
Exhibit 3 Bundled Services Provided by IOUs
Generation Transmission Distribution Retail Customers: End Users
Source: California ISO
GENERATION
To encourage wholesale competition each of these IOUs was required to divest itself of at least 50% of its power plants that used fossil fuels as their feedstock. Most of the total generating capacity was acquired
by a few non-utility owners domiciled outside of California. With this requirement, the IOUs became
both generators and wholesalers. Each could sell electricity to its retail customers that was generated directly by one of its own remaining plants, or it could resell electricity that it had purchased from any number of other power generators or wholesalers in the wholesale market (Exhibit 4). As long as these other power generators and wholesalers were able to physically and economically deliver the electricity, it did not matter where in the country they were located. However, in order to keep the IOUs from dominating the wholesale markets with their buying power, and to encourage new generators and wholesalers to enter into the power market, the IOUs were barred from purchasing wholesale electricity on long- or medium-term contracts. Rather they were confined to making their purchases on three spot markets: the day ahead, the day of, and the real time market.
TRANSMISSION
There are approximately 12,500 miles of transmission lines in California draped along transmission towers that carry the electricity that is produced in- or out-of-state to primary substations located up and down California. Collectively, these transmission lines form what is commonly known as the power grid. The transmission lines are owned by the IOUs. Deregulation also required the IOUs to give control of the transmission lines to the California Independent System Operator (ISO), the entity created to manage the flow of electricity on the power grid and to provide non-discriminatory access to the grid to all generators and wholesalers. Had this not been an additional requirement of deregulation, then each IOU could have kept other generators and wholesalers from being able to deliver power to their customers.
DISTRIBUTION
The distribution lines carry electricity from the primary substation to additional remote substations that are located closer to clusters of end-users. From each of these secondary substations, the electricity is carried along more distribution lines that ultimately connect with the end-users. Deregulation allowed the IOUs to maintain ownership and operational control of the distribution lines provided that they allowed unfettered access to these lines by other generators and wholesalers. Further, the IOUs could not mark-up the cost of their competitors' power that was being delivered over their distribution lines as this would have enabled the IOUs to quash the competition with excessive mark-ups.
Exhibit 4 Flow of Electricity and Attendant Buy / Sell Transactions
End End Endend
User User Transmission / Distribution
( (2) (3)
Buy / Sell Transactions ...
Wholesaler
S TInvestor Thesis Aut
-. OwnedIOU Generator
Utility Generator
Generator Independent eeao
Service LOperator Source: Thesis Author
COMPETITION TRANSITION CHARGE, STRANDED INVESTMENTS AND RETAIL RATE
FREEZES
The prescribed transition period to complete the deregulation process was four years, beginning on April 1, 1998 and ending on March 31, 2002. During this period of time the IOUs were allowed to charge all customers a competition transition charge to accelerate the recovery of stranded investments. These were unprofitable investments primarily made into nuclear and renewable energy power plants that the IOUs may not have made had the CPUC not legally required them to do so. These investments were originally financed by the IOUs based upon assurances from the CPUC that repayment of the debt could be made
through future electricity sales5. Because these power plants could not provide electricity at competitive rates in a deregulated environment, they would ultimately be stranded. Since the CPUC's assurances of debt repayment could not be maintained in a deregulated market, the recovery of stranded investments had to occur during the 4-year transition period via the competition transition charge.
To provide for the competition transition charge, the CPUC froze retail rates at their relatively high 1996 levels. The expectation was that the profits from the spread between the then prevailing high retail rates and low wholesale rates would ensure that the IOUs would be able to pay-off all of their stranded investments by the end of the four-year transition period. This would place the IOUs on competitive footing with new entrants into California's electricity markets. Retail rates for each IOU were to remain frozen until the earlier of (a) March 31, 2002 or (b) when the given IOU had paid off its respective stranded costs. The only exception to the rate freeze was a one-time 10% rate reduction provided only to residential and small commercial customers on January 1, 1998.
CHAPTER 2 - THE CALIFORNIA ENERGY CRISIS
THE INTIAL STAGES AND SUBSEQUENT ECONOMIC FALLOUT
During the first two and one-half years of deregulation (Jan-98 through May-00) things went as expected. Wholesale prices dropped by roughly 50% from their pre-deregulation levels from an average of $65 per megawatt-hour to $32 MWh6. The retail rates that had been capped for four years were well above these
wholesale electricity rates (Exhibit 5). The IOUs were capturing the spread between the wholesale and retail rates, enabling them to pay-down some of their stranded costs.
Exhibit 5 Wholesale Electricity and Natural Gas Prices During the First Years of Deregulation
Wholesale electricity prices -average CaIPX day-ahead price
$/MWh 400 350 300 250 PG&E SC
200 price cap' price
150 100
50 -~~ ~ - - ~ ~ ~~~~
. .' ' .' ' .' ' .' ' .' ' .' '. ' '. '
California natural gas prices
$/Mc( 40 40-35 PG&E 30 Citygate E 25 cap 20 15 -10 5 04L L .. . . . .I . .. . . . . 1999 2000 2001 1999 2000 200
Estimated by utilies by applying the tue prke cap to total bundled rates
Source: Energy Information Admk*tration Natural Gas Monthy; Brent Friedenberg & Associates; Wholesale Electricity Price Review; CEC; Economy.com; Western Gas Review; Energy ERA; RDI Gas Data
1
Source: "The Bay Area -A Knowledge Economy Needs Power". McKinsey & Company Report. April 2001.
However, by Jun-00, wholesale electricity prices exceeded the retail price caps set for the IOUs. By the end of 2000, wholesale electricity prices had quadrupled (Exhibit 5). During 2001, wholesale electricity prices climbed even further, much of this increase due to natural gas prices increasing by six-fold. Thirty-seven percent of California's in-state generation comes from natural gas fired power plants. Wholesale electricity prices continue to remain well above retail prices. The two largest IOUs, Pacific Gas & Electric (PGE) and Southern California Edison (SCE) have incurred tremendous losses due to collecting less from their retail customers than they were paying for wholesale electricity. SDGE's losses from
under-collections were relatively small. Because SDGE had paid-off all of its stranded costs by July-99, its retail rates were unfrozen pursuant to the terms of deregulation. This gave SDGE the latitude to raise its rates, passing along the costs of wholesale electricity to its customers. The economic fallout that has plagued the IOUs, the State of California, and businesses in California since the onset of this crisis is summarized as follows.
INVESTOR-OWNED UTILITIES AND THE STATE OF CALIFORNIA
Pacific Gas & Electric. PGE has amassed $5.6 billion in losses due to under-collections and declared
bankruptcy, seeking Chapter 11 protection from its creditors. Several credit rating agencies reduced PGE's corporate bond rating to junk bond status.
Southern California Edison (SCE). SCE has lost $3.9 billion in under-collections. SCE's corporate bond rating was also reduced to junk bond status.
San Diego Gas & Electric (SDGE). SDGE has amassed $750 million in under-collection losses. Of the three IOUs, it has remained in relatively good financial condition.
State of California. California's Department of Water Resources was authorized by emergency legislation to purchase power on behalf of the cash-strapped IOUs. It has spent more than $7.5 billion since Jan-017. These expenditures equate roughly to $1.2 billion per month.
Exhibit 6 Total Losses Incurred by the IOUs and the State of California as of July -01
8
-co
5.6
6
3.9
16 4
-...
2PGE
SCE
SDGE
CA
COST TO BUSINESSES
Retail Electricity Costs. Deregulation was expected to result in retail rates decreasing by 20% by 2003'.
Instead, rates for commercial customers of PGE and SCE have risen by 35% to 40%. It is possible that these rates could increase by another 10% when the retail rate freeze is lifted on April 1, 2002. It is estimated that a 50% rate increase will reduce the output of Bay Area businesses alone by $530 million for each year that rates remain at this level.
Rolling Blackouts. In 2000, there was only one Stage 3 emergency declared by the California ISO (Exhibit 7). During the first five months of 2001, however, there were thirty-eight. This number is expected to increase significantly during the summer months ahead. More of the blackouts have occurred in Northern California where supply shortages are more frequent than in Southern California. It is estimated that the Bay Area blackouts which occurred in Jan-01 and Mar-01 cost businesses $45 million and $94 million in reduced output. Output reductions due to blackouts projected for the summer of 2001 range from $960 million to $4.8 billion. A chronology is provided giving a more detailed account of how the energy crisis unfolded (Appendix 2).
Exhibit 7 Frequency of Stage 1, 2 and 3 Emergencies
70 S50 1---
---e
40
---
---
---
ustage 1
E
*Stage 2120---0
1998
1999
2000
2001
Source: California Independent System Operator .1!
CAUSES OF THE CALIFORNIA ENERGY CRISIS
The root causes of the California energy crisis and the resultant economic conditions are creating the potential investment opportunities in CHP generation. The longer that these conditions continue to exist, the greater the return on investment will be. Determining whether these primary causes and resultant conditions are likely to persist over an extended period of time or dissipate relatively quickly will be paramount to any investor.
DEREGULATION AS A CONSTRUCT
Some believe that deregulation is the primary cause of the California energy crisis. To assert that the electricity generation and transmission industry cannot function properly outside a regulated environment is to ignore the evidence. It was once thought that other industries could not function effectively in a deregulated environment. Examples include interstate rail freight, interstate trucking, gas transmission, airline travel and long distance telephone service. Contrary to conventional wisdom, when each of these industries was deregulated the quality of service increased while the cost of service dropped in real terms
by 27% to 57%9. When Margaret Thatcher deregulated United Kingdom's electricity markets in 1989,
there was a great deal of opposition. Within six years retail rates in the U.K. dropped 15% to 20%o. The Pennsylvania-New Jersey-Maryland (PJM) market was deregulated at about the same time that California was. During the same one-year period in which California's wholesale electric prices went from $32 per MWh (in 1999) to $118 (in 2000), those in the PJM market went from $28 to $34 (Exhibit
15)". In large part this is due to the latter having a healthy reserve margin of 17%12. From 1999 to 2000,
wholesale electricity prices in the UK actually decreased from $38 per MWh to $3413. The PJM and UK markets demonstrate that a deregulated electricity industry can thrive over the short- and long-term.
As will be shown on the following pages, the design flaws in California's deregulation (i.e., retail price caps and wholesale spot market purchases) did not get exposed until total supply approximated total demand. Had a healthy balance between the supply of and demand for electricity been maintained, wholesale prices would still be well below the frozen retail rates and the IOUs would still be paying down their stranded costs. Had retail prices remained well above wholesale prices, requiring the IOUs to buy all of their power on the spot market would not have become an issue. Further, attempts to stem the IOUs' flow of losses with post-facto wholesale price caps would not have been necessary. While the design flaws have amplified the crisis, they are not the primary cause.
MARKET POWER
A lot has been made about market power and the high wholesale prices charged by a few non-utility
owners that purchased most of the IOUs' largest power plants. In reality, these companies control only
33% of California's in-state generation capacity (Exhibit 1). There are two reasons that they have been
able to command such high prices. First, supply basically equaled demand. Second, they purchased many "peaker-plants" from the IOUs along with the baseload plants4. Peaker-plants only operate during
peak periods when demand and price are at their greatest.
ACUTE SUPPLY / DEMAND IMBALANCE
Most industry experts point to an acute imbalance between the existing supply of and demand for electricity in California as being the primary reason for its energy crisis. As pointed out by the Cambridge Energy Research Associates, for California to achieve an appropriate balance, it must have a minimum reserve requirement of 15% to 20%"5. The reserve margin is the amount by which available
supply must exceed peak demand. As in many states, peak demand in California occurs during summer afternoons when air-conditioners are used the most. The 15% to 20% reserve margin provides a cushion against unpredictable changes in supply and demand. Unexpected changes in supply result from e.g., power plants going off-line due to equipment failure and lower than normal amounts of power being imported into California from nearby states. Unexpected changes in demand are primarily weather related.
Balance existed in 1994 when supply exceeded peak demand by about 26% (Exhibit 8)16. IOUs, public agencies (e.g., municipal utilities), QFs, EWGs and other generators in California provided about 55 gigawatts (GW) of in-state generating capacity. Another 10 GW came from states such as Arizona, Oregon and Washington. Actual peak demand was approximately 48 GW.
Note: 1,000 watts is the approximate amount of electricity consumed by
one home.
A kilowatt equals one thousand (103) watts.
A megawatt equals one million (10 6) watts.
Reserve Margin in 1994
e5 GW Import
intemal apeely"
Namepate Adiual peak
summer day demand
cape*y and
notimports
SFirm tranmnislon capacity cntractsdinet of esxport), forecast In 1M for 1904
- Actual summer peak capelty or CAN subregion (Nevada has no generation capacky wthin the CANV subregion) source: FERC; NERC ESD database; C1m0; poect team anealsis
Source: "The Bay Area -A Knowledge Economy Needs Power". McKinsey & Company Report. April 2001.
By the summer of 2000, the reserve margin had shrunk to 1.9 GW or 3.5% (Exhibit 9)17. This slim margin left little room for contingencies such as power plant shutdowns and lower-than-expected imports. It also sent a very loud and clear message to all electricity generators that there was a buyer for virtually every megawatt of electricity that they could produce. As a result, wholesale electricity prices went skyward. There were several major factors contributing to this supply and demand imbalance.
Exhibit 9 Reserve Margin -- August 2000 Reserve margin - August
GW
Forecasted
supply
(capacity)
Outages Reduced Actual Peak imports available demand
capacity (8/16/00)
3.5%
Net
reserve
margin
Source: Press releases; CaISO; WSCC; NERC FERC; RDt Power~at; project team analysis
Source: "The Bay Area -A Knowledge Economy Needs Power". McKinsey & Company Report. April 2001.
Reserve margin Exhibit 8
Demand. Part of the supply / demand imbalance has been due to higher than normal levels of demand.
The following are three of the most significant factors contributing to increased demand.
Population Growth. From 1990 to 2000 California's population had grown by over 4 million people,
more than any other state. Historically, the demand for electricity had grown at 2% per year. However, in 2000, this growth rate doubled to 4%18. Further, peak load demand in 2000 increased by 8% during the months of May through September relative to the same months in 1999'9.
Higher Temperatures. From 1998 to 2000, the average June temperature increased by 4 degrees each
year. Average summer demand during these years increased 7% per year in part due to the increased use of air-conditioners20.
Retail Electric Rate Freeze. As part of California's deregulatory legislation, the retail rates charged to
end-users such as residences and businesses were frozen at their 1996 levels. Retail rates could not be adjusted to reflect the cost of skyrocketing wholesale prices. Consequently, there was no price mechanism to dampen the end-users demand.
Supply. Part of the supply / demand imbalance has been due to lower than normal levels of supply. The following are ten of the most significant factors contributing to reduced supply.
In-State Generating Capacity. From 1994 to 2000, in-state generating capacity had actually decreased from 55 GW to 54 GW2 1. Despite the continued migration of new residents into California, the growth of digital-economy companies, and the decommissioning of some power plants, not a single significant power plant had been built in the past decade2.
Permit Process. An exceptionally onerous power plant permitting process played a major role. By
the book, the process was supposed to take thirteen and one-half months23. In practice, it took twenty
months on average. By comparison, states such as Texas the process took an average of seven months. Generators had to contend with a phalanx of numerous and poorly coordinated governmental agencies, including the California Public Utilities Commission (CPUC), the California Energy Commission
(CEC), Federal Energy Regulation Commission (FERC), the Western Systems Coordinating Council (WSCC), the California Independent System Operator (ISO), local air quality management districts,
and local governmental agencies . In addition, generators had to contend with the strictest air-quality
Reduced Hydroelectric Generation. Thirty-nine percent of the electricity which California generates
in-state is hydroelectric (Exhibit 10). This is among the highest hydroelectric dependencies in the U.S. It is also the only feedstock for electrical generation that is vulnerable to the vagaries of the weather. Reduced rainfall in 1999 meant lower reservoirs. Higher summer temperatures meant greater evaporation rates, reducing reservoir levels even further. Collectively, there was less water available for power generation.
Reduced Imports. California receives about 18% of its electricity from nearby states25. About 9%
comes from the Pacific Northwest, 7% comes from the Southwest, and 2% comes from other states. Imports from these states during the summer months were down over 50% from their 1999 levels26
.
Southwestern states also experienced a very hot summer in 2000 and consequently had less available power to export. Imports into California from Pacific Northwest states were down significantly because of their own exceptionally low rainfall and dependency on hydroelectric power. Idaho, Washington and Oregon respectively derive 93%, 85% and 83% of their total in-state electricity from hydroelectric sources (Exhibit 10). In 2000, run-off volume in the Pacific Northwest was down about
8% from its 30-year average and hydroelectric generation was down 7% from its 30-year average.
Exhibit 10 States in which Hydroelectric Comprises 30% or More of State's Total Generation
8-4-01
State
ID
OR
WA ±
MT
SD
CA
ME
% of Total 93% 85% 83% 68% 58% 39% 38%
Additionally, population growth in the Pacific Northwest and Southwest over the past decade was significant, requiring that more of the total electricity generated in these states stay at home. Of the eleven states with the highest percentage increases in population from 1990 to 2000, seven of them were Pacific Northwestern or Southwestern states (Exhibit 11)28. Arizona, Washington and Colorado were among the top eight states with the greatest population growth in absolute terms with respective increases of 1,465,000; 1,027,000; and 1,007,000 new residents.
Exhibit 11 Fastest Growing State Populations (%)
.... ..
6-4-01
State
i
NV
ll
lO
o
UT
ID li
GA FL TX NCWA
ORChange(%)
66%
40%
31%
30%
29%
26%
24%
23%
21%
21%
20%
Change (000) 796 1,465 1,007 510 287 1,708 3,044 3,865 1,421 1,027 579
Source: 2000 U.S. Census
Power Plant Outages. Unplanned outages are usually the result of equipment failure or the unavailability of emission credits which some plants must obtain in order to operate in California. Planned outages occur so that routine maintenance and repair can take place. Due to greater demand, lower in-state supply and reduced imports, power plants in California had to operate for longer periods of time without routine maintenance. Equipment failure became more frequent as deferred maintenance accumulated, resulting in much higher levels of forced outages in the summer and fall of
2000 relative to 199929. When the IOUs owned and operated all of the power plants, coordinating planned outages amongst themselves was relatively simple and matter-of-course. By contrast, the lack of coordination between the ninety-seven new owners of the power plants formerly owned by the IOUs exacerbated the outage problem.
Electric Transmission Congestion. In 2000, the primary high voltage transmission line connecting Southern to Northern California, Path 15, was congested 50% of the time30. This reduced the flow of
surplus power from the south, particularly from the Los Angeles Department of Water and Power, a municipal utility that was not subject to deregulation. In 1999, Path 15 was congested only 28% of the time.
Natural Gas Transmission Congestion. Constraints in the transmission of natural gas into and throughout California resulted in wholesale gas prices in California increasing by six-fold while increasing by only two-fold in the rest of the country31.
Long Term Contracts and Forward Markets. Deregulation prohibited the IOUs from buying power
with long term contracts. They were limited to buying on three spot markets. Without mid- and long-term procurement contracts which ensured predelong-termined revenue streams to the generators, there was too much uncertainty for the generators to invest in the development of new power plants in California.
Wholesale Price Caps. California imposed price caps to stem the losses that the IOUs were incurring. The unintended consequence of the price caps was that in-state generators started to export power to
other states where wholesale prices were greater than the price caps, further depleting California's
32
reserve margin
Credit Issues for Investor-Owned Utilities. Retail price caps and the inability to enter into long-term
contracts put the IOUs in a lose-lose situation. With each day that the IOUs' huge under-collection losses mounted, generators became increasingly reluctant to sell electricity to them due to the elevated risk of non-payment. Supply suffered until the generators were ordered by the U.S. Secretary of Energy to sell electricity to the IOUs. Subsequently, the State of California stepped-in to buy power on behalf of the IOUs, easing the credit concerns of the generators. To date, California has spent approximately $7.5 billion on electricity33. This amount shall continue to rise given the wholesale electricity contracts which the State entered into with terms that extend through 2021.
BLACKOUTS
Business losses from blackouts can total billions of dollars. The longer each blackout lasts, the more frequently they occur, and the longer that they persist (months or years), the greater business losses will be. Quantifying these variables to gauge whether office tenants will pay a rent premium for reliable power is critical to the landlord's decision to invest in CHPs or not.
How Blackouts Are Orchestrated. To understand how California companies are financially impacted by blackouts, it will be useful to understand how blackouts are literally orchestrated by the California
Independent System Operator (ISO). When the reserve margin falls below a certain level, the California
ISO declares an emergency. What determines whether a Stage 1, 2 or 3 is declared is the extent to which
the reserve margin has dropped34
Stage 1 Emergency. When the reserve margin falls below 7%, all electricity consumers are asked to
voluntarily reduce their power consumption as much as possible by e.g., turning-off lights, appliances and office machinery.
Stage 2 Emergency. When the reserve margin falls below 5%, power may be interrupted to some
heavy commercial and industrial users such as oil refineries. These interruptible customers have special contracts with power providers which gives them discounted rates in exchange for agreeing to curtail their power during Stage 2 emergencies.
Stage 3 Emergency. When the reserve margin is expected to fall below 1.5% within a 2-hour period,
coordinated blackouts may be implemented. To avert blackouts, the ISO feverishly attempts to locate last-minute sources of imported power. In some instances the ISO will halt the huge state-owned pumps which push water down the California Aqueduct from Northern to Southern California, reducing demand by 300 MW.
When rolling blackouts are implemented, the ISO directs each utility to suspend the delivery of a certain amount of electricity (e.g. 1,000 megawatts). PGE, the utility which covers most of Northern California has divided its 4.5 million customers into 14 "blocks" each representing about 550 megawatts of power. Power to each block is cut for about 60 to 90 minutes at a time35. Then the blackout rolls to the next
block until the stress on the grid has been relieved. To lessen collateral business losses such as equipment damage and data loss, the IOUs provide advance warning to those businesses that will likely be affected.
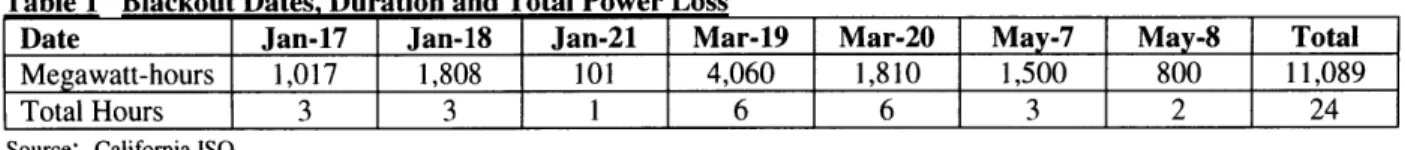
In 2001, there have so far been thirty-eight Stage 3 emergencies and seven blackouts (Table 1). The total loss of power has been 11,089 megawatt-hours.
Table 1 Blackout Dates, Duration and Total Power Loss
Date Jan-17 Jan-18 Jan-21 Mar-19 Mar-20 May-7 May-8 Total Megawatt-hours 1,017 1,808 101 4,060 1,810 1,500 800 11,089
Total Hours 3 3 1 6 6 3 2 24
Source: California ISO
Cost to Businesses in the Aggregate. Despite their infrequency, blackouts can cost businesses billions of dollars due to lost productivity, idled workers, lost data, damaged equipment, product damage, reduced customer satisfaction, and reduced competitiveness. In Northern California, Bay Area technology companies have been particularly impacted. According to the Silicon Valley Manufacturers Group, an industry association of 195 high-tech luminaries such as Intel and Adobe Systems, the blackouts that occurred in Jan-01, idled 100,000 workers and cost tens of millions of dollars36
.
How much individual businesses have lost is a function of which of the seven blackouts they were subjected to, how many 60- to 90-minute forced outages they experienced, the extent of collateral losses, and whether the outages occurred at times of high productivity. Trying to collect the relevant data from individual companies and aggregating the data to calculate total business loss would be highly problematic. An alternative method for estimating business loss is to look how much California's gross state product (GSP) is being impacted. Regression analysis that relates California's electric consumption with its GSP from 1991 through 2000 indicates that for each MWh consumed, gross product increases by $16,000 (Exhibit 12)31. The R2 of this analysis is 96%. Conversely, for each MWh that is
demanded but not delivered due to a blackout, GSP decreases by $16,000.
Exhibit 12 Reeression Analysis Correlating California Gross Output with Electricity Consumption
Real GSP $ Billions 1,400 1,200 99 1,000 1997 Each MWh of electricity 99 Is tied t0 about $16,000
1991 of gross stats product
00 1992 1993 600
120 130 140 150
Annual electric consumption TWh
G as tte prouct as msttd in 1996 doNara; bmues commercial and kiduslal cnsundptin
Souc: Caioals Technkgy; Trade and Cornerce Agency; CEC: Eonoragic; projecI team analysts
The unserved demand that resulted from the Bay Area blackouts in January and March of 2001, was
2,825 MWh and 5,870 MWh respectively. Accordingly, the respective reduction in GSP was approximately $45 million and $94 million. During the summer-01, Cambridge Energy Research Associates (CERA) expects as many as 20 hours of extreme shortage in which demand exceeds supply by
3,000 MW38, requiring the state to implement rolling blackouts. This would reduce GSP by nearly $1
billion in revenues (Table 2).
Table 2 Total GSP Loss Ex ected from Pros ective Summer-01 Blackouts
Unserved Demand Blackout Hours Lost GSP per MWh Total GSP Loss
3,000 MW x 20 Hours x $16,000 = $960 million
A $960 million reduction in GSP is considerable. However, consider that California's gross state product
in 1999 was approximately $1.229 trillion3 9
. Relative to this total, the loss of GSP is a mere .08%. Even if this GSP loss were quintupled to $4.8 billion it would still only equate to .4% of GSP.
This is not meant to trivialize these losses particularly for those businesses that may have suffered disproportionately. But, it is reasonably consistent with the responses given in a web-based survey conducted by the Bay Area Economic Forum (BAEF) of 512 Bay Area businesses that included members of the Silicon Valley Manufacturers Group. While most of those surveyed voiced very strong concerns about the impacts of the energy crisis, particularly those regarding the reliability and price of electric power, over 71% of the respondents indicated that they had no plans for additional or alternative energy resource development in the near future". (Thirty-eight percent already had on-site generation that is used either for emergency back-up or to supplement the electricity they receive from the IOUs.) This muted sense of urgency could be explained by the infrequency of the blackouts, the relatively insignificant associated costs, a general expectation that new supply will be on-line soon, and that recurrent blackouts will not continue past 2001 or 2002.
How Many Years Will Blackouts Persist. If the rationale for investing in office building CHP systems
is primarily to prevent business loss due to blackouts, then investors will want to know how long will blackouts continue after 2001. If it appears that the reserve margin is trending upward and will be well above 1.5% by 2002, then blackouts will not persist past 2001. By making certain assumptions about what peak demand and total available supply will be during the summer months over the next three years, a spreadsheet analysis can be constructed which estimates the reserve margin during the summer of 2001 through 2004 (Exhibit 13). Explanations for each assumption about demand growth, in-state generating capacity, imports, planned and unplanned outages are provided in Appendix 3.
Exhibit 13 Summer Reserve Margin (2001-4)
On-Line Estimates for Plants already On-Line or Under Construction
Jun Jul Aug Summer Summer Summer
2001 2001 2001 2002 2003 2004
Demand
Annual Demand Growth (a) 3% 3% 3% 2% 2% 2%
Peak Summertime Demand 54.3 51.6 51.6 52.6 53.7 54.7
Incremental Demand Reduction from 5.0% 0.0% 0.0% 0.0% 0.0% 0.0%
Rate Increases (b)
Resultant Demand 51.6 51.6 51.6 52.6 53.7 54.7
Supply
In-State Capacity (c) 54.0 54.0 55.3 56.3 59.7 64.3
Planned Capacity Additions (d) 0.0 1.3 1.0 3.4 4.6 1.0
Imports (e) 3.2 2.8 1.2 3.4 3.7 3.8
Less: Planned Outages (f) 1.0 1.0 1.0 1.0 1.0 1.0
Less: Unplanned Outaaes (f) 3.0 2.0 2.0 2.0 1.0 1.0
Total Supply 53.2 55.1 54.5 60.1 66.0 67.1
Reserve Margin
(#)
1.6 3.5 2.9 7.5 12.3 12.3Reserve Margin (%) 3.0% 6.4% 5.3% 12.5% 18.6% 18.4%
Blackouts Likely (Reserve Margin = Maybe Maybe Maybe No No No
or < 1.5%)
Source: Thesis Author
About 11,300 megawatts of in-state generating capacity will come on-line over the next three and one-half years, 3,800 megawatts of which will be put into operation in 200141. As a result, the reserve margin should range from 3.0% to 6.4% during the summer months of 2001. Though these margins are above the 1.5% Stage 3 threshold, it's still quite possible that blackouts could occur particularly if any unanticipated contingencies occur. Recall that CERA expects up to twenty hours of extreme supply shortages. Given the increased in-state generating capacity that will likely be on-line from 2002 through 2004, the reserve margin will rise into the mid-teens where blackouts will not pose any threat. Given that blackouts should not persist beyond the summer of 2001, it makes sense that only a minority of Bay Area
companies were contemplating having additional on-site generation installed.
Forecasting the reserve margin is a complex matter. Admittedly, certain variables have not been incorporated into the above analysis. For example, the power grid needs a minimum of $1 billion worth
42
of capacity increases and upgrades that will take five or more years to complete . If the grid cannot
accommodate the increased generation levels, then deliverable supply and effectively the reserve margin will not increase as projected. Similarly, the natural gas transmission pipelines that will provide the fuel used by virtually all of the new power plants are also operating at or near capacity4 3. If they are not
adequately expanded, deliverable supply and the reserve margin will also suffer. Given all the numerous variables that need to be considered, the opinions of seven experts in regulatory and energy economics were sought (Table 3). The consensus among these experts was that blackouts should not continue past 2001.
Table 3 Experts in R gulatory and Energy Economics
Name Profile
A. Denny Ellerman Executive Director, MIT Center for Energy and Environmental Policy Research Paul Joskow Director, MIT Center for Energy and Environmental Policy Research
Dan McFadden Professor of Economics at UC Berkeley; Nobel Laureate
Ernest Moniz Professor of Physics at MIT; Former U.S. Undersecretary of Energy Robert Solow Professor of Economics at MIT; Nobel Laureate
James Sweeney Senior Fellow, Stanford Institute for Economic Policy Research
Mitch Wilk Past President & Commissioner of the California Public Utilities Commission
RETAIL ELECTRICITY PRICES
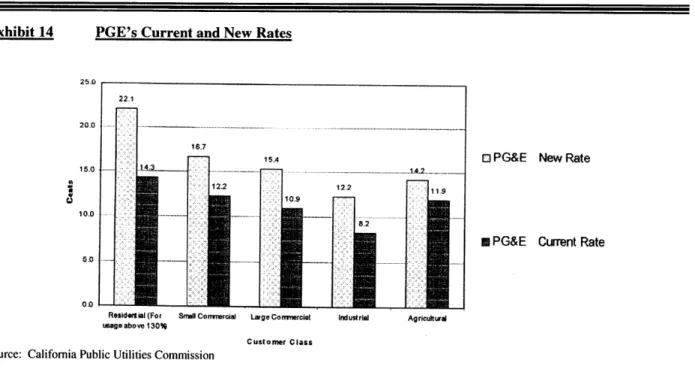
On June 1, 2001 commercial rates for SCE and PGE increased by 35.7% and 41.3% respectively (Exhibits 14 and 15). To determine if these historic rate increases and other prospective charges will create demand for CHPs that can provide office tenants with lower-cost electricity, it will be useful to determine how these cost increases impact California businesses and office tenants, and how long these cost increases will persist.
PGE's Current and New Rates
o PG&E New Rate
m PG&E Current Rate
Resida1ia(For Srall ComWrcial Large Comnercial usago above 130%
Custoner Class Source: California Public Utilities Commission
Industrial AgriculturA Exhibit 14