LHCb-PUB-2016-018 05/07/2016
Upgrade of the monitoring
system of LHCb ECAL
Public Note
Issue:
1
Revision:
0
Reference:
LHCb-PUB-2016-018
Created:
June 08, 2016
Last modified:
July 13, 2016
Prepared by:
I. Belyaev
a, E. Chernov
b, V. Egorychev
a, Yu. Guz
b,
S. Kandybei
c, T. Kvaratskheliya
a, V. Obraztsov
b, P. Perret
d, S. Philippov
e,
D. Savrina
a, P. Shatalov
a, T. Zakoryuchkina
b, A. Zhokhov
a, S. Zvyagintsev
b aInstitute of Theoretical and Experimental Physics
(ITEP), Moscow, Russia
b
Institute for High Energy Physics (IHEP), Protvino,
Russia
c
NSC Kharkiv Institute of Physics and Technology
(NSC KIPT), Kharkiv, Ukraine
d
Universit´e Blaise Pascal, CNRS/IN2P3, LPC,
Clermont-Ferrand, France
e
Institute for Nuclear Research of the Russian Academy
Public Note Issue: 1 Date: July 13, 2016
Abstract
The LHCb ECAL is a shashlik calorimeter of 6016 cells, covering 7.68×6.24 m2area. To monitor the
readout chain of each ECAL cell, the LHCb ECAL is equipped with a LED based monitoring system. During the LHC Run I (2009-2012) it was found that the precision of the monitoring suffers from the radiation degradation of transparency of polystyrene clear fibers used to transport the LED light to the ECAL photomultipliers. In order to improve the performance of the monitoring system, and especially in view of significant increase of LHCb working luminosity foreseen after 2018, the present plastic fibers have been replaced by radiation hard quartz fibers. The design of the upgraded version of the LHCb ECAL monitoring system is described here. The usage and performance of the new system for the ECAL calibration during the LHCb Run II are discussed.
Document Status Sheet
1. Document Title: Upgrade of the monitoring system of LHCb ECAL 2. Document Reference Number: LHCb-PUB-2016-018
3. Issue 4. Revision 5. Date 6. Reason for change
Draft 0 May 05, 2016 First version, formerly it was the internal note LHCb-INT-2015-011
Draft 1 July 03, 2016 Rearranged and updated, performance figures added
Contents
1 Introduction . . . . 2
2 Performance of the ECAL monitoring system and its usage before LS1 . . . . 3
3 Selection of components . . . . 5
4 Irradiation studies . . . . 5
5 The fiber bundle design, production, installation and commissioning . . . . 9
6 Usage of the upgraded ECAL monitoring system . . . . 11
7 Conclusion . . . . 12
8 References . . . . 12
List of Figures
1 LED light distribution layout. Positions of the monitoring boxes are shown by rectan-gles below and above the calorimeter. Zones of the calorimeter served by each box are also shown. The color code corresponds to the lengths of light guides for each cell. . 42 View of the ECAL LED monitoring system: a) connection of light guides, ECAL front-face, Inner part, before upgrade; b) components of a monitoring box. From bottom to top: LED driver PCBs; LED housings; light guide bundles; PIN photodiode housings; PIN photodiode amplifiers. . . 5
Public Note Issue: 1
1 Introduction Date: July 13, 2016
3 Evidence of clear fiber degradation in LHCb ECAL: a) ratio of LED amplitudes on June 06, 2012 to those on May 02, 2012, for each ECAL cell; b) evolution of average LED signal for the two upper rectangular areas shown in a; c) evolution of average LED signal for the two lower areas. . . 6 4 The irradiation setup. . . 6 5 Results of the irradiation test of quartz fibers. At the main plot: relative transparency
per 1 m of fiber during the test, as a function of time. At the insert: dose dependency of the long-term part of the transparency degradation, measured after 20 minutes anneal-ing. Red stars: fiber FVP200220240; black triangles: MIS-166. The measured degradation rates are given at the plot. . . 7 6 Study of the dose rate dependence of the short term transparency variation of the two
fiber samples irradiated in 2013 to 825 krad: a) the time dependences of the relative transparency per 1 m; b) the magnitudes of relative transparency variation per 1 m as a function of dose rate. . . 7 7 The emission spectrum of the “white” LED used in the 2014 test. It allows to study the
wavelength range of 420 – 700 nm. . . 8 8 Study of the wavelength dependence of the radiation induced transparency loss in the
FVP200220240 fibers for the fiber sample which was not irradiated before: a) the time dependences of the relative transparency per 1 m for three wavelengths; b) the wave-length dependence of the relative transparency per 1 m on wavewave-length at the end of the test, after 20 minutes annealing. . . 8 9 Study of the wavelength dependence of the radiation induced transparency loss in the
FVP200220240 fibers for the fiber sample which was irradiated in 2013 to 825 krad: a) the time dependences of the relative transparency per 1 m for three wavelengths; b) the wavelength dependence of the relative transparency per 1 m on wavelength at the end of the test, after 20 minutes annealing. . . 9 10 Details of the fiber bundle design: a) a 9-channel bundle; b) zoom view of the 9 module
side connectors, without end piece and nut; c) plastic end piece and nut, to be glued to each module side connector right before the installation. They are intended for the compatibility with the old optical connectors on the ECAL modules; d) zoom view of the LED side. . . 10 11 Pictures from the ECAL monitoring system upgrade work. . . 11 12 LED signal variations in each ECAL cell for new and old monitoring systems: a) ratio
of LED signal amplitudes on May 21, 2016 to those on May 20, 2016 (22 pb−1at 13 TeV)
; b) ratio of LED signal amplitudes on June 2, 2012 to those on June 1, 2012 (39 pb−1at
8 TeV). The radiation dose in both cases is approximately the same. Note the presence of the light guide ageing pattern in b) and its absence in a). . . . 12
List of Tables
1
Introduction
The LHCb ECAL design is described in [1]. It is a shashlik calorimeter of 25 X0thickness, covering
7.68×6.24 m2 area. It is subdivided into 6016 cells. The light produced in each cell is read out by a
PMT; the PMT anode signal is digitized by an ADC.
To monitor the functionality of the readout chain of each ECAL cell and the stability of its charac-teristics, the LHCb ECAL is equipped with a LED based monitoring system. The value of average photomultiplier response to light flashes of fixed intensity is used to follow up the behavior of each readout channel, mostly determined by the stability of the PMT gain. The principles of the monitoring system design are discussed in [1].
Public Note Issue: 1 2 Performance of the ECAL monitoring system and its usage before LS1 Date: July 13, 2016
The monitoring system is organized such that each LED illuminates a group of 9 or 16 ECAL cells. The 6016 cells of LHCb ECAL are illuminated by 456 LEDs. The stability of LED flash magnitude is mon-itored by PIN photodiodes (HAMAMATSU S1223-01). Each PIN photodiode serves a group of 2 or 4 LEDs; the LED firing sequence ensures that two LEDs within same group never flash simultaneously. The LEDs, PIN photodiodes and corresponding electronic boards reside in ten light tight boxes (“mon-itoring boxes”), which are installed below and above the calorimeter, outside the high radiation area. The light is distributed to each PMT by means of a 2–8 m long light guide. The LED light distribution layout is shown in Figure 1. Note that 8 out of the 10 monitoring boxes are installed at the bottom of the calorimeter, which explains usage of long (up to 8 m) light guides.
The LHCb ECAL monitoring system comprises 6016 light guides grouped into 456 bundles, 456 LEDs and 124 PIN photodiodes. The total length of light guides is 28.6 km. Pictures of light guide connec-tions at the ECAL front face and of a monitoring box components are shown in Figure 2.
Initially, polystyrene-based KURARAY Clear-PCM fiber of 1 mm diameter was used as material for the light guides. Using red LEDs (LUR3333H from Ligitek) was intended to reduce the effect of ra-diation damage of clear fiber. However, during the LHC Run I (2009-2012), it was observed that sig-nificant variation of amount of LED light at PMTs takes place, with a pattern which can be attributed only to the radiation damage of the light guides.
In order to be able to use the ECAL LED monitoring system for precise PMT gain following, it was de-cided to replace the light guides to new radiation hard ones. The replacement was done in 2013-2014, during the LHC Long Shutdown 1 (LS1) after Run I. The design of the new light guides, replacement procedure, as well as performance of the old and new monitoring systems, are described below.
2
Performance of the ECAL monitoring system and its usage before LS1
The ECAL monitoring system played an important role at the commissioning and initial calibration phase [2]. During the LHCb data taking, it is also kept continuously running. The LED pulses are sent to PMTs at approximately 50 Hz rate. The pulses are synchronized with the LHC operation and are sent only at the moments corresponding to empty LHC bunch crossings, in order to not interfere with physics events. The LED data, in form of amplitude spectra for every calorimeter cell, are stored to disk every 10–15 minutes.
During operation, calorimeter cells experience variations of sensitivity, which determines need for regular calibration. The main contribution to such variations comes from various PMT gain instabili-ties, including (but not limited to) ageing of their dynode system [3]. Another source is the reduction of light yield of the calorimeter cells because of radiation damage of scintillator and WLS fibers. The former can reach few percent at a time scale of few days; the latter is slower, although essential for central counters for the time scale of ∼1 month.
The ECAL calibration strategy during the LHC Run I was very simple. The data were taken at constant PMT high voltage settings during the year. Then, at the end of the year, the data were split in several intervals, and a precision offline calibration, based on the π0peak position [5] and E/p for electrons,
was performed for each of them. The calibration coefficients for each cell obtained for each of these intervals were stored in the database and used at the next data reprocessing.
The working LED monitoring system data could be used to monitor the PMT gains and adjust them when necessary (the most convenient way is to change their high voltages). There are several reasons why it would be advantageous to have PMT gains stable during the data taking. For example, ECAL data are used in the LHCb L0 trigger decision [1], and any instability of PMT gains affects the L0 thresholds and rate. Second, if the PMT gains are stable during a period which is then used for the π0
calibration, one can achieve better average energy resolution.
It is important to note here that the LED monitoring system is sensitive only to PMT gain variation and not to reduction of light yield of the calorimeter cells. In contrary, offline calibration procedures based on physics processes (as the π0calibration in our case) are sensitive to the true sensitivity of
calorimeter cells to electromagnetic showers. Therefore it is in any case necessary to perform the of-fline calibration with a period determined by the light yield degradation rate, typically every several weeks.
Public Note Issue: 1 2 Performance of the ECAL monitoring system and its usage before LS1 Date: July 13, 2016
Figure 1 LED light distribution layout. Positions of the monitoring boxes are shown by rectangles
below and above the calorimeter. Zones of the calorimeter served by each box are also shown. The color code corresponds to the lengths of light guides for each cell.
However during the Run I operation it was found that the precision of PMT gain monitoring with LED system is affected by radiation damage of the long light guides transporting LED light to calorimeter cells. It is illustrated in Figure 3. The particle rate in the four symmetrically placed areas, and therefore the average PMT gain degradation rate, is expected to be the same; however we see a 14% difference between upper and lower areas. It can be attributed to the difference in the transparency loss of the light guides, which is determined by their layout. As one can see in Figure 1, for all these areas the LEDs are installed under ECAL. Therefore for the two upper areas the light guides are significantly longer than for the lower ones (6–8 m vs 2–4 m), and pass through the y = 0 plane, where the particle rate (dose rate) is significantly higher than in the selected areas themselves. According to the simula-tion studies [4] and recent measurements of the radiasimula-tion doses in LHCb, the 14% difference shown in Figure 3 corresponds to a dose of ∼10 krad accumulated mainly by ∼1 m long parts of light guides at −0.5 < y < 0.5 m.
As the required ECAL calibration precision is ∼1%, the LED monitoring data could not be used for PMT gain following in LHCb Run I.
In order to enable the precise PMT gain following in ECAL, it was decided to replace in 2013-2014 the present light guides to new ones, made of radiation tolerant quartz fibers.
The radiation degradation of the light guide transparency is determined, to a first approximation, by the dose integral over the fiber length. For LHC Run II, when LHCb will run at the luminosity of 4 · 1032cm−2s−1, it does not exceed 100 krad·m per year (2 fb−1).
After 2018, LHCb will be upgraded for work at 5 times higher luminosity, 2 · 1033cm−2s−1[6].
How-ever, the dose rate at the ECAL front face, where the light guides are placed, will increase by less than factor of 2, because the Preshower detector in front of ECAL will be removed. The precise calibra-tions at high luminosity running will be performed more frequently, according to the increase of the degradation rate of the ECAL light yield.
In any of these two modes of operation, the dose integral over the length of any light guide accu-mulated during a period between two precise calibrations will not exceed 100 krad·m. Therefore the radiation damage of light guides will not significantly affect the calibration if the degradation of transparency of the quartz fiber is less than 1% per metre for 100 krad. This can be considered as a requirement for the radiation tolerance of quartz fibers.
Public Note Issue: 1
4 Irradiation studies Date: July 13, 2016
Figure 2 View of the ECAL LED monitoring system: a) connection of light guides, ECAL frontface,
Inner part, before upgrade; b) components of a monitoring box. From bottom to top: LED driver PCBs; LED housings; light guide bundles; PIN photodiode housings; PIN photodiode amplifiers.
3
Selection of components
The radiation damage of quartz fibers for visible light was extensively studied for CMS HF [7, 8, 9]. It was shown that the best radiation hardness for visible light can be obtained with quartz fibers with pure silica – high OH−core and F -doped silica cladding. Their radiation hardness is at least two order
of magnitude higher than that of Clear-PSM fibers. The radiation loss of transparency of pure silica – high OH−quartz fibers depends on the wavelength (see e.g. Figure 1 in [8]). Within the range of
PMT photocathode sensitivity, the minimum radiation damage is observed between 400 and 500 nm. Obviously, the red LEDs of present monitoring system (LUR3333H from Ligitek) have to be replaced by blue ones.
We have chosen CREE LC503 with emission spectrum peaking at 460 nm. The choice criteria were good timing characteristics and high signal amplitude obtained with existing ECAL LED drivers and PMTs. Another requirement, determined by the LED driver design, was that the LED should have reverse breakdown voltage higher than 15 V.
The LHCb ECAL HV setting scheme is such that the PMT gain is roughly proportional to the distance between the cell and the beam axis [1]. The PMTs in the very central cells work therefore at rather low gains, order of 103. In order to obtain LED signal in the middle of ADC range, the LED flash should
produce 1–2·105photoelectrons. The maximum amount of light delivered to PMT is determined by
the fiber diameter. With the chosen LED type and existing LED driver capabilities, the optimal fiber core diameter was found to be 200 µm.
The 200 µm diameter quartz fibers with pure silica / high OH−core and F -doped silica cladding are available from several producers. All of them are expected to satisfy the requirements of the ECAL monitoring system. Our choice, made on the lowest price basis, was FVP200220240 fiber from Polymi-cro Technologies, Inc., USA.
4
Irradiation studies
As it was already mentioned above, a large array of data on radiation degradation of quartz fibers is available. Most of them are taken for multi-Mrad doses and sizeable transparency losses. Because of
Public Note Issue: 1
4 Irradiation studies Date: July 13, 2016
Figure 3 Evidence of clear fiber degradation in LHCb ECAL: a) ratio of LED amplitudes on June 06,
2012 to those on May 02, 2012, for each ECAL cell; b) evolution of average LED signal for the two upper rectangular areas shown in a; c) evolution of average LED signal for the two lower areas.
Figure 4 The irradiation setup.
possible non-linear dependence of the degradation on dose, and reported dependence on dose rate, the extrapolation to relatively low doses and few percent degradation is not obvious. For this reason, we have decided to perform dedicated measurementsa.
The first test was performed in June 2013 at the cyclotron of UCL (Louvain-la-Neuve, Belgium). Two types of fiber were tested: FVP200220240 (Polymicro) and MIS-166 (Fryazino, Russia), both with 200 µmdiameter core. Two 5 m long samples wound on a 6 cm diameter spool were irradiated with 62 MeV protons. The important feature of this facility is a broad beam with rather uniform profile: ±10% variations within 8 cm diameter core. The beam flux was set to 2·108p/cm2/s, which produced the
dose rate in quartz of ≈ 28 rad/s.
The transparency of the two samples was continuously monitored during the irradiation and 12 h afterwards. The experimental setup is shown in Figure 4. The samples were connected to the light source and to the measurement equipment placed in the control room via 8m long light guides made of FVP200220240 fiber. To monitor possible degradation of these light guides, dedicated control fibers of the same kind were used (see Figure 4). At the first test we studied only the spectral range of inter-est: the blue LED Multicomp OVL-5523 was used as a light source. The output light was measured by PIN photodiodes HAMAMATSU S1223-01.
The beam induced dark current in the samples was measured and found negligible, as expected: the 62 MeV protons do not produce ˇCerenkov light in quartz.
The samples were irradiated during 10 hours, with three 20-30 min periods without beam (and one 9 min period because of accelerator problems). These periods are clearly visible in the Figure, due
aThe research leading to these results has received funding from the European Commission under the FP7 Research
Public Note Issue: 1
4 Irradiation studies Date: July 13, 2016
Figure 5 Results of the irradiation test of quartz fibers. At the main plot: relative transparency per 1 m
of fiber during the test, as a function of time. At the insert: dose dependency of the long-term part of the transparency degradation, measured after 20 minutes annealing. Red stars: fiber FVP200220240; black triangles: MIS-166. The measured degradation rates are given at the plot.
Figure 6 Study of the dose rate dependence of the short term transparency variation of the two fiber
samples irradiated in 2013 to 825 krad: a) the time dependences of the relative transparency per 1 m;
b) the magnitudes of relative transparency variation per 1 m as a function of dose rate.
to fast annealing of transparency loss. The radiation doses corresponding to the moments of beam stops were calculated on the basis of the theoretical dose rate and beam time, and have a common systematic uncertainty of ∼10%. The total dose, 825 krad, roughly corresponds to the maximum dose accumulated by the clear fibers in ECAL after 5–10 years of work.
The result, expressed in terms of transparency of 1 m of fiber as a function of time, divided by the transparency before irradiation, is shown in Figure 5. One can see fast degradation and fast annealing cycles corresponding to stopping and resuming of irradiation. The magnitude of transparency vari-ation in these cycles depends on the previously accumulated dose; of course it should depend also on the dose rate. The annealing lasts ∼10–20 minutes; there is no significant change of transparency during 12 hours after the test. The transparency value after annealing does not return to the initial value, there is a non-zero residual damage. Its dose dependences for the two types of fiber are shown at the insert in Figure 5, it is roughly linear. The degradation rates obtained from fitting these dose dependences are 0.14% and 0.22% per metre for 100 krad for the FVP200220240 and MIS-160 fibers, respectively.
For the LHCb ECAL application, the expected maximum dose rate for fibers will not exceed 0.01 rad/s, which is more than three order of magnitude less than at the irradiation test. Therefore the relevant value of fiber transparency degradation is expected to be very close to the residual one. Both
Public Note Issue: 1
4 Irradiation studies Date: July 13, 2016
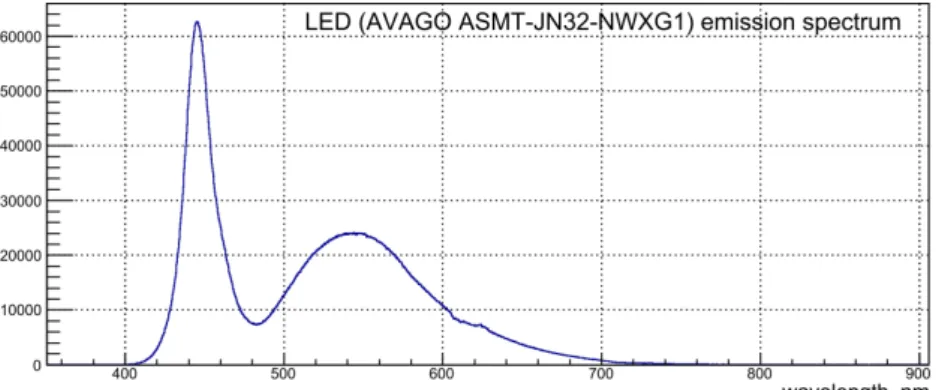
Figure 7 The emission spectrum of the “white” LED used in the 2014 test. It allows to study the
wavelength range of 420 – 700 nm.
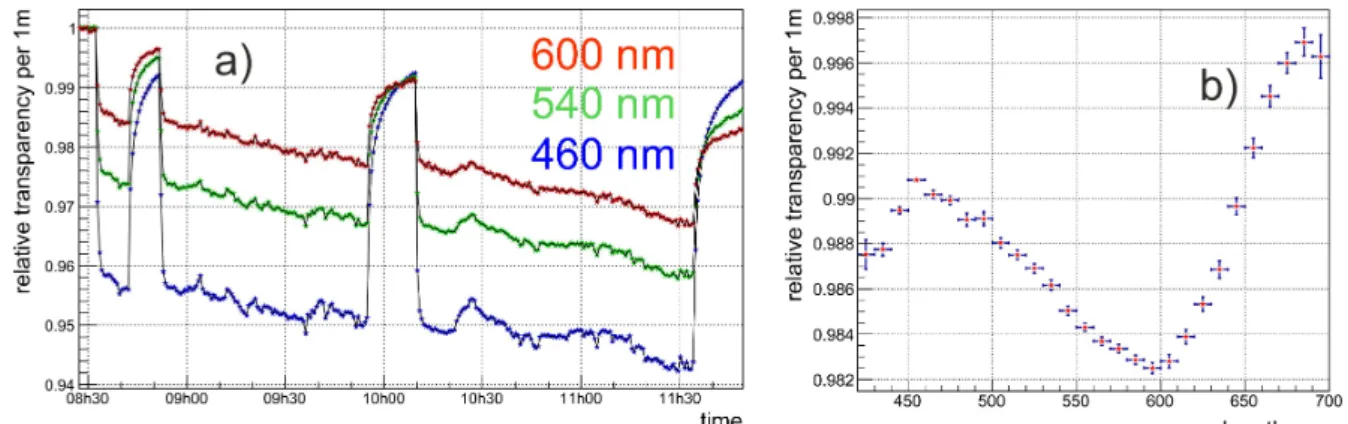
Figure 8 Study of the wavelength dependence of the radiation induced transparency loss in the FVP200220240 fibers for the fiber sample which was not irradiated before: a) the time dependences of the relative transparency per 1 m for three wavelengths; b) the wavelength dependence of the relative transparency per 1 m on wavelength at the end of the test, after 20 minutes annealing.
types of fiber therefore satisfy our requirement of degradation rate not exceeding 1% per metre for 100 krad. Their degradation rate is about 3 order of magnitude better than that of plastic fibers. The direct measurement of the dose rate dependence of the fiber transparency variation has been performed during the second irradiation test in UCL, in July 2014, using our fiber samples which were irradiated there to 825 krad during the first test in 2013 and then experienced one year of annealing. At the beginning of the 2014 test, we measured transparency of the two samples as a function of time with the setup identical to that used in the 2013 test, but at different values of the beam intensity. The 20 minutes long periods of irradiation were interleaved with 20 minutes long periods without beam, in order to observe the degradation and recovery cycles and measure their magnitude as a function of dose rate. The time dependence of the relative transparency per 1 m for the two samples is shown in Figure 6a. Six periods of irradiation with different dose rates are clearly seen; the values of dose rates, from left to right, were 28, 0.28, 0.84, 2.8, 8.4, 0.28 rad/s. The total dose received by the samples in this test is about 30 krad, which is much less than in the previous test (825 krad). The results are summarized in Figure 6b, which shows the magnitude of the relative transparency variation per 1 m as a function of dose rate. Within the given range of dose rates, it can be described by a power law with exponent of approximately 2/3 (the values are given at the plot). Extrapolating to the dose rate of 0.01 rad/s which is maximum expected in the LHCb ECAL, one obtains for FVP200220240 0.012%; the value of 0.13% measured for 0.28 rad/s can be considered as an upper limit. In any case, this study shows that the short term variations of the fiber transparency in LHCb ECAL will be well below 1% per 1 m even after several years of operation.
During the 2014 irradiation test we also studied the wavelength dependence of the radiation induced transparency loss in the FVP200220240 fibers. The measurement scheme was basically the same, but with a “white” LED (AVAGO ASMT-JN32-NWXG1) as a light source and a spectrometer (two channel
Public Note Issue: 1 5 The fiber bundle design, production, installation and commissioning Date: July 13, 2016
Figure 9 Study of the wavelength dependence of the radiation induced transparency loss in the FVP200220240 fibers for the fiber sample which was irradiated in 2013 to 825 krad: a) the time de-pendences of the relative transparency per 1 m for three wavelengths; b) the wavelength dependence of the relative transparency per 1 m on wavelength at the end of the test, after 20 minutes annealing.
AvaSpec ULS2048-USB2) as a light readout device. The results of these measurements were not used for making any decision on components, and are given below only for completeness.
The “white” LED light spectrum is shown in Figure 7; it allows to study the wavelength range of 420 – 700 nm.
The irradiation was performed at a dose rate of 28 rad/s. The test duration was 3 hours, with two 20 min periods without beam, intended to see the recovery. Two 5 m long samples were used in this test, both made of FVP200220240, one of them was the irradiated sample used in the previous test (825+30 krad), the other one was not irradiated before. The total dose received by the samples in this test was about 270 krad.
The results on the initially not irradiated sample are represented in Figure 8. Figure 8a shows the time dependence of the relative transparency per 1 m for three wavelengths, 450, 540 and 600 nm. One can see periods of degradation and fast recovery. Figure 8b shows the dependence of the relative trans-parency per 1 m on wavelength at the end of the test, after 20 minutes annealing, which represents the long term component of the degradation. It has a local minimum for blue light (∼450 nm), which agrees with [8]. On the other hand, the short term variations are somewhat larger for the blue light, than for green and red.
Taking into account the fact that the dose rate during the LHCb operation will be three orders of magnitude lower than that in the present test, and the short term variations will be negligible, one can conclude that the FVP200220240 fiber satisfies the LHCb ECAL monitoring system requirements on radiation tolerance for any wavelength within the range of 420 – 700 nm. The blue LEDs however are preferable because of higher sensitivity of the PMT photocathode to blue light, which allows to minimize the necessary quartz fiber cross section.
The results for the previously irradiated sample are shown in Figure 9. They qualitatively agree with the results for the “fresh” fibers.
5
The fiber bundle design, production, installation and commissioning
As mentioned above, each LED serves a group of 9 or 16 cells. This determines grouping the light guides into bundles, which are then split into individual fibers only near the points of connection to the calorimeter modules. This does not fit any industrial standard, therefore we had to develop a custom design. Details are shown in Figure 10. At the LED (common) side of the bundle, all the 9 or 16 fibers were glued into a brass tube with 1.25 mm inner diameter. At the module side, each individual fiber was glued into a holder made of a zirconia ferrule inserted into a brass tube. The fiber ends at both sides were cut with a diamond mill and polished with a UltraTec Minipol-1 polishing machine. At the LED side, the brass tube was glued into an end piece which fits the LED housing. This end piece
Public Note Issue: 1 5 The fiber bundle design, production, installation and commissioning Date: July 13, 2016
Figure 10 Details of the fiber bundle design: a) a 9-channel bundle; b) zoom view of the 9 module
side connectors, without end piece and nut; c) plastic end piece and nut, to be glued to each module side connector right before the installation. They are intended for the compatibility with the old optical connectors on the ECAL modules; d) zoom view of the LED side.
has two clear fibers sending a fraction of the LED light to a PIN diode for monitoring the LED flash magnitude, as it can be seen in Figure 10c. At the module side, the problem of compatibility with the old type optical connectors at the ECAL modules, to which the new light guides have to be connected, was solved by gluing the old type connector body onto the brass tube with zirconia ferrule. For this, 7000 plastic end pieces and nuts were produced at UNIPLAST (Vladimir, Russia).
The work on the ECAL monitoring system upgrade has started in October 2013 with production of the new bundles of light guides made of quartz fiber. The bundle production (total of 6016 light guides, grouped into 456 bundles) has finished in March 2014. The installation of bundles to ECAL took 3 months, February–April 2014. Few pictures from the bundle production and installation work are shown in Figure 11.
The commissioning of the new system was performed in June–August 2014. After repair or replace-ment of light guides damaged at the installation (6 out of 6016), a tuning of the configuration parame-ters of the ECAL Detector Control system and Data Acquisition system was performed. The procedure was similar to the one described in [2], it included:
• adjustment of the LED flash magnitudes;
• adjustment of the LED flash timing (it was necessary, because the refraction index of quartz is different from that of polystyrene);
• adjustment of the gain of the PIN diode amplifiers;
Public Note Issue: 1
6 Usage of the upgraded ECAL monitoring system Date: July 13, 2016
Figure 11 Pictures from the ECAL monitoring system upgrade work.
6
Usage of the upgraded ECAL monitoring system
The performance of the new LED system and its comparison with the old one is illustrated in Figure 12. The plot in Figure 12a shows the ratio of LED signal amplitudes before and after a ∼ 36 hour periods of data taking in 2016 (a) and 2012 (b). The radiation doses accumulated by ECAL during these periods were approximately equal.
Note that the distinct pattern of the light guide ageing, which is clearly visible at the 2012 plot, is absent in the 2016 one. This can be considered as a validation of the upgraded monitoring system and using it for the PMT gain correction.
As it was mentioned above, the main source of instability of the ECAL cells sensitivity comes from PMT gain variation, which can amount to few percent at a time scale of ∼1 day. The radiation damage of scintillator and WLS fibers is essential for the central cells, and gives noticeable decrease of the light yield at a time scale of ∼1 month.
At Run II, the ECAL calibration procedure consists of two parts [10]. First, we stabilize the sensitivities of ECAL (and HCAL) cells at certain values by means of regular adjusting their high voltages (at the end of each LHC fill) using the LED data. Then, the π0based calibration [5] is performed once per few
Public Note Issue: 1
8 References Date: July 13, 2016
Figure 12 LED signal variations in each ECAL cell for new and old monitoring systems: a) ratio of
LED signal amplitudes on May 21, 2016 to those on May 20, 2016 (22 pb−1 at 13 TeV) ; b) ratio of LED signal amplitudes on June 2, 2012 to those on June 1, 2012 (39 pb−1 at 8 TeV). The radiation
dose in both cases is approximately the same. Note the presence of the light guide ageing pattern in
b) and its absence in a).
7
Conclusion
The accuracy of the original LED monitoring system of the LHCb ECAL appears to suffer from ra-diation damage of the light guides transporting LED light to PMTs and made of plastic clear fibers (KURARAY Clear-PSM). The upgrade consisting in replacement of the light guides to radiation tol-erant ones made of quartz fiber was performed during the LHC Long Shutdown I, in 2013-2014. The irradiation tests of quartz fibers were performed in 2013 and 2014. The degradation rates of quartz fibers turned out to be about 3 orders of magnitude better than that of plastic fibers.
The upgraded system is used since the beginning of the LHC Run II for the PMT gain following within few % accuracy and automatic adjustment of PMT HV such that to keep their gains stable.
8
References
[1] A.A. Alves et al, The LHCb detector at LHC, JINST 3:S08005, 2008
[2] I. Machikhiliyan and V. Lindahl, Calibration of photomultipliers and initial adjustment of the LHCb Electromagnetic Calorimeter for pilot LHC runs, LHCb-PUB-2013-010, 2013
[3] Yu. Guz, LHCb Calorimeter Upgrade, Proceedings of CHEF2013, 22-25 April 2013, Paris, 2013, p. 335
[4] G. Corti and L. Shekhtman, Radiation background in the LHCb experiment, CERN-LHCb-2003-083, 2003
[5] I.M. Belyaev, D.Yu. Golubkov, V.Yu. Egorychev and D.V. Savrina, Instrum. Exp. Tech. 57 No. 1 (2014), 33
[6] LHCb Collaboration, Framework TDR for the LHCb Upgrade, CERN/LHCC 2012-007, 2012 [7] A.N. Gurzhiev, L.K. Turchanovich and V.G. Vasilchenko, IFVE-95-121, Instrum. Exp. Tech. 39
(1996) 684
[8] I. Dumanoglu et al, Nucl. Instr. Meth. A 490 (2003) 444 [9] K. Cankocak et al, Nucl. Instrum. Meth. A 585 (2008) 20
[10] S. Borghi et al, Novel real-time alignment and calibration of the LHCb detector and its perfor-mance, 14th Vienna Conference on Instrumentation, Vienna, Austria, 15 - 19 Feb 2016