Publisher’s version / Version de l'éditeur:
CIM Journal, 9, 2, 2018-04-15
READ THESE TERMS AND CONDITIONS CAREFULLY BEFORE USING THIS WEBSITE. https://nrc-publications.canada.ca/eng/copyright
Vous avez des questions? Nous pouvons vous aider. Pour communiquer directement avec un auteur, consultez la première page de la revue dans laquelle son article a été publié afin de trouver ses coordonnées. Si vous n’arrivez pas à les repérer, communiquez avec nous à [email protected].
Questions? Contact the NRC Publications Archive team at
[email protected]. If you wish to email the authors directly, please see the first page of the publication for their contact information.
NRC Publications Archive
Archives des publications du CNRC
This publication could be one of several versions: author’s original, accepted manuscript or the publisher’s version. / La version de cette publication peut être l’une des suivantes : la version prépublication de l’auteur, la version acceptée du manuscrit ou la version de l’éditeur.
For the publisher’s version, please access the DOI link below./ Pour consulter la version de l’éditeur, utilisez le lien DOI ci-dessous.
https://doi.org/10.15834/cimj.2018.11
Access and use of this website and the material on it are subject to the Terms and Conditions set forth at
Laser-induced breakdown spectroscopy of molten matte
Moreau, André; Hamel, André; Bouchard, Paul; Sabsabi, Mohamad
https://publications-cnrc.canada.ca/fra/droits
L’accès à ce site Web et l’utilisation de son contenu sont assujettis aux conditions présentées dans le site LISEZ CES CONDITIONS ATTENTIVEMENT AVANT D’UTILISER CE SITE WEB.
NRC Publications Record / Notice d'Archives des publications de CNRC:
https://nrc-publications.canada.ca/eng/view/object/?id=00f0f891-64f6-4a5b-ad33-b439702c7883 https://publications-cnrc.canada.ca/fra/voir/objet/?id=00f0f891-64f6-4a5b-ad33-b439702c7883
LASER-INDUCED BREAKDOWN SPECTROSCOPY OF MOLTEN MATTE
*André Moreau, André Hamel, Paul Bouchard, and Mohamad Sabsabi
National Research Council of Canada 75 de Mortagne Blvd.
Boucherville, QC Canada J4B 6Y4
(*Corresponding author: [email protected]) ABSTRACT
Laser-Induced Breakdown Spectroscopy (LIBS) is an atomic spectroscopy technique used to measure elemental concentrations. It is well-adapted to in-situ and in-line measurements during materials processing in general, and pyrometallurgy in particular. It is an optical non-contact technique and it can measure nearly all elements, including light elements. Our group has developed a mobile prototype system to measure molten metals. The system includes a tube, also called a lance, one end of which is immersed in the molten metal. An inert gas flows in the tube and bubbles out below the surface. The LIBS measurement is made through the tube and onto the bubble’s surface. This is done to avoid measuring contaminants, slag, or fluxes often found at the surface of the melt. An added benefit is that the molten surface is constantly renewed and thus, more representative of the bulk. An alternative to using our lance is to use a tuyère, such as a gas injection tuyère in a converter, as we did several years ago in a nickel matte converter. In this presentation, we will show various applications emphasizing more recent developments. This includes the simultaneous measurement of the concentrations of Cu, Ni, Fe, Co and S in molten matte at 1125 °C. The more obvious industrial applications of the technology include determining the best time to end oxygen blowing in the converter and elemental concentration measurement during alloying.
KEYWORDS
INTRODUCTION
The mining industry continually faces challenges in optimizing cost and productivity. Because of the large volumes of materials that are being processed, small improvement can have a big impact on benefits. Better real-time information can help improve this optimization.
Copper-nickel concentrate contains typically roughly 10% copper, 10% nickel, 40% iron, 35% sulfur and 5% silica (all concentrations are expressed in weight % in this paper). The concentrate is melted in a flash furnace whereby the energy is provided by oxidizing some of the sulfur and iron. Silica and iron oxide, being lighter, float on the surface, and a mixture of molten metal and sulfur, called matte, sinks to the bottom. The two are separated by decantation. At this point, the molten matte contains approximately equal concentrations of copper, nickel, iron and sulfur. The molten matte is then sent to a converter where oxygen is blown in. Thermodynamics insures that sulfur and iron are oxidized first, before copper and nickel. However, if the oxygen blow is extended for too long, some copper and nickel will be oxidized and lost, and the refractories can be damaged. Therefore, it is important to know the matte composition either before it is introduced in the converter or inside the converter. If it could be measured inside the converter, the oxygen blow could be interrupted just as the concentration of iron is reduced to near zero. However, the only method to take a converter sample is to stop the process and manually take a sample. This is a hazardous activity. Moreover, the process stays idle, which is expensive in terms of lost production. Alternatively, a matte sample can be taken and analyzed at the exit of the flash furnace, before it is introduced into the converter, to estimate the required oxygen blow duration.
After manually sampling the molten matte, the sample is cooled and solidified, its surface prepared, and the sample is analyzed in a laboratory. This takes time during which the process continues to operate. It would be much better if the concentrations could be obtained without delay and without manual sampling. Laser-induced breakdown spectroscopy (LIBS) is an emerging analytical technique that can be used inline to measure atomic concentrations in real time without the need for human intervention.
With LIBS, a short and energetic laser pulse is directed on the surface of the material to be analyzed. The surface is ablated, mixed with air, and heated into plasma at a temperature of order 104 K. Electromagnetic radiation (ultraviolet, visible, and near infrared) emitted by the plasma is then collected and analyzed in a spectrometer, much like in other atomic spectroscopy techniques. The intensity of various emission lines is then correlated to the atomic concentrations. The technique is well-known and is described in textbooks (Cremers & Radziemski, 2006; Singh & Thakur, 2007; Noll, 2012). The main advantage of LIBS, as compared to other atomic spectroscopy techniques, is that it can be deployed in the field and is not restricted to the laboratory. This is because it does not require any sample preparation as long as the surface is representative of the bulk (if not, then LIBS measurements are representative of the surface).
LIBS has been used to measure elemental concentration in a variety of molten metals. In the simplest arrangement, the measurement is made directly on the melt surface (Carlhoff, Lorenzen, Nick, & Siebeneck, 1988; Aragón, Aguilera, & Campos, 1993; Paksy, Nemet, Lengyel, & Kozma, 1996; Gruber, Heitz, Strasser, Bäuerle, & Ramaseder, 2001; Chen, Lu, & Li, 2010). In practice, however, melt surfaces are often covered with slag, fluxes, or impurities, or may have a different composition due to composition gradients. Therefore, the surface may not be representative of the bulk. To circumvent this problem, some authors have used a gas injection port already present on a converter. Such port can be used to inject an inert gas to stir and mix the melt (as in the steel industry) or to inject oxygen to oxidize iron and sulfur in molten matte. The gas injection port is used as an optical viewport and the LIBS measurement is made though that port (Lorenzen, Carlhoff, Hahn, & Jogwich, 1992; Hubmer, Kitzberger & Mörwald, 2006).
Another solution is to insert a tube below the surface. The tube is filled with an inert gas with enough pressure to compensate for the hydrostatic pressure of the molten metal. This allows making the LIBS measurements on a static surface that should be free of surface contaminants. In addition, an optical
element is brought close to the melt surface. The optical element is either water cooled (Peter, Sturm, & Noll, 2003) or cooled by a flow of inert gas (Rai, Yueh, & Singh, 2002).
Another approach is to let the gas escape the tube and bubble into the molten metal (Sabsabi, Héon, & Lucas, 2003; Lucas, Sabsabi, & Héon, 2005; Baril, St-Onge, Sabsabi, & Lucas, 2004). With this approach, the surface is constantly moving. This causes fluctuations in the position of the plasma with respect to the tube and fluctuations in the amount of light that is collected. On the other hand, the surface is constantly re-formed. This is advantageous because molten metals usually react very quickly with traces of oxygen that might be present in the inert gas and form surface oxides of a different composition. Also, molten metals often contain small particles that can migrate to the surface either by their own buoyancy or by surface tension effects. Constantly re-building the surface prevents the accumulation of such particles. Finally, in this approach, no optical element is located in the tube. This greatly simplifies engineering (Sabsabi, St-Onge, Detalle, & Lucas, 2004).
A difficulty of LIBS technology is that inherent random fluctuations in the laser light pulse used to generate the plasma cause random fluctuations in the plasma dynamics and the amount of light received by the photodetector. Moreover, for measurements inside a gas bubble below the surface of molten metal, the bubble surface constantly changes in position and angle. This causes more fluctuations in plasma generation and in the amount of light collected. Therefore, one cannot rely on the absolute value of an emission line intensity to estimate the elemental concentration. Ratios of line intensities must be taken. Normally, the ratio is obtained by dividing by the intensity of a line of a major element, i.e. one that makes up nearly 100% of the composition, because small variations in the concentration of a major element will not affect the ratio. However, this cannot be done for molten matte when four elements (Cu, Ni, Fe, S) have varying concentrations in the 20-30% range.
This paper will demonstrate how to simultaneously use two different spectrometers and obtain absolute concentrations for five minor elements simultaneously, in molten copper-nickel matte at 1100 °C.
EXPERIMENTAL SETUP Setup and Spectral Windows
Figure 1 shows a schematic diagram of the experimental setup and a picture of how the probe is set up in our laboratory. The bottom end of a tube evacuated with an inert gas (argon or nitrogen) is inserted inside the melt. The gas flows continuously thus creating bubbles at the end of the tube. A laser pulse creates plasma on the internal surface of the bubble. The light emitted by the plasma is collected and sent to a remote spectrometer via an optical fiber. The remote spectrometer and camera are used to record the emission spectrum which is then analyzed using a computer (not shown).
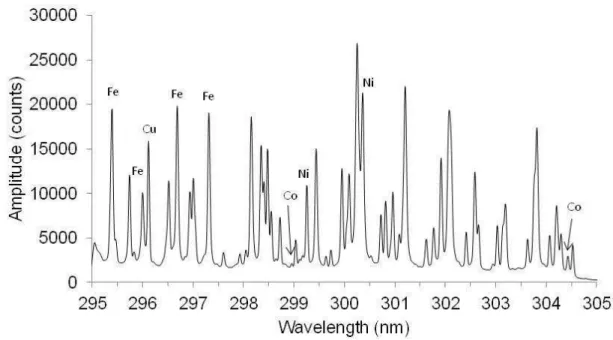
The goal was to obtain the absolute concentration of the five most important elements in the molten matte, namely copper, nickel, iron, and sulfur, each with concentrations in the 20-30% range, and cobalt at less than 1%. Iron and, to a lesser extent nickel, have very numerous emission lines. On the other hand, copper, sulfur and cobalt have few. To avoid interference between the emission lines, a spectrometer with relatively high resolution is needed. Next, we looked for a narrow region of the spectrum that would contain as many of the elements as possible. Copper, having relatively few intense emission lines, restricted the choices. The region between 295 and 305 nm was selected (Fig. 2). In this region, copper, nickel, iron and cobalt emission lines are present and at least one line per element can be resolved without interference from the other elements. There remained sulfur which can be analyzed either in the vacuum ultraviolet (VUV) region, near 182 nm, or in the near infrared near 922 nm. The VUV region is difficult to use in industrial systems so the near infrared triplet was chosen. This triplet is not as intense and requires relatively high laser pulse energy so that it may be sufficiently excited to produce an easily measurable signal. On the other hand, this region of the spectrum is not crowded with iron and nickel emission lines and does not require a high resolution spectrometer (Fig. 3).
Figure 1 – Left: Schematic diagram of LIBS measurements inside a melt. Right: LIBS probe with quartz tube inserted in furnace containing molten matte at 1100 °C. The vertical tube held by steel rods is a
thermocouple well.
Figure 2 – Spectral window, from 295 to 305 nm, showing emission lines for the four elements of interest: Cu, Ni, Co, Fe. The measurement was taken in molten furnace matte near 1125°C in a nitrogen
atmosphere. Average of 100 spectra.
N2or Ar gas Bubbles Plasma Camera Remote Spectrometer Fiber bundle Melt
Figure 3 – Spectral window, from 850 to 930 nm, showing emission lines for S, N, and Fe. Measurement taken in molten furnace matte near 1125°C in a nitrogen atmosphere. Average of 100 spectra.
Procedures
To vary the concentration of the four major elements, we made separate additions of copper sulfide (Cu2S), nickel sulfide (Ni3S2), iron sulfide (FeS) and copper metal. Sulfides were used, as opposed
to metallic elements, because sulfur is the element responsible for lowering the melting temperature. Using these sulfides allowed varying the concentration of one metallic element concentration at a time and monitoring the response of the system. Cobalt concentration was not wilfully modified, although the sulfides contained negligible amounts of Co and the cobalt concentration was diluted with each addition. Pure copper was used at the end to lower the sulfur content, which otherwise would have stayed nearly constant throughout the measurements.
The measurements proceeded as follows. Approximately 3.2 kg of matte was melted. The LIBS system was turned on, immersed in the molten matte, and made measurements continuously at a rate of 2 Hz. Temperature was allowed to reach at least 1125 °C and was maintained above 1125 °C for at least 10 minutes. At the end of that period, a melt sample was taken and a sulfide or metal addition was made. Each sulfide addition cooled the melt by 20 to 60 °C. Therefore, we waited for the temperature to return to above 1125 °C for at least another 10 minutes. The procedure of addition, wait, and sampling was repeated 12 times. Later the melt samples were sent to for analysis by induction coupled plasma spectroscopy (ICP).
RESULTS AND ANALYSIS Laboratory Measurement of Chemical Concentrations
The ICP lab analysis generally agreed well with predicted concentrations from the masses of the additions. From the measured weight and concentration in the first sample and the masses of the additions, and ignoring the small masses of the removed samples, we calculated the expected concentration for the remaining samples. The root mean square (rms) error between the measured and calculated concentrations are 0.4% for iron, 0.1% for copper, 0.7% for nickel, 0.005% for cobalt, and 0.2% for sulfur. For Nickel, nearly all of the difference was due to a systematic difference between the measured and estimated values.
The random component of the measured rms error is estimated at 0.3 %. Finally, the sum of the measured concentration is within a few tenths of 1% of 100%.
These results indicate that there was no significant amount of chemical reaction (like oxidation) happening in the melt and good mixing of the additions. The lack of significant oxidation may be due part to the inert gas that bubbles in the melt and then covers the surface of the melt, protecting it from ambient air. These results also provide an estimate of the precision and accuracy of the ICP measurements. The measured wt. % concentrations of the elements varied between the following minima and maxima: 20.6 to 34.3 for iron, 13.4 to 29.4 for copper, 19.9 to 29.3 for nickel, 0.26 to 0.51 for cobalt, and 25.0 to 30.7 for sulfur.
LIBS Measurements
When doing LIBS measurements, many experimental parameters can affect the amplitude of the emission lines, including the geometry of the bubble at the end of the tube and plasma variations from laser shot to shot. In addition, our setup uses two different spectrometer coupled to different fibers in the fiber bundle. Therefore, the ratio of amount of plasma radiation that goes in one vs. the other spectrometer can vary. However, the effect of these experimental parameters is, in first approximation, to multiply the entire spectrum by an unknown scale factor. Therefore, the amplitude ratio of two emission lines is a much more robust measurement than the absolute amplitude. Therefore, all the LIBS measurements presented below are measurements of amplitude ratios. Because iron is the only element present in both spectra, iron is used as the denominator of the ratios.
A single measurement, in this paper, consists of the average of 100 spectra and lasts 50 seconds. The backgrounds of the spectra are estimated by linear interpolation between regions of the spectra that are free from emission lines. The background is then subtracted from the spectrum. The peak amplitude of each line is then estimated.
Figure 4 shows the variations of the Cu, Ni, Co and S to Fe ratios as a function of time. Clearly, the measurement of the sulfur to iron ratio is a lot noisier than the other three ratios. This is because of the low counts of the peaks (especially Fe) in the near infrared spectrometer (Fig. 3). Between each addition, there is a clear plateau. The LIBS system can easily see the effect of the additions. The first three additions of FeS, from 0 to 112 minutes, lowered the Ni, Cu and Co to iron ratios. The following three additions of Cu2S, from 112 to 222 minutes, led to an increase of the Cu/Fe ratio and left the Ni/Fe and Co/Fe ratios
unchanged. The following three additions of Ni3S2, from 222 to 315 minutes, led to an increase in Ni/Fe
and left the Cu/Fe and Co/Fe ratios unchanged. Finally, the last three additions of pure copper, from 315 to 406 minutes increased the Cu/Fe ratio and left the Ni/Fe and Co/Fe ratios unchanged. The behaviour of the S/Fe is not as easy to observe and interpret. During the FeS additions, the S/Fe ratio decrease, presumably because the iron addition increases the iron emission line faster than the sulfur addition increases the sulfur emission line. During the additions of Cu2S and Ni3S2, no iron is added and the S/Fe ratio increases.
Finally, during the addition of pure copper, the S/Fe ratio remains constant.
In many cases, there is a slight inclination to the plateaus or a small correction following a rapid change cause by an addition. These small effects are caused by temperature variations.
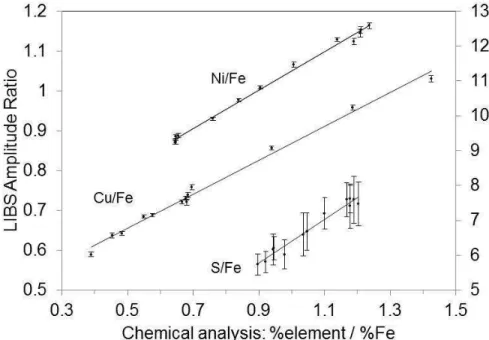
To further the analysis and remove temperature effects, measurements taken above a temperature of 1125 °C were selected and averaged. This left an average of 20, measurements per addition (minimum of 12 and maximum of 46), with, each measurement consisting of an average of 100 spectra. The amplitude ratios of emission lines were computed and plotted as function of the ratio of elemental concentrations (Fig. 5-6). These ratios were found to correlate linearly. The means of the amplitude ratios for each bath chemistry were also plotted (not shown) and the linear correlations were retained to within experimental errors. However, the advantage of Figs. 5 and 6 is to show graphically the LIBS measurement error (repeatability), with temperature effects removed. These errors are very small for all ratios except for
the sulfur to iron ratio. For the copper and nickel to iron ratios, the relative standard deviations are less than 1%. For the sulfur to iron ratio, it is less than 8%.
Figure 4 – Amplitude ratios of various emission lines as a function time. Three additions of equal weight were made for each substance. The order was FeS, Cu2S, Ni3S2, and Cu. The right scale applies to the S/Fe
ratio. The left scale applies to all other ratios. The displayed ratios are for the following emission lines: Ni 300.36 / Fe 295.39, Cu 296.12 / Fe 296.69, Co 304.44 / Fe 296.00, S 921.29 / Fe 899.96
We recall that amplitude ratios are measured because of signal fluctuations and because two different spectrometer, each having different and varying amounts of light, are used. The absolute value of the elemental concentration can be obtained by making use of the relation:
%Fe + %Cu + %Ni + %Co + %S = 1 ,
where "%element" is the weight percent concentration of that element. Dividing by the %Fe, we obtain %�� %�� + %�� %�� + %�� %�� + %� %�� + 1 = 1 %��
Figure 5 – Amplitude ratios of emission lines vs. the respective ratio of the elemental concentrations. The following ratios were taken: Ni 300.36 / Fe 295.39 (left vertical axis), Cu 296.12 / Fe 296.69 (left vertical axis), and S 921.29 / Fe 899.96 (right vertical axis). Each dot and vertical bar represents the average and
standard deviation of 12 to 46 measurements. The solid lines are linear least squares fits to the data.
Figure 6 – Ratio of Co 296.12 to Fe 296.00 emission lines as a function of the ratio of Co to Fe concentration. Each dot and vertical bar represents the average and standard deviation of 12 to 46
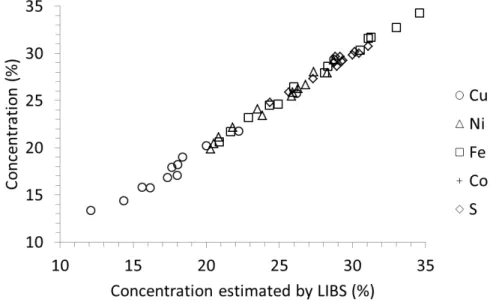
The terms on the left are estimated by LIBS by use of the measured emission line amplitude ratios and the correlation found in Figs 5-6. This allows estimating the absolute iron concentration and to use that value to convert the measured ratios to absolute concentrations. Figure 7 shows the results for all elements and bath chemistries on one graph. For each bath chemistry, the 12 to 46 measurements line amplitude ratios were averaged to produce a single measurement. This is why the scatter is so small in Fig. 7. The rms residual, i.e. the root mean square of the difference between the LIBS and chemical measurement, was estimated for each element and found to be 0.4%, 0.6%, 0.4%, 0.6%, and 0.02% for Fe, Cu, Ni, S, and Co, respectively. This is only a little larger than the precision of the ICP analysis used as reference. In fact, for iron, which should be the more difficult to estimate because it depends on all other measurement and on the above equation, the rms residual is the same as for the ICP measurement.
Figure 7 – Elemental concentration estimated by chemical analysis as a function of that measured by LIBS. The inset shows the concentrations for cobalt.
CONCLUSIONS
LIBS measurements were made on molten Cu, Ni, and Fe matte in an electric furnace at temperature near 1125 °C. Separate additions of Cu, Ni, and Fe sulfides as well as pure copper were made to the starting matte. This allowed varying the concentration of Cu, Ni, and Fe independently. Copper concentration was varied from 13.4% to 29.4% and was measured by LIBS with a precision of ± 0.6% (rms residual of Fig. 7). Nickel concentration was varied from 19.9% to 29.3% and was measured by LIBS with a precision of ± 0.4%. Iron concentration was varied from 20.6% to 34.3% and was measured by LIBS with a precision of ± 0.4%. Sulfur concentration was varied from 24.8% to 30.7% and was measured by LIBS with a precision of ± 0.4%. Finally, cobalt concentration decreased from 0.51% to 0.26% and was measured by LIBS with a precision of ± 0.02%.
The stated measurement accuracies were obtained after averaging 12 to 46 measurements, each measurement consisting in an average of 100 spectra. On the other hand, the experimental setup was not optimised, especially for the infrared spectra which contained the emission lines required to estimate the sulfur to iron ratio. With an improved setup, it should take much less averaging to obtain comparable measurement accuracy. Temperature variations affected the overall amplitude of the spectra, but affected the measurement of the elemental ratio almost negligibly.
ACKNOWLEDGMENTS
This work was funded by the Natural Resources Canada and the National Research Council of Canada. The authors thank Mustafa Fezzani and Vale Canada who graciously provided matte samples, sulfides, and the chemical analysis by ICP.
REFERENCES
Aragón, C., Aguilera, J. A., & Campos, J. (1993). Determination of carbon content in molten steel using laser-induced breakdown spectroscopy. Applied Spectroscopy, 47, 606–608.
Baril, E., St-Onge, L., Sabsabi, M., & Lucas, J. (2004). Novel method for on-line chemical analysis of continuous galvanizing baths. In Galvatech ’04 Conference Proceedings, (pp. 1095-1104). Chicago, IL: Association for Iron & Steel Technology.
Carlhoff, C., Lorenzen, C.-J., Nick, K.-P., & Siebeneck, H.-J. (1988). Liquid steel analysis by laser-induced emission spectroscopy. SPIE Vol. 1012 In-Process Optical Measurements, 194-196. Chen, K., Lu, J.-D., & Li, J.-Y. (2011). Real-time, quantitative analysis of multi elements in liquid steel by
LIBS. Spectroscopy and Spectral Analysis, 31, 823-826. (in Chinese, abstract in English).
Cremers, D. A. & Radziemski, L. J. (2006). Handbook of laser-induced breakdown spectroscopy. West Sussex, England: Wiley.
Gruber, J., Heitz, J., Strasser, H., Bäuerle, D., & Ramaseder, N. (2001). Rapid in-situ analysis of liquid steel by laser-induced breakdown spectroscopy. Spectrochimica Acta B, 56, 685–693.
Gruber, J., Heitz, J., Arnold, N., Ramaseder, N., Meyer, W., & Koch, F. (2004). In situ analysis of metal melt in metallurgic vacuum devices by LIBS. Applied Spectroscopy, 58, 457-462.
Hubmer, G., Kitzberger, R. & Mörwald, K. (2006). Application of LIBS to the in-line process control of liquid high-alloy steel under pressure. Analytical and Bioanalytical Chemistry, 385, 219–224. Lorenzen, C.-J., Carlhoff, C., Hahn, U., Jogwich, M. (1992). Applications of LIBS for industrial process
and quality control. Journal of Analytical Atomic Spectrometry, 7, 1029-1035.
Lucas, J., Sabsabi, M., & Héon, R. (June 2005). Method and apparatus for molten material analysis by LIBS, U.S. Patent No. 6,909,505. Washington, DC: U.S. Patent and Trademark Office.
Noll, R. (2012). Laser-induced breakdown spectroscopy. Heidelberg, Germany: Springer.
Paksy, L., Nemet, B., Lengyel, A., & Kozma, L. (1996) Production control of metal alloys by laser spectroscopy of the molten metals. Part I: Preliminary investigations. Spectrochimica Acta B, 51, 279–290.
Peter, L., Sturm, V., & Noll, R. (2003). Liquid steel analysis with LIBS in the vacuum ultraviolet. Applied
Optics, 42, 6199-6204.
Rai, A. K., Yueh, F.-Y., & Singh, J. P. (2002). High temperature fiber optic laser-induced breakdown spectroscopy sensor for elemental analysis of molten alloys. Review of Scientific Instruments, 73, 3589-3599.
Sabsabi, M., Héon, R., & Lucas, J. (Sept. 2003). Method and apparatus for in-process liquid analysis by laser induced plasma spectroscopy. U.S. Patent No. 6,700,660. Washington, DC: U.S. Patent and Trademark Office.
Sabsabi, M., St-Onge, L., Detalle, V., & Lucas, J. M. (2004). Laser-induced breakdown spectroscopy: A new tool for process control. In Proceedings of the World Conference on Nondestructive Testing, Montreal, QC 2004. Retrieved from
http://www.ndt.net/search/docs.php3?showForm=off&AuthorID=3053
Singh, J. P. & Thakur, S. N., (Eds.) (2007). Laser-induced breakdown spectroscopy. Amsterdam, Netherlands: Elsevier.